Will have a big drop1. Due to inflation and the operating cost in the UK, profit will drop for a while
2. Technically towards a big drop
3. Div. Not attractiv

VERY Bearish Outlook on Aviva plc (PINE.L):The recent disclosure by Citigroup Global Markets highlights heightened volatility and speculative market actions, suggesting underlying uncertainty in Aviva plc's future prospects. With the company currently embroiled in takeover or merger discussions, short-term traders are actively taking positions both through traditional equities and cash-settled derivatives, such as Total Return Swaps (TRS).
The substantial activity in derivative positions, notably the heavy closing and reduction of short positions, suggests market players perceive limited further downside, yet the significant selling of physical shares—902,108 shares in a single day—could indicate institutional caution regarding Aviva's future performance or concerns about the acquisition terms being unfavorable for shareholders.
Despite Aviva’s attempts at strategic transformation—particularly focusing on technology and streamlined business models—the uncertainties related to potential integration issues, regulatory scrutiny, and post-merger operational complexities remain significant risks. Given the current market dynamics and the speculative nature surrounding the ongoing deal, short-term volatility may escalate, posing considerable risks for current shareholders.
Additionally, the rebranding and strategic pivot of Aviva from traditional insurance towards technology-driven services, while conceptually appealing, remain unproven in delivering consistent growth and shareholder value. Any delays, operational missteps, or competitive pressures from established technology companies in the automotive SaaS space could negatively impact profitability and investor sentiment, potentially eroding share value further.
Considering geopolitical tensions, macroeconomic uncertainty, and potential disruption in technology and financial markets, Aviva’s ambitious transition towards a focused tech entity remains precarious and subject to external vulnerabilities

River Might Be Handing Out Easy Money! After breaking a diagonal formation, River is attempting a rally with volume. While the initial reactions may not be convincing, scaling into positions could be a good approach.💰🚀
If the diagonal breaks downward, it would provide an even better buying opportunity. In that case, buying around 25 and holding for a long-term target of 60 could be a strong strategy. 📈🔥

Head and Shoulders Pattern on the 1H and Daily TimeframesKey Observations:
1. **Bullish Gartley Pattern on the 2-Day Timeframe**
- This is a strong reversal pattern, indicating potential upside.
2. **Head and Shoulders Pattern on the 1H and Daily Timeframes**
- The **inverted head and shoulders** suggests a bullish breakout, especially after a long consolidation phase.
3. **Consolidation for Almost 3 Years**
- If this consolidation is ending, a breakout could be significant.
4. **Indicators Showing Bullish Divergence**
- **MACD turning up**
- **RSI divergence (lower price, higher RSI)**
### Potential Upside Target: **178 GBX**
- If the reversal plays out, your projection to **178 GBX** is possible.
However, keep an eye on key resistance levels like **116.4**, **127.3**, and **151.5**. If price struggles at these levels, short-term retracements might occur before a full breakout.
As of June 2024, Alphawave IP Group plc (LON:AWE) reported the following financial figures:
- **Debt-to-Equity Ratio**: 49.6%, with total debt of US$217.9 million and total equity of US$439.2 million. citeturn0search0
- **Cash and Cash Equivalents**: US$76.3 million. citeturn0search0
Additionally, the company's total assets were US$873.0 million, and total liabilities amounted to US$433.8 million. citeturn0search0
These figures indicate that Alphawave IP Group has a moderate level of debt relative to its equity and maintains a cash position that contributes to its financial flexibility.
⚠ **Not Financial Advice** – Always manage risk and confirm signals before trading.

IAG maintains its interest in acquiring TAP Air PortugalBy Ion Jauregui –ActivTrades Analyst
International Airlines Group (IAG), which includes airlines such as British Airways, Iberia and Vueling, has reiterated its interest in acquiring a majority stake in TAP Air Portugal. The move follows the abandonment of plans to acquire Air Europa due to regulatory obstacles, underlining the strategic importance of TAP to IAG's expansion in the transatlantic market.
IAG's strategy
Lessons from the Aer Lingus acquisition: In 2015, IAG acquired Aer Lingus after committing to maintain the brand, route network and local jobs in Ireland. This strategy was key to gaining approval from the Irish government and the European Commission. IAG is likely to adopt a similar approach in the case of TAP, ensuring the preservation of the Portuguese airline's identity and operations to gain favor with the Portuguese authorities.
Regulatory and strategic considerations- Antitrust: IAG's acquisition of TAP could face scrutiny from European Union competition authorities, similar to the challenges that led to the abandonment of the Air Europa acquisition. However, the strong financial position of IAG, which recently announced the return of €1.4 billion to its shareholders after doubling its profits, could strengthen its position in the negotiations.
Technical Aspect
Currently IAG has bounced twice in the last price consistency zone where the last bounces occurred. At the moment on the weekly and daily charts the price has lost strength and the RSI is at its mid-zone at 51.82%. This current formation seems to be an impulse wave that if it accompanies with the company's movements, will make the firm's share price advance in the direction of the last 2017-2020 highs area.If the bullish formation is confirmed the first milestone to reach would be €358-368/share. If this is confirmed the stock may try to seek €426.8/share. If the formation is not confirmed it is likely that the stock will correct in the direction of the previous range of 178.42-135.23 euros/share.
Conclusion
The potential acquisition of TAP by IAG represents a strategic opportunity to consolidate its presence in the transatlantic market and strengthen its route network in South America and Africa. Competition from other European groups and regulatory considerations will be determining factors in the success of this transaction.
*******************************************************************************************
The information provided does not constitute investment research. The material has not been prepared in accordance with the legal requirements designed to promote the independence of investment research and such should be considered a marketing communication.
All information has been prepared by ActivTrades ("AT"). The information does not contain a record of AT's prices, or an offer of or solicitation for a transaction in any financial instrument. No representation or warranty is given as to the accuracy or completeness of this information.
Any material provided does not have regard to the specific investment objective and financial situation of any person who may receive it. Past performance is not reliable indicator of future performance. AT provides an execution-only service. Consequently, any person acing on the information provided does so at their own risk.

EUZ Europa Metals Just for fun, curious if it will play out.
Most probably needs to base under red resistance more before going back to ATH
1 Mil cap to 1 Bil cap
Not financial advice

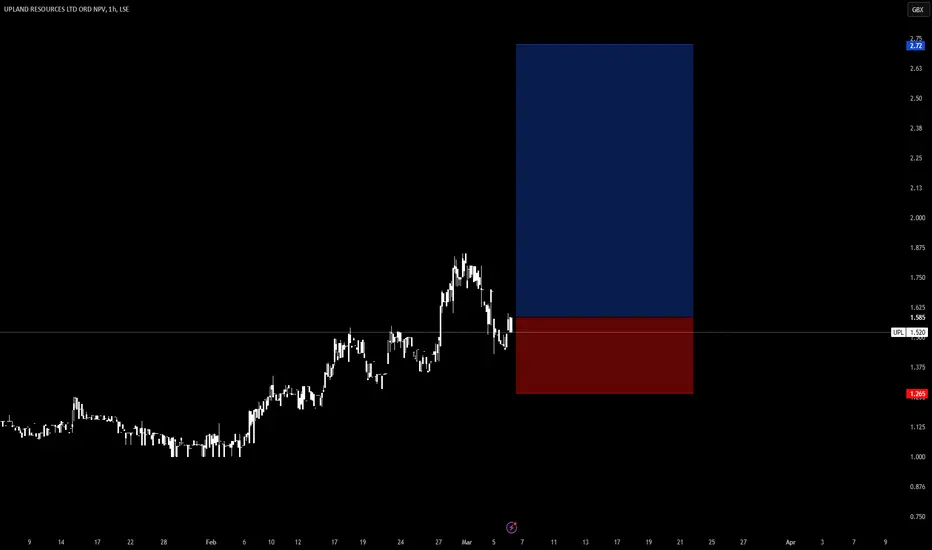
Long Upland Resources for a potential 75% + increase n my considered estimation, we stand on the precipice of a potentially transformative announcement from Upland Resources, with the temporal horizon suggesting mere days until the dissemination of favorable tidings. Should the company unveil substantive developments pertaining to its prospective ventures within the geopolitically significant domains of Brunei and/or Sarawak, the financial implications could be profound. Such disclosures, particularly if they illuminate advancements in exploration or production initiatives, might catalyze a robust revaluation of the company’s equity valuation—a phenomenon colloquially termed a “re-rate” in market parlance.
The intricate interplay of regional energy dynamics and Upland’s strategic positioning in Southeast Asia amplifies the potential for such news to serve as a fulcrum for share price appreciation. Investors, attuned to the nuances of upstream oil and gas prospects, may perceive any concrete progress—be it in the form of production-sharing contracts, joint ventures, or technical milestones—as a signal to recalibrate their risk-reward calculus. This, in turn, could precipitate a surge in market sentiment, driving a virtuous cycle of capital inflows and upward price momentum, thereby rewarding those with the prescience to anticipate this inflection point in Upland Resources’ corporate narrative.
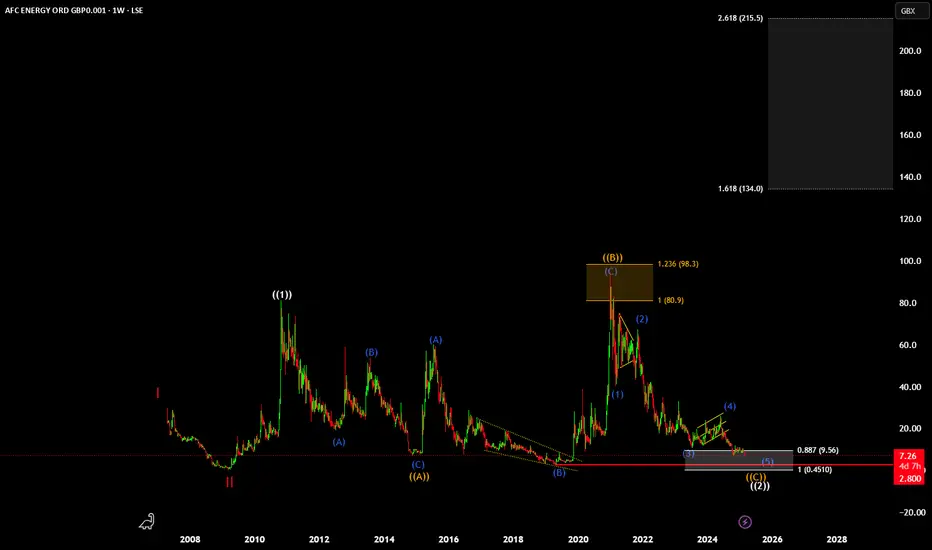
AFC Energy PLC - high risk with high reward (?)This chart doesn´t look very appealing because of the high volatility and the very deep retracement are not exactly a sign of strength. However, if this company can turn things around the reward is extremely good.
I would advice to only invest a small fraction of you portfolio in this stock!
PREM outlookDouble Bottom, an extremely volatile stock
If it turns around here, bullish divergence confirmed
Not financial advice

GWMO high risk playBreakout and backtest (need daily to see)
May go up now?
Huge risk huge reward as they say
Not financial advice

Fresnillo Breakout Back Test then upWith Silver prices Lagging Gold and silver miners lagging price Fresnillo feels like this diagonal breakout will be sustained. Looking for re-entries at the back test diagonal as indicated at 680dollar region which may tie in with Q4 earnings release on 4th of March.
A Silver Miner on radar which can run hard. Targets indicated.

A Bearish Case for Diageo: Breaking Critical Support LevelsThe descending triangle pattern on Diageo’s weekly chart presents a strong bearish signal, suggesting that the stock may be poised for a deeper decline. Historically, descending triangles indicate mounting selling pressure, and with price action nearing critical support levels, the risk of a breakdown is significantly high.
Currently, Diageo is approaching key lows last seen in 2020, around 2050, a level that previously acted as a strong support zone. However, the confluence of technical factors suggests this support may not hold:
1️⃣ Fibonacci Retracement Confluence – Just below 2050, the 2026 level aligns with a key long-term Fibonacci retracement. While this could act as a temporary support zone, the broader technical setup suggests further weakness.
2️⃣ The Psychological 2000 Level – Round numbers often serve as psychological barriers in the market, but with a descending triangle breakdown, this level may fail to provide meaningful support.
3️⃣ Measured Move Target: 1875 – When analysing the height of the descending triangle pattern, its projected move suggests a breakdown well beyond the above-mentioned support levels. A clean breach of 2050 could see a swift move lower, with 1885 emerging as the next major target.
With the weight of these technical indicators aligning, the path of least resistance appears to be downward. Unless Diageo finds an unexpected catalyst for recovery, breaking these key levels could trigger further selling momentum, forcing the stock into deeper correction territory. Traders and investors should approach this setup with caution, as the evidence strongly favours a bearish continuation. 🚨📉
N.B. Understanding the Descending Triangle Pattern
A descending triangle is a bearish chart pattern that forms when the price action is characterized by a series of lower highs converging towards a horizontal support level. This pattern signals increasing selling pressure, as buyers fail to push prices higher while sellers continuously drive prices downward.
Key Features of a Descending Triangle
1️⃣ Horizontal Support Line – The price consistently finds support at a particular level, creating a flat base.
2️⃣ Lower Highs – Price fails to reach previous highs, forming a descending trendline.
3️⃣ Breakout Expectation – A descending triangle typically breaks downward once sellers overwhelm buyers at the support level.
4️⃣ Volume Decline & Expansion – Volume usually declines as the pattern develops and increases significantly at the breakout.
________________________________________
How to Measure the Descending Triangle
To predict a potential price target, traders measure the height of the triangle and project it downward from the breakout point.
✅ Step 1: Identify the Pattern
• Find the flat support level where price repeatedly bounces.
• Draw a descending trendline connecting the lower highs.
✅ Step 2: Measure the Height
• Take the distance from the highest point of the triangle (initial peak before lower highs start forming) to the horizontal support level.
• Example: If the high of the triangle is 2675 and the support level is 2275, the height is 400 points.
✅ Step 3: Project the Breakdown Target
• Once price breaks below the support level, subtract the measured height from the breakdown point.
• Example: If the breakdown occurs at 2275, then:
o 2275 - 400 = 1875 (expected price target).
________________________________________
Confirming the Breakout
📉 Bearish Confirmation:
• A daily or weekly close below support, ideally with an increase in volume.
• Retests of the broken support level that now act as resistance.
⚠️ False Breakouts:
• Sometimes, price may briefly dip below support and reverse higher.
• Confirmation is key before entering trades based on the descending triangle pattern.
________________________________________
Final Thoughts
A descending triangle is a powerful bearish signal, particularly when seen in downtrends. Traders use it to identify potential breakdown opportunities and set realistic price targets. Risk management is crucial, as false breakouts can occur, and waiting for confirmation increases the probability of a successful trade.
Disclaimer:
The information posted on Trading View is for informative purposes and is not intended to constitute advice in any form, including but not limited to investment, accounting, tax, legal or regulatory advice. The information therefore has no regard to the specific investment objectives, financial situation or particular needs of any specific recipient. Opinions expressed are our current opinions as of the date appearing on Trading View only. All illustrations, forecasts or hypothetical data are for illustrative purposes only. The Society of Technical Analysts Ltd does not make representation that the information provided is appropriate for use in all jurisdictions or by all Investors or other potential Investors. Parties are therefore responsible for compliance with applicable local laws and regulations. The Society of Technical Analysts will not be held liable for any loss or damage resulting directly or indirectly from the use of any information on this site.

Mercia Asset Management NAV >54pBased on their balance sheet (FCF) their NAV is around 54p. They have a diversified investment portfolio and a strong management team. I bid for monies from them once with a spin -out company in the medical technology space, they are savvy investors in my opinion and invest where there is tangible evidence of a forward order book and sales growth, not cash burn. There has been a significant accumulation of the shares over the last 5 days, some are accumulating a position from 27.5p +

Swatch stock is considered a contrarian story for a few key reasSwatch stock could be considered a contrarian investment due to a combination of factors suggesting it's currently undervalued and facing headwinds, while also possessing inherent strengths that could lead to a future turnaround. Here's a breakdown of why:
Negative Sentiment & Challenges:
Contrarian Investment Thesis (Potential Upsides):
Contrarian Classification: Stockopedia classifies Swatch as a "Contrarian" stock based on a composite score of fundamental and technical measures. This suggests that the stock exhibits characteristics that are out of favor but potentially offer value.
Undervalued: Swatch is currently undervalued.
Strong Financial Health: Despite challenges, InvestingPro data indicates Swatch maintains a "GOOD" financial health score with positive indicators. The company has impressive gross profit margins and a strong current ratio, indicating operational efficiency and liquidity.
Solid Balance Sheet: Swatch has a strong balance sheet with substantial cash and equivalents, and significant property value, with very little financial debt.
Dividend Yield: Swatch offers a dividend yield of around 3.92%, providing some return for investors even during a downturn.
Experienced Management & Family Ownership: The Hayek family's partial ownership suggests management is invested in the long-term success of the company.
Potential for Recovery: Swatch itself suggests 2025 "promises positive momentum worldwide," although they acknowledge continued restraint in Chinese demand.
Brands & Market Position: Swatch owns well-known brands across different price segments, giving it a broad market reach.

THE DIAMOND MARKET: TRADITION MEETS INNOVATION💎 THE DIAMOND MARKET: TRADITION MEETS INNOVATION
Sector Analysis | February 8, 2025
By: @dcalphaofficial
Introduction
The diamond sector in 2025 stands at a crossroads between tradition and innovation. Natural diamond markets are under siege, with revenue declines and shifting consumer preferences, while lab-grown diamonds 🧪 continue to gain market share. In this analysis, we break down the financial performance, key players, market trends, and strategic investment opportunities shaping the sector's future.
1. Market Size and Performance 📊
Natural Diamonds:
Valued at $94.19 billion in 2023, projected to reach $128.18 billion by 2032 (CAGR: 4.5%).
Recent volatility 📉: Chinese demand has dropped by 50% since pre-pandemic levels, leading to oversupply.
Lab-Grown Diamonds:
Expected to hit $38.86 billion by 2029 (CAGR: 8.3%).
Market share is rising 📈 due to ethical sourcing 🌱 and affordability 💲, especially for engagement rings.
2. Key Players in the Sector 🏆
Natural Diamond Companies:
De Beers LSE:AAL : Revenue fell to $4.3 billion in 2024; strategic restructuring is underway.
Alrosa PJSC: Holding 30% of global supply despite Western sanctions; maintaining alternative sales channels.
Petra Diamonds ( LSE:PDL ) & Gem Diamonds ( CBOE:GEMD ): Focused on high-value rare stones to mitigate pressure.
Lab-Grown Diamond Companies:
Diamond Foundry: Producing high-quality diamonds for jewelry and industrial use.
Lightbox: De Beers’ venture; initially aimed at budget-conscious buyers but now faces fierce competition.
ABD Diamonds & Clean Origin: Direct-to-consumer leaders with a strong ethical appeal.
3. Financial Analysis 💰
Natural diamonds: Revenue down 21% 📉 due to inventory buildup and low demand.
Lab-grown firms: Experiencing production growth 📈, with volumes doubling in key markets.
Profitability:
Natural diamond companies are under pressure, while lab-grown firms enjoy higher margins 💲—but face pricing pressures.
Valuation Metrics:
P/E Ratios: Negative for many natural diamond firms, reflecting concerns.
P/S Ratios: Low for natural diamonds, possibly indicating undervaluation 🤔, while lab-grown firms' ratios remain high due to growth expectations.
4. Market Trends and Challenges 📈🔍
Consumer Trends:
Younger demographics favor lab-grown diamonds 🌱 due to ethical and financial reasons.
Supply & Demand:
Oversupply of natural diamonds is suppressing prices 📉, while lab-grown production continues to grow steadily.
Technological Innovation:
Advances in lab-grown diamond tech have democratized access, raising saturation concerns.
Regulatory Environment:
Sanctions on Russian diamonds 🇷🇺.
Evolving regulations around certification and marketing for lab-grown diamonds.
5. Investment Thesis 💡
Natural Diamonds:
Undervaluation Potential: Companies like Anglo American (De Beers' parent) may offer value if market recovery succeeds.
Risks: High volatility 📉, geopolitical risks 🌍, and competition from lab-grown diamonds 🧪.
Lab-Grown Diamonds:
Growth Opportunity: Strong case for firms scaling production while keeping quality high.
Challenges: Market saturation ⚠️, pricing pressures, and need for brand differentiation.
6. Strategic Recommendations 📊💼
Diversification:
Look for companies offering both natural and lab-grown diamonds, or those with strong commodity portfolios 🛢️.
Innovation Focus:
Target firms leveraging industrial applications for lab-grown diamonds, which could support long-term growth.
Market Timing:
Monitor for signs of market recovery in natural diamonds or major strategic shifts 🔄 (e.g., De Beers' restructuring).
Conclusion 🏁
The diamond market’s future depends on adaptation to consumer trends and embracing innovation. Natural diamond companies face the challenge of revitalizing demand, while lab-grown firms need to manage growth and pricing pressures. Both offer investment opportunities but require careful strategic navigation.
💬 What’s your take on the diamond market's future?
Will natural diamonds make a comeback, or will lab-grown diamonds dominate the market?

$AAL ANGLO AMERICAN: ROCK SOLID OR CRACKING UNDER PRESSURE?💥 ANGLO AMERICAN: ROCK SOLID OR CRACKING UNDER PRESSURE?
Is Anglo American ( LSE:AAL ) a hidden gem 💎 or just another miner struggling with the weight of falling revenues and shaky markets? Let’s break it down with real data and fresh insight! 👇
1/ Revenue collapse? Yep.
FY 2024 revenue plummeted 📉 12.72% from £35.12B to £30.65B.
Net income: Crashed 93.73%, from £4.51B to a measly £283M. 💸
EPS tanked 93.70%, but Q4 production of copper and iron ore beat expectations. 📊
2/ What’s Anglo’s Plan? 🤔
They're reshaping their portfolio with a $4.9B growth strategy.
Restructuring, asset sales, and potential Amplats spinoffs are on the table.
The big question: Can these moves revive profitability? 🔄
3/ Undervalued or just stuck in the mud? 💲
Price today: 2,548.00p
Analyst target: 2,629.29p—modest upside, but deeper models say 32% undervaluation based on recovery potential. 📈
What would you do? Buy the dip, or wait it out? 🤔
4/ How’s it doing vs. competitors? 🏆
Compared to BHP, Rio Tinto, and Glencore:
Anglo shows mixed performance—some production wins, but revenue and earnings are lagging.
Competitors have been quicker to capitalize on demand for metals like iron ore and copper.
5/ The Risk Factor ☠️:
Commodity price swings: When metals drop, so does Anglo. 💣
Operational risks: Labor shortages and regulatory headaches, especially in South Africa 🇿🇦 and Brazil 🇧🇷.
Environmental scrutiny: Mining faces rising costs tied to sustainability 🌱 and compliance.
6/ SWOT Analysis 💡
Strengths:
✅ Diversified portfolio (metals crucial to green tech)
✅ Global reach and strong infrastructure
Weaknesses:
⚠️ Earnings decline, revenue underperformance
⚠️ Vulnerability to commodity volatility
7/ Opportunities vs. Threats:
Opportunities:
🚀 Metals demand will grow with green energy transitions—think electric vehicles and renewables.
🚀 Strategic asset divestitures could unlock value.
Threats:
🌍 Political instability in major regions
🌍 Tightening environmental regulations (higher costs ahead)
8/ Investment Thesis:
Anglo is in a tough spot. Undervalued? Maybe. But recovery depends on commodity prices and restructuring success. 🛠️
If they nail their strategy, there’s upside potential—but risk is high in today’s market. 📉
9/ What’s next? 🔮
Keep an eye on restructuring news—asset sales could shift market sentiment.
Monitor production trends in copper and iron ore.
Look out for green tech demand driving metals growth over the long term. 🌱
10/ What do YOU think?
📈 Bullish: It’s gonna recover.
🔄 Hold: Let’s wait for more signs.
🚫 Bearish: Nope, this one’s toast.

USD/CAD got absolutely 'hammered' on MondayTrump's trade negotiations provided USD/CAD with its most volatile daily range since the height of the Pandemic. Yet the surprise announcement that Trump is pausing Canada's tariffs for 30 days saw prices reverse sharply lower, to close the day with an elongated bearish hammer.
Does that pave the way for an immediate reversal lower? Not necessarily. Using price action and market position, I explain why.
Matt Simpson, Market Analyst at City Index and Forex.com

IBSTOCK PLC Stock Quote | Chart & Forecast SummaryKey Indicators On Trade Set Up In General
1. Push Set Up
2. Range Set up
3. Break & Retest Set Up
Notes On Session
# IBSTOCK PLC Stock Quote
- Double Formation
* 165.00 GBX | Area Of Value | Subdivision 1
* (Reversal Argument)) | Resistance Measurement
- Triple Formation
* 1st Numbered Retracement | Entry Area | Subdivision 2
* 2nd Numbered Retracement | Neutral Feature | Subdivision 3
* Daily Time Frame | Trend Settings Condition
Active Sessions On Relevant Range & Elemented Probabilities;
European Session(Upwards) - US-Session(Downwards) - Asian Session(Ranging)
Conclusion | Trade Plan Execution & Risk Management On Demand;
Overall Consensus | Neutral

Focusrite (TUNE) to rally into mid-2025Beaten down, but fundamentally still a good business and my research is telling me that sales have picked up meaningfully since last earnings. Chart has a nice RSI divergence and daily reversal candle signifying a bottom has just been made on Friday 17th Jan.
Ballsy to pick an exact bottom? Yes... But sometimes a setup comes along that you have high confidence on and this is one of those for me ;)

800% extension for Pharos Energy?** risky, small market cap **
On the above 6 week chart price action has corrected 98% since 2007. A number of reasons now exist for a bullish outlook, they include:
1) Price action and RSI resistance breakouts.
2) Support on past resistance following a 4 year accumulation period.
3) No stock splits since 330.
4) Market resistance sits between 100 and 180.
Is it possible price action falls further? Sure.
Is it probable? No.
Ww
Type: trade
Risk: Seriously small position size
Timeframe for long: This week
Return: 3-7x
Stoploss: N/A


Nano market cap RC365 Holding to explode 10,000% / 100x ???** high risk, tiny market cap **
On the above 4 day chart price action has corrected 99% since mid 2023. A number of reasons now exist for a bullish outlook, they include:
1) Price action and RSI resistance breakouts.
2) Support on past resistance since October last.
3) Strong positive divergence. Multiple oscillators print positive divergence with price action.
4) Should the monthly candle close as is (below), then a rapid move to the 20 Pounds area followed by a move to 126 should be observed.
5) The forecast to 140 is taken from the top and lower wedge touch points.
Is it possible price action falls further? Sure.
Is it probable? No.
Ww
Type: trade
Risk: Seriously small position size
Timeframe for long: This month
Return: 100x
Stoploss: N/A
Monthly chart

Cup and handle pattern on BATSNice looking bullish cup and pattern on this chart of tobacco producer BATS. Could be a long opportunity.
