shot firedBeen waiting a while for this ...moving more cash into this for i believe its accumulation zone....trouble is on the books here so its a small feeler,will add more charts etc.. another day when not so busy

Fresnillo: ReasonableFresnillo is back to being reasonable and – in accordance with our expectations – has moved downwards again. Now, it should keep up this drive to make it below the support at GBP 456.60 and thus into the turquoise zone between GBP 473.60 and GBP 250.00, where it should finish wave (2) in yellow. There is a 35% chance, though, that Fresnillo could escape above the resistance at GBP 997.60, thus triggering further ascent above the next mark at GBP 1379.

Bull trap could be in for LSE.Reference to the previous post linked below.
The last rally took us right up to the area marked "Return to Normal" and then we had a strong rejection of it.
Next we'd be looking for fear (usually followed by fast rally)- and then down she goes.

hargreaves landowns stock, long term down trendLSE:HL.
1d candle chart, 4 year downtrend, short for me, maybe 2026 this thing will turn around,
support and resistance marked, for sensible entry and exits.

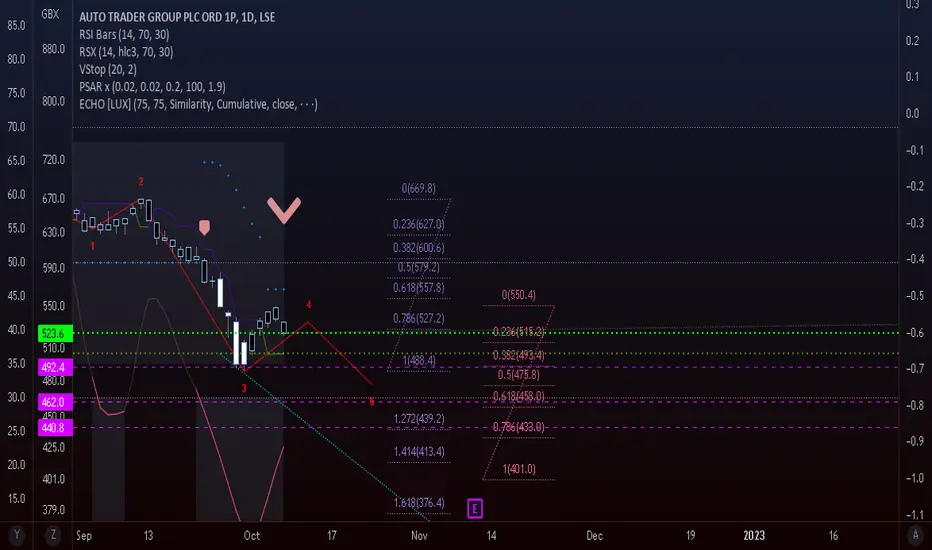
Trade it in, Auto Trader. AUTOAuto Trader is heading for a final leg in a downward impulse. Clear picture on the Elliott, backed up by indicators on the daily. Good luck!
We are not in the business of getting every prediction right, no one ever does and that is not the aim of the game. The Fibonacci targets are highlighted in purple with invalidation in red. Confirmation level, where relevant, is a pink dotted, finite line. Fibonacci goals, it is prudent to suggest, are nothing more than mere fractally evident and therefore statistically likely levels that the market will go to. Having said that, the market will always do what it wants and always has a mind of its own. Therefore, none of this is financial advice, so do your own research and rely only on your own analysis. Trading is a true one man sport. Good luck out there and stay safe.
BP Plc looking good to pump Cup and Handle on BP Plc
Breakout confirmed.
Target £563.00
Also the RSI has broken out of the down momentum and picking up.
Only concern is the left part of the cup is not touching the brim entirely.
Still going long.

BAE Systems long W FormationExcellent trade idea to buy BAE Systems on FTSE 100.
Target 1 £911.00.
RSI broken above resistance
Moving Averages are all positive.
Good to go

$PSNBig UK constructor.. I think the last swing high is in 3 rather than a 5 as labelled but we have 5 waves down from highs in A and trendline a logical place to reshort. You can see it held prior 4 ...unlike a lot of stocks it could not take out pre Covid highs in spite of speculative buying frenzy post Covid

Unilever (ULVR.l) bearish scenario:The technical figure Rising Wedge can be found in the daily chart in the UK company Unilever PLC (ULVR.l). Unilever plc is a British multinational consumer goods company. Unilever products include food, condiments, ice cream, cleaning agents, beauty products, and personal care. Unilever is the largest producer of soap in the world, and its products are available in around 190 countries. The Rising Wedge broke through the support line on 04/10/2022. If the price holds below this level, you can have a possible bearish price movement with a forecast for the next 31 days towards 3 647.00 GBp. Your stop-loss order, according to experts, should be placed at 4 178.00 GBp if you decide to enter this position.
In the first half of 2022, Unilever's growth accelerated again as its robust sales in the U.S., India, and other markets easily offset its lockdown-induced disruptions in China. It also raised its prices to offset the impact of inflation. For the full year, it expects underlying sales to grow by more than 6.5%.
Unilever's underlying earnings per share (EPS) rose 5.5% in 2021, but grew just 1% year-over-year in the first half of 2022 as the inflation and currency headwinds squeezed its margins. It expects its underlying operating margin to decline about 240 basis points to 16% this year.
Risk Disclosure: Trading Foreign Exchange (Forex) and Contracts of Difference (CFD's) carries a high level of risk. By registering and signing up, any client affirms their understanding of their own personal accountability for all transactions performed within their account and recognizes the risks associated with trading on such markets and on such sites. Furthermore, one understands that the company carries zero influence over transactions, markets, and trading signals, therefore, cannot be held liable nor guarantee any profits or losses.


I don't recognise you!I'm lost on tullow. How did it even get the funding it got with current sp of poo?

HEAD - Long term support brokenDowntrend continues and now long term support broken.
Buy back have been helping to slow the fall, however there isn't much left in the pot to continue.
Cost of living crisis will no doubt influence a poor latest quarter as homeowners hold back on purchases.

Synthomer - Mid-term trend supportMid-term trend support
Bullish
1st target = 185-190
Since -in my opinion- global markets are about to begin a long-term bull market again, I expect this share to break the trend resistance and keep rising to new targets.

THG PLC: Reversal and Bullish Island Pattern1) I believe that the bullish wedge pattern (June-August) is still valid with the price target of 88.
2) Island Pattern, which is reversal and bullish.
3) Price to book ratio: 0.32
4) Insiders are buying the stock at these levels.
1st target: 88
2nd target: 104.85 (gap)

THG PLC - Wedge pattern and trend support1) Short trem trend support.
2) I believe that the bullish wedge pattern is still valid and the price target is about 88.

Barclays has no bulls at all. Yet.Barclays - 30d expiry - We look to Buy at 140.42 (stop at 134.98)
Price action continued to range between key support & resistance (140.00 - 175.00) and we expect this to continue.
We are trading at oversold extremes.
Short term momentum is bearish.
Early pessimism is likely to lead to losses although extended attempts lower are expected to fail.
Support is located at 140.00 and should stem dips to this area.
Support could prove difficult to breakdown.
With signals for sentiment at oversold extremes, the dip could not be extended.
Our profit targets will be 154.48 and 159.48
Resistance: 150.00 / 155.00 / 160.00
Support: 144.00 / 140.00 / 135.00
Daily perspective
Disclaimer – Saxo Bank Group. Please be reminded – you alone are responsible for your trading – both gains and losses. There is a very high degree of risk involved in trading. The technical analysis , like any and all indicators, strategies, columns, articles and other features accessible on/though this site (including those from Signal Centre) are for informational purposes only and should not be construed as investment advice by you. Such technical analysis are believed to be obtained from sources believed to be reliable, but not warrant their respective completeness or accuracy, or warrant any results from the use of the information. Your use of the technical analysis , as would also your use of any and all mentioned indicators, strategies, columns, articles and all other features, is entirely at your own risk and it is your sole responsibility to evaluate the accuracy, completeness and usefulness (including suitability) of the information. You should assess the risk of any trade with your financial adviser and make your own independent decision(s) regarding any tradable products which may be the subject matter of the technical analysis or any of the said indicators, strategies, columns, articles and all other features.
Please also be reminded that if despite the above, any of the said technical analysis (or any of the said indicators, strategies, columns, articles and other features accessible on/through this site) is found to be advisory or a recommendation; and not merely informational in nature, the same is in any event provided with the intention of being for general circulation and availability only. As such it is not intended to and does not form part of any offer or recommendation directed at you specifically, or have any regard to the investment objectives, financial situation or needs of yourself or any other specific person. Before committing to a trade or investment therefore, please seek advice from a financial or other professional adviser regarding the suitability of the product for you and (where available) read the relevant product offer/description documents, including the risk disclosures. If you do not wish to seek such financial advice, please still exercise your mind and consider carefully whether the product is suitable for you because you alone remain responsible for your trading – both gains and losses.

Glencore is basically flat in USD this year!Check out the price of Glencore in USD. It's basically flat. How come? Their business is in USD and their business is booming. Trading will keep doing incredibly well, Coal is on fire (check out Whitehaven a pure play in OZ). It trades sub 5x EBITDA, yield close to 5%, and could be debt free in 12 months... No brainer buy in my mind.

HSBA daily bullish hammerHSBA daily bullish hammer beginning B correction or wave 2 downtrend.
Order BUY HSBA LSE Stop 486.30 LMT 486.30 will be automatically canceled at 20221231 18:00:00 EST

Ageas SAAgeas SA is a Belgium-based international insurance company. The Company’s business segments include Belgium, the United Kingdom, Continental Europe, Asia, Reinsurance, and General Account. The stock is listed on the Belgium Stock Exchange. The price chart has formed a 16-month-long descending triangle with the horizontal boundary acting as strong support around the €38.70 level. A daily close below the €38 level will confirm the breakdown from the 16-month-long descending triangle with a possible chart pattern price target around the €29.00 level.


Value buy: swing trade longLSE:VOD has been in a steady decline since 26 July 2022 declining 16.62% from VRVP point of control.
The price is hitting old support, accumulation levels over the past 2 years and is highly reluctant to break through. Also, price at 106.64 has entered Medium volume VRVP Nodes with not much institutional interest to push the price levels into low level nodes. Average closing price is at 123.98, similar to the point of control over the visible range.
As confirmation, the MACD indicator momentum histogram has been slowing and there has been a crossover. All indicating bearish momentum is slowing/stopped at this current price.
This current level seems to be a value purchase. I estimate the fair value is at least 9% higher than current levels: 116.10.

Is this buy signal, or bull trap?Hi, Unilever seems to jump up from the bull flag pattern from 2012. I will still observe as GBP is not stable at this moment while current CEO resigns. Yet, assumed recession considered, dividend history, this is good time to go long? Ichimoku is up. RSI is near overbought. Any opinions?

DELTIC Bearish move incomingBear divergence on high time frames. If it closes monthly candle as Hammer, then i would be selling into any pumps.
Not a good outlook for this market in the UK and Europe atm. Based on the events in Ukraine & Russia (God rest ones soul) could we see this sector spill further now things are ramping up on a much more aggressive note.
My personal Target as shown based on a confluence zone of Support & Fib retracement.
