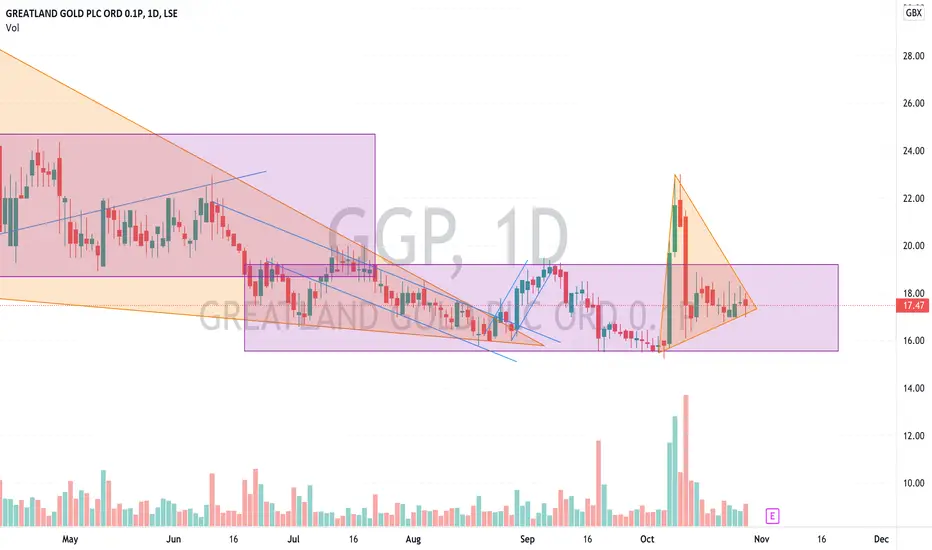
GGP more good results tonightGGP chart looks ready at some point to go
no advice given
sometimes the natural look of the chart gives confidence
NCYT possible reversal pattern . I'm still bullish on this group,
I believe that the price will soon touch the support at 200 and get some high volume in and reverse the pattern getting back at some point to 500 zone.
( feel free to comment , I've just started to analise the graphs, any suggestions or critics are really appreciated )

Guild esports (GILD) LSE. ? reversal pattern As seen in the graphic following the news of the termination of three-year sponsorship deal with a European fintech company on the 22nd Oct the price plummeted down breaking the essential support at 5.00, It started a descending channel down to 3.75.
My Idea is that there could be a possible double bottom with a reversal pattern as indicated by the drawings.
Let me know in the comment what you think .

#POW – Sitting in area of support and valueGreat news this morning – new Australia Copper-Gold opportunity approved by
Licence area covers 2,000km2 – further details will come shortly
www.powermetalresources.com

Mxc Lse falling wedge possible reversal . Mgc Pharmaceuticals listed in Lse is currently having a falling wedge started the 15th of September.
I've identified the yellow area around 2.44-2.56£ as possible entry for a long. Reversal pattern will be confirmed only above 2.96£ and the possible targets are 3.55 and 3.96.
Let me know in the comments what you think . thanks
Not a financial advise .

Argo longBowl chart suggesting 300+ by start of 2022.
This ties in with a lot of crypto charts suggesting crypto will peak around new year
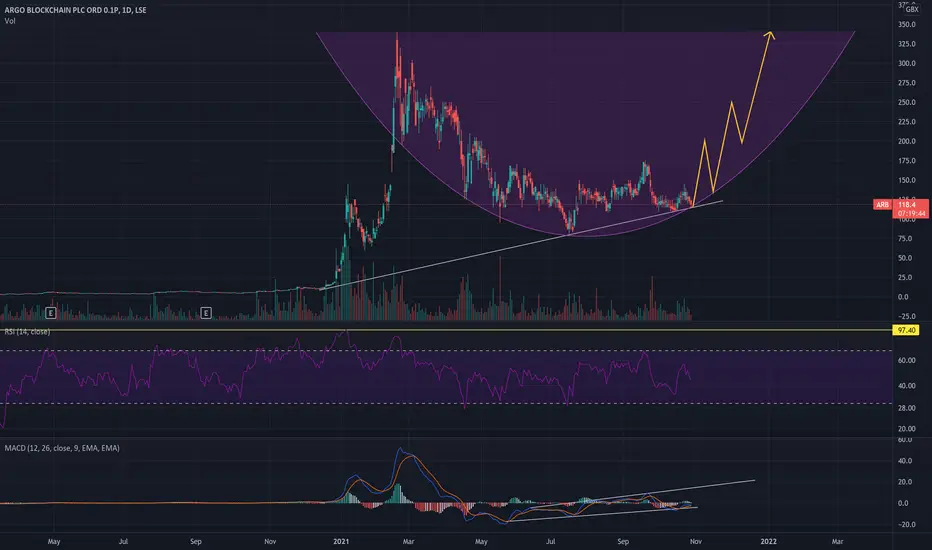
Argo Blockchain $ARBRanging atm.
Long Entry: wait for 1.40 confirmation of support
Target 1: Between 1.90 - 2.00 which is also a Fibonacci relevant level

#FSTA #FULLERS – Sitting in area of significant valueWell run company
Good competitive position
Trading is tough, sentiment is depressed and the shares therefore offer the right balance between protection from falls and potential for gains
Book value is £380m (assets), shares trading at £401m – very modest

Tips of the Year 2022Please find a portfolio of 5 shares that I believe can perform very well. They are stated in no particular order:
1. Hollywood bowl
2. Bushveld minerals
3. Pan African resources
4. Atalaya mining
5. Savannah resources

Tui continued short.Tui failed to continue its head and shoulders pattern due to a surprise share offering! thanks for that tui. this clearly shows they are still struggling which is obvious but this means continued downside for tui is expected especially over the winter. we might get a decent earings out around september next year which will boost share price.
from here now considering the offering allowed shareholders to buy at 182 there will be selling upon issue of these shares lowering share price to bottom support line in my opinion around 180/140. i consider this a buy area and can see the failing wedge pattern play out next year so lower your average down and buy anything under 150 if you get the chance.
i see travelling becoming hot in late 2022 and in 2023 and this will be the beginning of a trend. during this time no doubt the stock market will flop which will allow people to get a good temporary deal on tui and people decide to spend some profits on holidays. the rotation is coming and tui are the leader and basically only major holiday maker left in UK

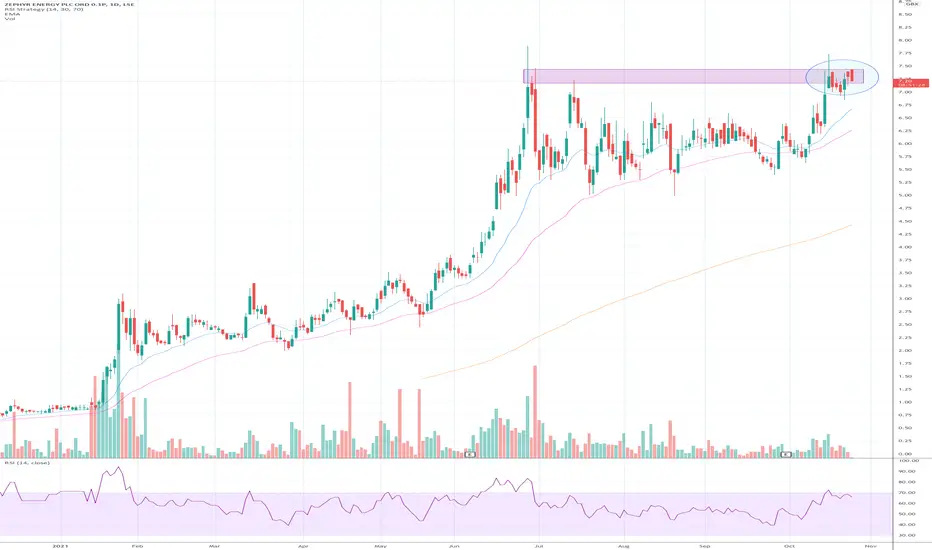
#ZEPHYR #ZPHR – Consolidating nicely in area of resistance#ZEPHYR #ZPHR – Consolidating nicely in area of resistance, ready to break-out
Great news this morning, it has successfully and safely completed via hydraulic stimulation in the Cane Creek reservoir – all in line with completion forecasts. Production testing commencing later today – prelim results expected in a few weeks.
Big end to 2021 coming!

Intermediate Up-trending channel, Short-term pitchfork
Stock is in an intermediate up-trending channel since the June 2021 breakout.
Stock is taking short-term support from the 20ema, but currently under the 9sma
Stock bounced off the daily Ichimoku baseline on 21st October, with a smallish hammer-reversal and signs of a continuation today.
Trade idea calls for an entry at 75p for the retest of the central line of the pitchfork in the low 80's. Stop loss 72p. RRR 2:1

JET2 - BUY. Goldybug set for a short city break with JET2Double top seems to be repeating itself;
Goldybug thinks that there might be an opportunity to make circa 200p per share and so has packed his teeny tiny suitcase for a short city break to visit family, flying JET2 of course.
If you like Goldybug's analysis, reward the little bug with kudos or a thumbs up.
Goodluck all. Confirm any analysis with your own research.

DARKTRACE Technical Levels Long Opportunity Without question DARK is a stock to be following in the world of AI and Cyberattacks
which seem to be all we read about just lately See WEF for enlightenment .
Technically we are sitting in the middle of a ascending channel
which we have been trading inside of since June .
I have drawn some levels using FIB to provide some areas of support and Entry if
any one wishes to start scaling in .
The IPO was 2.50 back in April and since then DARK has already printed 10.00GBP as a ATH
on Sept 24 followed by a 30% retrace and now retesting those previous highs again although
I am expecting the levels I have given to be claimed in the coming months.
Appreciate Likes Follows and constructive feedback .
See below for other Trade Setups

#LEX - #LexingtonGold commences drillingThe exploration drilling campaign at Carolina Belle will include drilling down-dip and along strike from the historic Iola and Uwarra gold mining operations
Starting to move for Q4, sitting in area of strong support and ready to bounce off 200mA

$ANIC: speculating the regulatory approval of cell based seafoodThis week the USDA awarded a $10m grant to TUFTS university to accelerate cell based meat through establishing the National Institute for Cellular Agriculture. My suspicion is that the FDA will allow the commercialization of cell-based seafood on the market at the end of the year.

PHE weekly Looking good on the weekly candlesticks, appears to have hit an inflexion point and now bouncing back up

Unwinding positions in Rio? Short??`As Rio is well below its 200 EMA is this the time to go short?
Trend appears to be over for now and huge volume today

Trading Idea - #ASOSBUY. Take the chance!
ENTRY: 3235 Pence
TARGET: 5782 Pence (+78%)
STOP: 2658 Pence
ASOS PLC is a global fashion retailer. The company sells its goods on ASOS.com. The company's segments include UK, US and EU. ASOS sells approximately 85,000 branded and private label products, which include jewelry and beauty collections, as well as men's and women's fashion, footwear and accessories.
1.) The share price of ASOS is at a decisive support level (2800 to 3000 Pence).
2.) The share price weakness despite the ongoing online boom offers some attractive opportunities for investors.
3.) At online fashion retailer Asos, the conditions are good that sales will ultimately meet market expectations. This is decisive for the further development of the share price.
4.) The current price is far below the average price target of the most influential analysts, even though they have lowered their price targets slightly in recent weeks. This may indicate a potential increase in value.

ASC - ASOS LongsThis will be a long term holding for me.
I have entered my first buy at 2339 small position as I am getting in a little early.
I have a larger buy for 2195 and another at 2135 as price approaches the weekly support area highlighted.
Shares have tumbled 60% from their post pandemic high, and 71% from their ATH.
The company has been rocked by the sudden and unexpected departure of their CEO, rising supply chain cost pressures, and consumers returning products at their pre pandemic levels (during the pandemic the company noted there was a sharp decline in returns which gave a £67m cost saving).
This has resulted in a warning that profits could fall by as much as 40%
It feels like the market has over reacted to the news, especially given that sales rose 22% and the brand continues to be a leading player in the online fashion industry despite an intensely competitive landscape. RSI also is into oversold territory on the weekly. Losing the £67m in cost saving due to lower rate of returns should always have been expected given it was a result of pandemic / lockdowns.
Asos PE is 13.8 VS UK Online Retail average of 24.6
The company is DEBT FREE
Just to repeat the first line, this will be a long term holding for me. It doesn't look as if there is a near term catalyst that will rocket shares up in the coming days - but happy to hold these for a while.

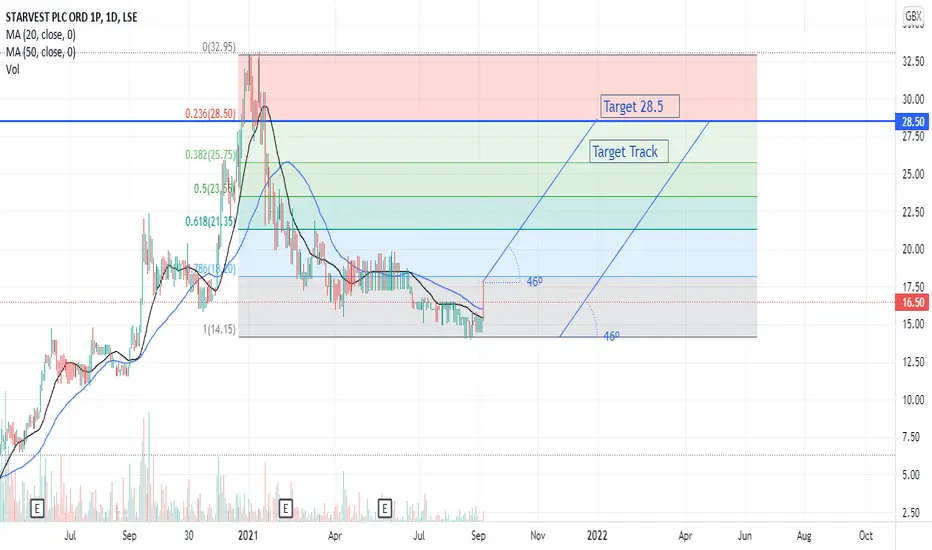
Target 28.5 ( 1 to 5 months )Good Technical and Fundamental, Good stock for long, Target 28.5 Duration 1 to 5 months......
Rio Tinto - 2 counts for this mining giant.Personally, I'm leaning towards the bullish, blue count but I can't ignore the bearish, red count either.
