PHE weekly Looking good on the weekly candlesticks, appears to have hit an inflexion point and now bouncing back up

Unwinding positions in Rio? Short??`As Rio is well below its 200 EMA is this the time to go short?
Trend appears to be over for now and huge volume today

Trading Idea - #ASOSBUY. Take the chance!
ENTRY: 3235 Pence
TARGET: 5782 Pence (+78%)
STOP: 2658 Pence
ASOS PLC is a global fashion retailer. The company sells its goods on ASOS.com. The company's segments include UK, US and EU. ASOS sells approximately 85,000 branded and private label products, which include jewelry and beauty collections, as well as men's and women's fashion, footwear and accessories.
1.) The share price of ASOS is at a decisive support level (2800 to 3000 Pence).
2.) The share price weakness despite the ongoing online boom offers some attractive opportunities for investors.
3.) At online fashion retailer Asos, the conditions are good that sales will ultimately meet market expectations. This is decisive for the further development of the share price.
4.) The current price is far below the average price target of the most influential analysts, even though they have lowered their price targets slightly in recent weeks. This may indicate a potential increase in value.

ASC - ASOS LongsThis will be a long term holding for me.
I have entered my first buy at 2339 small position as I am getting in a little early.
I have a larger buy for 2195 and another at 2135 as price approaches the weekly support area highlighted.
Shares have tumbled 60% from their post pandemic high, and 71% from their ATH.
The company has been rocked by the sudden and unexpected departure of their CEO, rising supply chain cost pressures, and consumers returning products at their pre pandemic levels (during the pandemic the company noted there was a sharp decline in returns which gave a £67m cost saving).
This has resulted in a warning that profits could fall by as much as 40%
It feels like the market has over reacted to the news, especially given that sales rose 22% and the brand continues to be a leading player in the online fashion industry despite an intensely competitive landscape. RSI also is into oversold territory on the weekly. Losing the £67m in cost saving due to lower rate of returns should always have been expected given it was a result of pandemic / lockdowns.
Asos PE is 13.8 VS UK Online Retail average of 24.6
The company is DEBT FREE
Just to repeat the first line, this will be a long term holding for me. It doesn't look as if there is a near term catalyst that will rocket shares up in the coming days - but happy to hold these for a while.

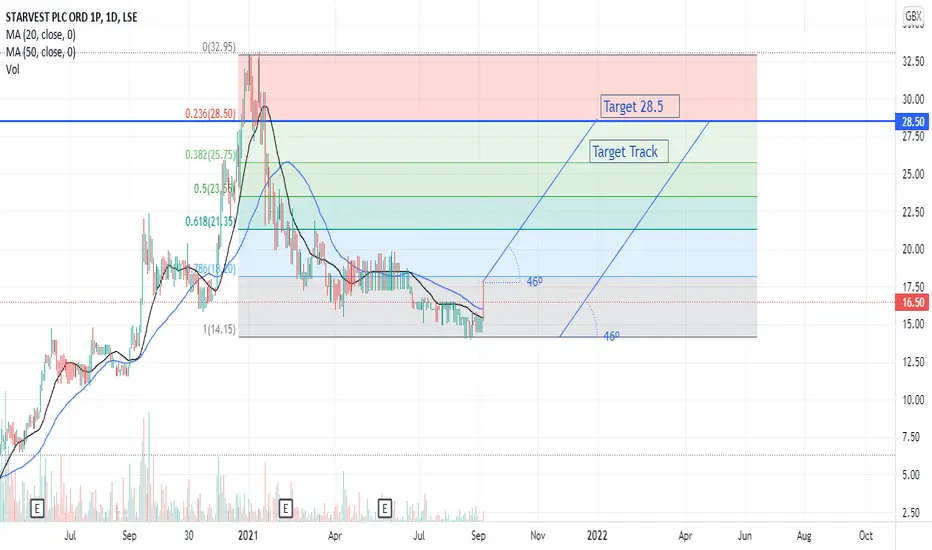
Target 28.5 ( 1 to 5 months )Good Technical and Fundamental, Good stock for long, Target 28.5 Duration 1 to 5 months......
Rio Tinto - 2 counts for this mining giant.Personally, I'm leaning towards the bullish, blue count but I can't ignore the bearish, red count either.

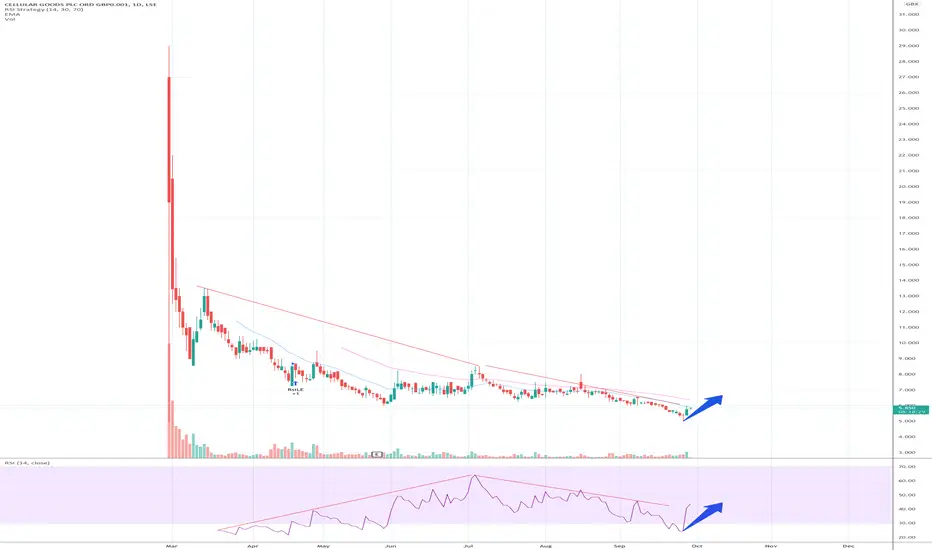
GGP support and resistance at every 0.5p in this rangejust an idea no advice given
lets see whether buyers are dominant in near term

Fill the gapGap down on the daily yet to be filled, strong volume crossover on daily timeframe.
RSI strengthening on 4hour timeframe, stronger than proceeding bounce.
Hammer at the bottom of trend on weekly timeframe, should be a strong signal, possibly shooting past the gap of the course of the new few weeks.


Khan's Live-Charting 08 - $SUSnice upward-channel with clear support - price target chould be around the channel top

#HSBA – Set for huge Q4BIG Dividends
Soaring financial product demand in Asia
P/E 7.9 for 2020, just 5.6 for 2022 = cheap stock
Huge cash flow – profit £5.3bln last q
Should be 460 in next few months
Great play for Q4 as inflation/stagflation takes hold
#inflationstock #stagflationstock

#GWMO – Sitting in level of strong sup ready for bounce in Q4£2.7mln in cash, ready to start next drilling phase as soon as rigs become available post covid… news imminent


AO - Lets "not" go - The bulls do not have it!Future opportunity following a weekly green close when it appears.
Best buy zone is the accumulation zone, 55% back to all time high levels.
This may take several more weeks correct.
RSI & MACD continue a downward trend.
MA's are not yet corrected.
We will be blessed for a Xmas pump if economical and logistical recovery pervails? The confirmation of the RSI, MACD & MAs will confirm AO recovery.
AO warned of lower profits for the year, due to the UK’s current supply chain problems. And that’s all down to a shortage of lorry drivers, after tens of thousands headed back to their home countries after Brexit. AO says it now expects “adjusted EBITDA for the full year to be between £35m and £50m, with profits more heavily weighted than usual towards the second half of the year driven by the peak trading period.
Source: www.fool.co.uk


good risk reward here$ARB is at a very big support area here, I think its safe to say we can see a test of 147 in the near future! i wouldn't set any target much higher than that though, this looks like a slow mover. good luck ! :)


PETROFAC Limited - Bullish divergenceA 92% correction from July 2012 (ouch) creating a considerable oversold condition (as if it was not already obvious) there now exists an ‘incredible buy opportunity’ for those brave enough.
Why Bullish?
1) The bears are exhausted - this is indicated by the ‘capitulation’ volume candles. Remember, ‘Extremes in a market is marked by extremes in volume’.
2) Regular bullish divergence between price action and the oscillators is clearly visible on the above 10-day chart.
3) Volume increase + point (2) = very bullish.
4) The most bullish signal of all appears on the 2-month chart below, a Dragonfly DOJI. Those candles are not to be ignored. The further up the time scale the more powerful the signal. Weekly DOJI’s are great, monthly better. 2-month candles are on another level.
2-month chart

#S32 solved. THre you are. One last ray of bullflag then boom!S32
LONDON version
see the text book rotation of gradients in the bullflag. One left to clear and boom!

Tui BuyTui looks like it could be playing out an inverse head and shoulders pattern ready to regain the 200 SMA and start trading higher again

£AZN 1-day classic patternsQ: What has the highest probability of occurring?
After being one of the strongest performers in 2020 during the initial UK lockdown the stock lost over 30% of its value.
In 2021 it has staged a modest recovery but is still over 15% below its all time high requiring an over 20% rally.
There is well tested support at 8100p and resistance at 8775p.
There is 2 classic patterns 1 that has not validated. 1 that has validated.
The bull flag, with a breakout of 8775p, stop at 8100p, and projected target at 10150p. A risk-to-reward ratio of 2R.
The breakout from the bull flag needs to be confirmed by a close outwith both the flag and resistance. A difficult task therefore requiring more time to confirmation.
The double top, with a breakout of 8100p, and projected target at 7400p. Using a stop half the size of the range creates a 2R opportunity.
The stock also pays a 2.48% dividend semi-annually. Given the length of the setup this trade may run deep into 2022 to allow that dividend to be collected.
Although before that point there will be 2 earnings releases adding volatility to any potential positions held.
The short trade is therefore not of interest here however considering it has validated this may act as a catalyst for the long side. But again it is not yet validated.

After 4 years is Direct Line breaking outSlow progress, but DLG looks to be moving on.
It's been forming a rough inverse head and shoulders for 4 years and is slowly breaking out.

#CBX – Momentum beginning to follow price swingPrice now has bounced off Pre-IPO price and looks set for a run into Q4 as results bring the company into the blue as it received its first shipment of the product CBG in July… still on track for Autumn launch of skincare range