An RSI based on Constance Brown's workCreated for ZmDm, this is a an RSI that plots four zones throughout: the Bear and Bull buy zones, and the Bear and Bull sell zones. Brown suggests the important moves are the ones that happen closer to the midline (in any oscillator), hence the four zones.
You would use this alongside other indicators.

Rolls Royce, Surging. Biggest Mover In Stoxx 600 Today (+12%)Rolls Royce, Now Surging. Biggest Mover In The Stoxx 600 Today (+12%)
The share initially stalled, but has started a big move, on volume. Internally, we discussed this at 111.90 (now +31%). Potential gap close at 182.00
I also published on this platform just over a month ago on 25 August:
For more insights and real-time ideas, get in touch today.

#GWMO – Sitting in level up strong support, ready for Q4 newsAfter discovering gold at shallow depths in multiple holes in its first exploration drilling at the Rock House project in Nevada, US, they are poised to announce the potential and results to the Trafalgar Hill step-out drill programme in Q4

RR. Said it and ill say it again. LONGRolls royce has been a long for a long time. anything under £1 for rolls is a winner simple had a whole 18 months to buy it at this price. is now broken out of the resistance at 135 range with ease. i suspect at this 145 levels as its overbought itll pull back and set new resistance as new support filling the gap so good oppotunity to buy around 135. id then be going long until 170-185 range where id look to sell as it fills the gap. but then buy and hold again. Come on its rolls royce.

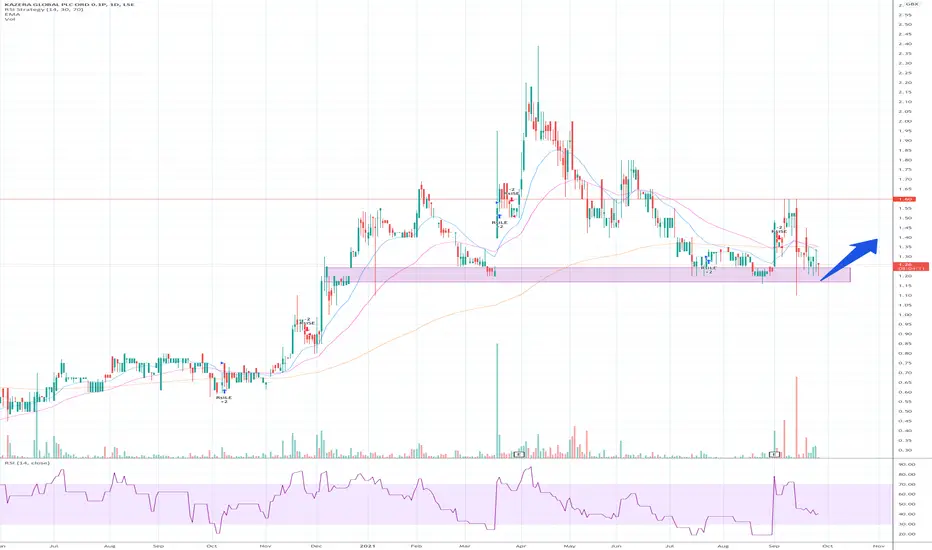
#KZG – reached area of significant value, set for big Q4Joint venture between #MVVIVE and #Kazera is expected to increase six-fold to 35,000 tons of gravel per month.
Profits from the joint venture, which will become operational by 1 October 2021, look for a strong bounce from these levels
RMV - BTFDThis is a slow accumulator for me. Interested < 680 if/when AVD gives positive divergence and a bullish pattern develops.


#znwd – Lithium in huge demand, #Zinnwald set to capitaliseThe Government has pledged massive targets every year to encourage the adoption of EVs. #nissan and German and Italian car manufacturers produces EVs for Europe, highly positive for those mining and resource companies with assets close at hand
Tight stop at £16.94…

#lnd – reached area of significant value, prepare for a bounceQ4 should be strong as results of their BAM golf project are due and balance sheet looks set to go into blue.
Junior Lake portfolio for battery metals look prosperous as well, all coming in Q4

#PAT #PANTHERARESOURCES #PANTHERA – looks set for a big Q4Reaching a significant area of value just as they hit Gold in their new exploration programme at the Labola project.
The results are likely to be incorporated into the maiden resource estimate currently being prepared, results will be announced in Q4.

Dark Trace - Cycle Theory ForecastReally interesting corresponding cycle crossover.
Disclaimer: I am not a financial advisor. This is not advice. This is factual information based on my proprietary models.


HSBC (HSBA)This has to be considered as a trading idea. If Evergrande should fail, HSBC is one of the main holders of the securities, between January and July, HSBC added 40% more in Evergrande bond shares, but total portfolio exposure is down to 1.22%. Are we really sure that there will be no contagion on financial groups?

Big volume on Friday for easyJetFriday's massive volume shows that traders and investors are betting on easyJet to turn it around. One day does not make a reversal although the high volume seems compelling.

NCC set for a rebound?LSE:NCC
Is the sell off here warranted? I am not so sure as there are 2 diverging activities here.
Initially from the 13th of September, the fall was looking justified with increasing volume on any new lower candles.
Yet this last candle has produced one of the highest volume days yet, trading within a smaller range than previously.
So I am now seeing increasing volume, on shorter bodied selling candles, telling me buyers are absorbing all the sell orders the market can throw at it.
Looks like a change in sentiment and this will go on my buy list for Monday.

Will Just Eat break diagonal resistance ?Will Just Eat break diagonal resistance and head for a bottoming pattern and subsequent trend reversal?
Possible completion head after left shoulder and neckline at 81?
Time will tell.

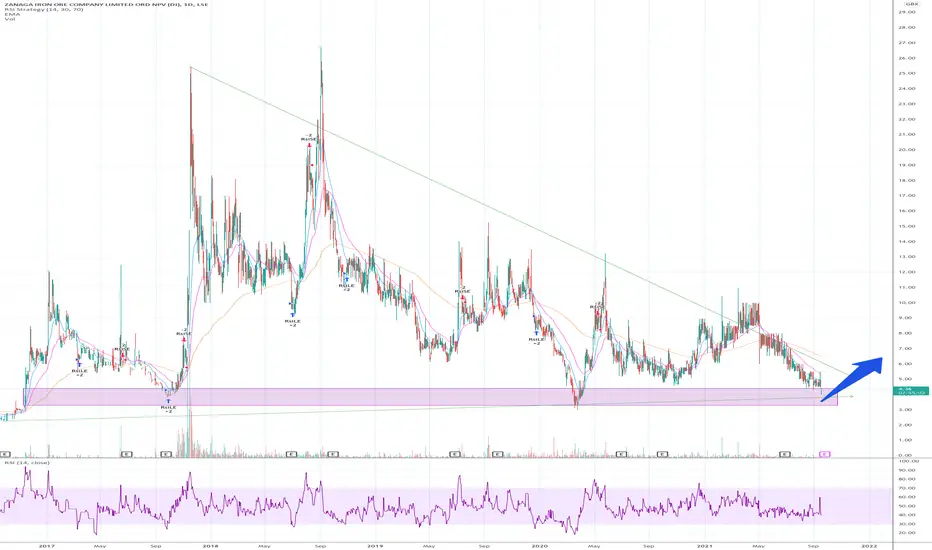
#ZIOC – great opportunity after reaching area of sig value#ZIOC – After the cost of a iron ore breached $100 today, we are looking for opportunities to improve supply of iron ore globally… Zanaga is setup to start capitalising on its 2.1bn ore reserve, with a staged development about to happen that will see 30Mtpa in operation.
Strong buy…
Annual report released. This stock is undervaluedPAF released their annual report today.
Positive
Yearly earnings up 63% , now PER is at about 4. This is incredible !!!
Insiders (CEO and financial executive) bought a lot of shares recently
Dividend will increase 28.5% (vote in November)
Stock buy-back announced (to be precised later)
Awaiting a lot of infrastructure developments and prospection results (incredibly huge gold concentration vein investigated since 1 year)
Strong graphical position, just above unbroken support (only momentarily broken by COVID crash)
Gold leverage
Penny stock that is at the moment not bought by big fish due to small market cap.
Negative
Yields forecast to increase ? But PAF has an incredibly low PER and reduced his debt a lot.
Operates in South Africa (country has inherent risk)
All in sustainable price for gold increased by 9% at $1260/oz
My target is graphical only (so medium term target), the true value of PAF (long term) is above 50 GBX.

Glencore Plc vs Anglo American Plc (London)Late last week on the trading desk, I presented a technical chart highlighted my perspective of the monthly chart for Glencore relative to Anglo American Plc on the London Stock Exchange (LSE), with the comment as follows:
The relative monthly chart for GLEN vs AAL is suggesting the potential for a long-term shift, where GLEN could outperform AAL.
I've overlayed Albermarle (one of the world's biggest lithium producers) and Piedmont Lithium highlighting how the relative ratio chart could 'catch up'.
Glencore's portfolio is well-positioned to benefit from the EV revolution which is in its infancy.
Note the base having developed, with the price now having pushed up to a 17-month high.
In addition, the 14-month RSI is attempting a 6-year downward trend line breakout.
Note: For the sake of clarity, the chart presented here is without Albermarle and Pidemont.
So far we have seen the relative price rebound twice off the 200-day and has advanced by +4% so far this week. Can it continue?
For more insights, perspectives and real-time trade ideas, get in touch today.

TCS Daily TimeframeSNIPER STRATEGY
This magical strategy works like a clock on almost any charts
Although I have to say it can’t predict pullbacks, so I do not suggest this strategy for leverage trading.
It will not give you the whole wave like any other strategy out there but it will give you huge part of the wave.
The best timeframe for this strategy is Daily, Weekly and Monthly however it can work any timeframe above three minutes.
Start believing in this strategy because it will reward believers with huge profit.
There is a lot more about this strategy.
It can predict and also it can give you almost exact buy or sell time on the spot.
I am developing it even more so stay tuned and start to follow me for more signals and forecasts.

Lloyds Bank - bullish one way or the other A couple of counts for this major UK bank. Both bullish although one of them calls for a larger correction first.....

Diageo - decision timeIn my opinion, this stock is at an interesting juncture. Is about to begin a C wave decline to complete a flat correction or was the bottom in March 2020 already the completion of a wave 4? I'm leaning towards a decent correction as it is difficult (for me anyway) to count the upward move from 2020 in 5 waves. As always, time will tell but it might provide a decent opportunity one way or the other.

#UFO - Alien Metals entering significant area of valueQ4 looks set to big for Alien Metals as they should be announcing big news in Q4, notably the commencement of stage 3 drilling programme at Hancock Iron Ore Project...
Stops around 0.45 to 0.55 depending on your open price...
