Alibaba - A remarkable reversal!🛒Alibaba ( NYSE:BABA ) reversed exactly here:
🔎Analysis summary:
Recently Alibaba has perfectly been respecting market structure. With the current bullish break and retest playing out, there is a very high chance that Alibaba will rally at least another +20%. But all of this chart behaviour just looks like we will witness a major bottom formation soon.
📝Levels to watch:
$110, $135
🙏🏻#LONGTERMVISION
Philip - Swing Trader

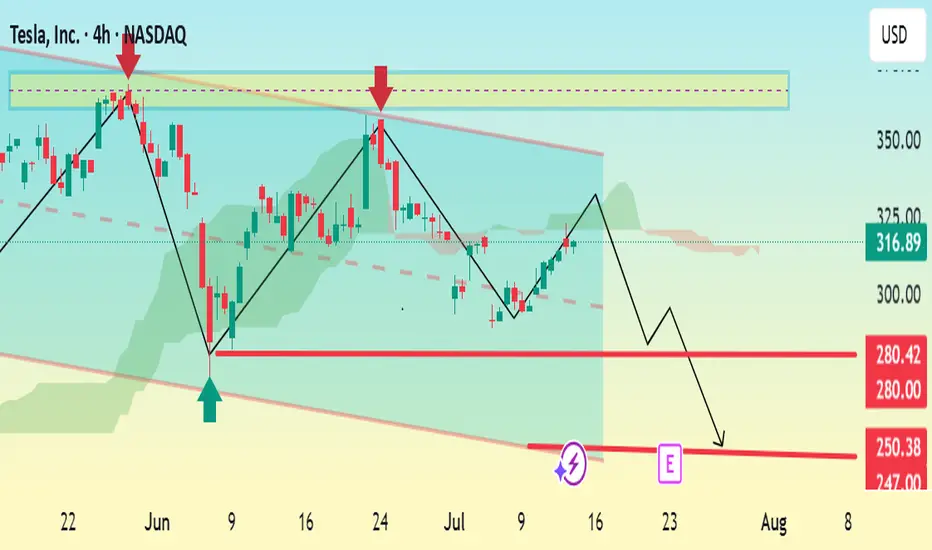
TSLA 4H Analysis – Bearish Reversal Setup📈 Trade Plan Summary
• Entry Range: 316 to 332
• Target 1: 280
• Target 2: 250
• Stop Loss: 370
⸻
📉 Type of Trade:
This appears to be a short (sell) position, since your targets are below the entry point.
⸻
✅ Risk Management Check
Let’s consider your worst-case entry (i.e., highest point in the range: 332) and best-case exit (Target 2 = 250):
• Risk = 370 - 332 = 38 points
• Reward = 332 - 250 = 82 points
📊 Risk:Reward Ratio ≈ 1:2.15 — Good setup!
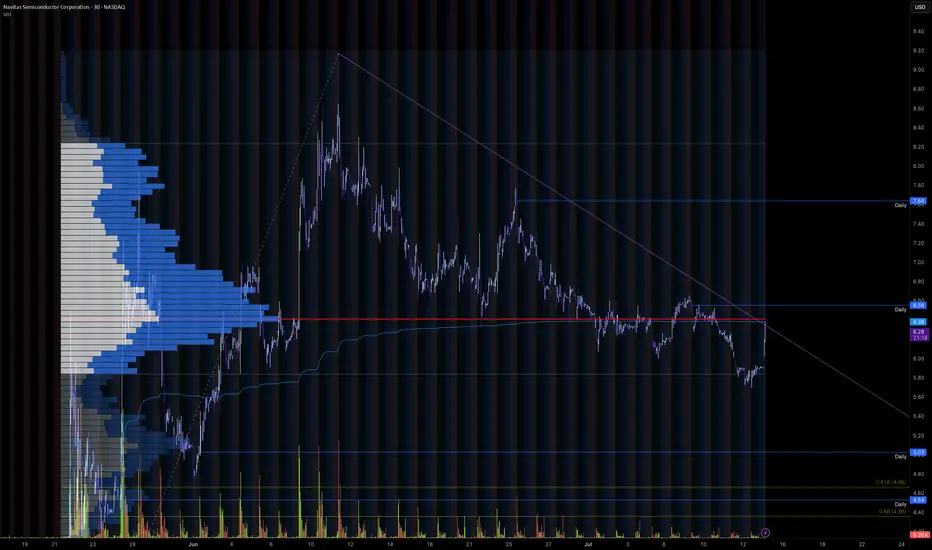
Trendline Breakout for Wave 3Navitas is currently looking at breaking out of its recent downtrend to potentially begin wave 3 of its move up, which, as we all know, is the most impulsive move.
Could be very tasty after a 350% pump already
Need to get above the range POC and breakout of the trend line, would be looking to get in on the retest of the downtrend line.
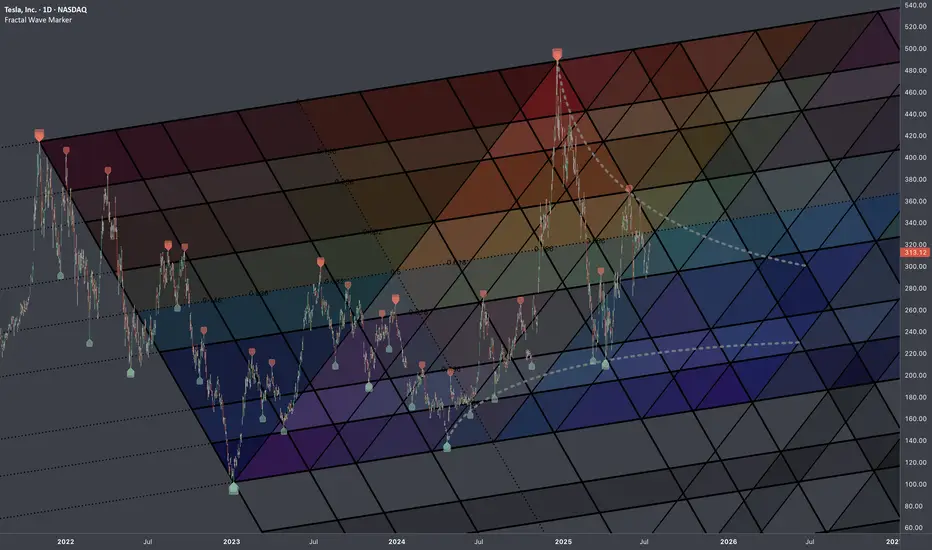
Tesla: Still Pointing LowerTesla shares have recently staged a notable rebound, gaining approximately 10%. However, under our primary scenario, the stock remains in a downward trend within the turquoise wave 5, which is expected to extend further below the support level at $215.01 to complete the magenta wave (3). This move is part of the broader beige wave c. However, if the stock continues to rally in the near term and breaks through resistance at $373.04 and $405.54, we would need to consider that wave alt.(II) in blue has already been completed (probability: 38%).
📈 Over 190 precise analyses, clear entry points, and defined Target Zones - that's what we do (for more: look to the right).

$TSLA: Fib InterconnectionsResearch Notes
Examining interconnection type with regressive angle:
Critical points:
Mapping with 3 fibonacci channels:

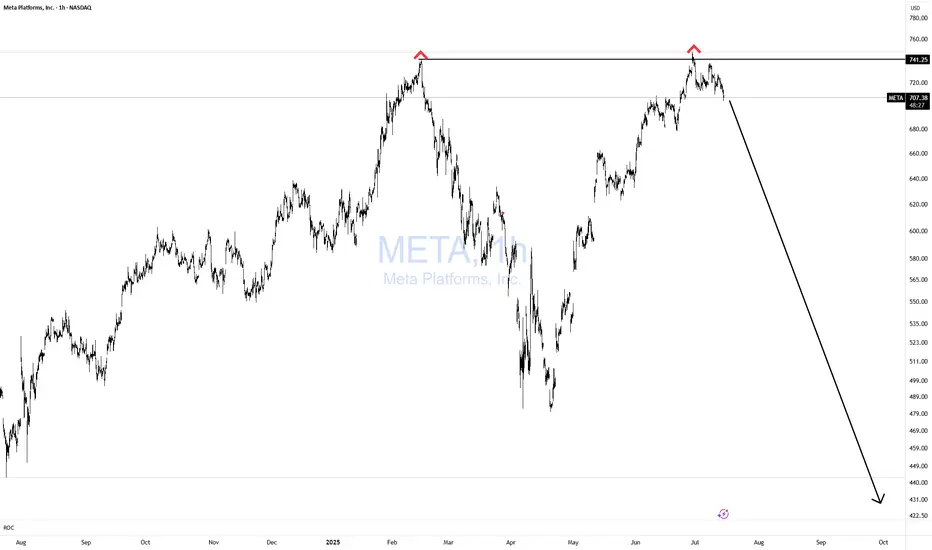
META Double Topping!Does it get any easier than this? NOPE!
If you can't spot this pattern from 1000 miles away, then you need a lot more time in the seat, training yourself in TA.
Simple with great risk reward!
Bulls GTFO!
Wallstreetbets and Markets: Is there a correlation? Preface:
As a self proclaimed “market statistician”, I like to do a lot of random research, sometimes useful, sometimes not so useful.
Here is a post about some “not so useful” research I did. Though not so useful, the results are truly interesting.
The results of this analysis are, in my opinion, pertinent in a post GME and AMC world, where retail have gained huge momentum and presence within the market as a whole and have been able to even tackle hedge funds and win!
Purpose and Aim:
The aim of this was to identify whether Wallstreetbets (heretofore referred to as WSB) data had any meaningful impact on market mechanics, moves, volume etc.
I have been tracking WSB data for some time and have amassed a database of over 300 saved files, consisting of exactly 104 trading days of data.
This is a great amount to actually run analysis on and run some predictive tests!
The main questions I wanted answered are:
a) Does WSB data impacted market moves and Volume? If so,
b) Is WSB reactive to market moves (i.e. the market moves and the ticker trends); or
c) Is WSB proactive in moving the market (i.e. mentions increase and the market move follows).
These questions can be somewhat answered, albeit not flawlessly, using math.
Approach:
To analyze the data, I used:
a) Regression (simple linear);
b) Correlation;
c) Lagged correlation; and
d) Granger Causality
Tickers chosen
I quickly scripted an algorithm to scan through all of the 300+ WSB data and identify the top 10 tickers that were consistently mentioned across all saved data. The data Spans from mid 2024 to current.
The results were as follows, the top 10 tickers which were present in every single saved datafile were:
1 AAPL 104
2 AM 104
3 AMD 104
4 DTE 104
5 GOOG 104
6 MSFT 104
7 NVDA 104
8 PLTR 104
9 QQQ 104
10 SPY 104
Selection for Analysis were:
AAPL, AMD, PLTR and SPY
Raw Results:
NASDAQ:AAPL
NASDAQ:AMD
NASDAQ:PLTR
AMEX:SPY
Oh yeah, let’s see how retail competes with huge indices, this should be really good!
Explanations and Implications
The data presented is all incredibly “mathy”, but let’s break it down to what we can ascertain.
First and foremost, let’s outline the major limitations:
In this analysis, I used large cap stocks and limited to only 4 stocks. The results for these will be greatly different from, say, doing this on small cap or penny stocks (which will be a potential study next!).
As well, we are shy of 1 full year of trading data, which would have more impact on analysis. I do plan to repeat this study with approximately 1 full trading year of WSB data (i.e. 252 days).
So essentially 148 more days and I will have collected 1 full trading year for analysis.
Now that we have that out of the way, let’s discuss what we can say from these results, what we are unsure of and what are the implications for the broader group of traders, MMs and everyone in between.
What we Know
WSB logically has a strong relationship with trade volume. We can see that in most of the analyzed tickers. The correlations tend to be positive and tend to be substantial. More mentions (i.e more hype) leads to greater trade volume, likely as a result of people following the most mentioned or “hot” ideas on WSB.
This is not hard to fathom and its easy to accept as a logical consequence of trending tickers to a large audience of market participants ready to jump at anything.
What we are unsure of
This title is kind of a misnomer. While I phrase it as “what we are unsure of”, the fact remains that we can deduct that there is a significance and a relationship exists; but we can’t be sure as to how deep and profound this relationship extends, owning to the limited amount of data available.
But what we are unsure of is the extent to which WSB is impacting returns and market movement.
In 2 out of 4 tickers, we see that there is a pretty substantial lagged correlation between stock movement/returns and WSB trending status. This implies that WSB may be pushing market movement. However, in both of these cases, the results are short lived. This could be the result of either:
a) The greater market taking over and profit taking on the WSB pump; or
b) The WSBers taking profits themselves after pushing the stock in a direction.
The 2 cases were of AMD and SPY. The results indicated effect of roughly 2 consecutive days before tapering off.
The other 2 tickers, PLTR and AAPL, did not show a very strong relationship or evidence of WSB greatly impacting stock movement, but of WSBers likely “trend following” momentum.
What this means for the broader market?
Its no secret that retail is having a substantial impact on the market and changing the way market dynamics work.
For “experienced” or “senior” traders who have been trading for longer than 4 years, these people would tend to notice that the market dynamics have changed this year and have been changing slowly over the recent years.
One could offer the explanation of changing market sentiment; but perhaps the real explanation is an influx of retail and social media.
If you think about the number of “pump and dump” scams that were successful through the use of social media over the last few years, it’s not hard to believe that the advent of social media and easy access to markets can be a recipe for “disrupting” a routine and destabilizing the market that one once knew.
The NYSE is traded by millions worldwide. Its not just Americans participating, but those globally, leading to participants that surpass even the US population. As we advance in a global information highway that is the internet and social media, its not hard to rally forces to impact change, be it political or financial.
So what does this all mean?
The face of markets is changing and changing fast. No longer are markets strictly influenced by the elite, but by the average Joe who likes to read social media and buy a few options or shares. The implication is essentially the democratization of the market, removed from the grasps of the bourgeoisie and shifted to that of the layman.
Implications for Further Research
This should be repeated on low cap, low float, penny stocks to really analyze the impact of social media on markets and the implications of manipulation and “pump and dump” scams.
Thank you for reading!
This information is for interest sake only and not suggestive of any financial advice of suggestions.
Trade at your own risk and use your own strategies!
Used for this analysis:
R Language
Tradstie API

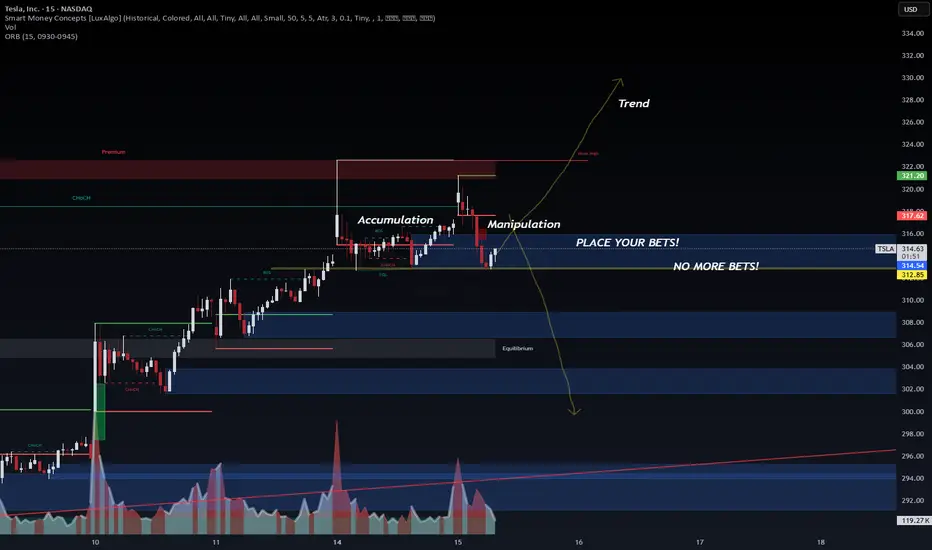
Classic accumulation, manipulation and trend @ TSLA.Looks like someone knows something, or is it just me hallucinating. Can't be both :D
Please see the chart for pattern analysis of what it seems to be a accumulation followed by manipulation, and now the stock is looking for its trend. Whatever happens, I think we are going to see a big move either direction. I am betting on the bullish side with 335 C contracts. Light position, starter.
Front-test, not fin advice.
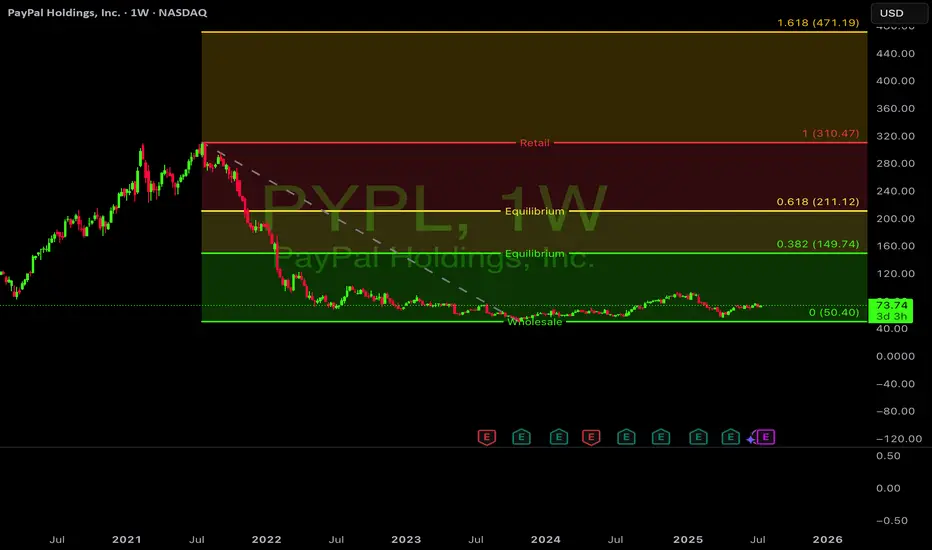
$PYPL should be in your kids kids accountNASDAQ:PYPL breaking out! PayPal forming solid base above $70 after 3-month consolidation. Recent upgrade from Seaport Global signals shifting sentiment. Chart shows golden cross with volume confirmation.
Key resistance at $75 once broken, path to $85+ looks clear.
Long-term target: $141 .
Ultimate goal: reclaim ATH of $275.51! Digital payments growth story intact! #PayPal #Fintech #BullishBreakout
Time to buy? Too much negative press. Buy in Fear- Updated 13/7Apple has faced prolonged downward pressure from bearish investors. Despite its best efforts and some dips, the stock has steadily maintained a baseline price of 200 USD. The flag pattern required some adjustments along its path to break out, primarily due to geopolitical issues and economic variables. Ultimately, Apple broke out to the upside in the week of June 30th, as predicted in my earlier posts. This breakout resulted from end-of-Q2/H1 sell pressure, delivering a 7.56% gain or 15 USD. This is a very bullish sign for Apple, and with the tailwinds forming for September product releases, we can expect further gains as traders return and volume increases.
If Apple follows its historical profit trajectory (see pink line), we could see a new all-time high (ATH) in the region of 270 USD in September. The green resistance and support levels are highlighted, and I may use these to adjust my position, considering whether to short or go long once confirmation is established on the daily timeframe.
Apple has significantly underperformed compared to the other Magnificent 7 stocks, but I don’t believe it’s a company you should bet against in the current climate. With a slow rollout of AI and recent statements from Apple, they may not always be first to market, but they generally execute well. The remarks regarding Sony, Samsung, and Netflix by Apple were very revealing and demonstrate a solid long-term strategy. However, there may be some bumps along the way as they work toward their goals, potentially involving acquisitions.
The fear spread in the media is similar to the FUD (fear, uncertainty, doubt) often associated with Bitcoin, and this is typically a good time to buy. Remember the saying: if retail investors miss the boat, it’s gone, but if institutions miss it, they often bring the boat back.
While this is not financial advice, based on the green weekly candle, it's hard not to pay attention, and Apple may now have a very positive year ahead! Especially with the weakening dollar and reports stating that this will benefit them greatly.
Apple has continued to trend along its predicted trajectory, and with the exception of economic headwinds driving the price down, this trend is expected to continue. Strong support has been observed at 210 USD, with further support at $208.50, providing solid technical support for potential upside while reducing the risk of a downturn below $208. However, a short correction could occur if overall market confidence is shaken due to new policies. Nevertheless, Apple has demonstrated resilience to new tariffs, and its underperformance compared to other tech giants indicates plenty of upside potential. The target price remains set at over $260.
My large long position is still intact, and my target price will depend on how we manage supports and resistances. I am looking to take profits at over 260 USD.


I'm scared of this stock and I'm buyingWall St. has already written the obituary on NASDAQ:SRPT —but that’s exactly why I’m stepping in.
Back in 2020 (link below) I traded a setup from a Spike at 50% Retracement up to its prior ATH near $170, cashed out, dodged the drug-trial IV grenade. I saw 50% of market cap evaporate in a gap. Scared me, made me even more appreciative of risk.
This year alone? Three separate -27% to -50% drawdowns. Yikes is right… and capitulation smells like opportunity.
Risk management: I’m sizing the trade as if it can drop another -50%. If I’m wrong, pain is survivable. If the market over-shot, upside is asymmetric. Whoever’s left is either hedged or numb—perfect soil for a rebound.
Process: 🗑️ Find the trash → Measure the multi-year Volume Profile → Size for worst case → Buy when everyone tells you it's wrong → Hold for return to form

7/15/25 - $myps - Hard not to make this 1%...7/15/25 :: VROCKSTAR :: NASDAQ:MYPS
Hard not to make this 1%...
- i'll probably remind everyone to take it ez on this old man this week, i'm not supposed to be watching mkts, but here i am... at least keeping an eye out on my "price alerts"
- this is an old-friend name i've written about before
- at this price... $50 mm cap, founder-style social casino game transitioning into sweeps... cash generative, huge cash balance... if you're buying some of these yolo r-word names like NASDAQ:PLTR , $sym... i could go on and on... well NGMI
- you gotta think differently when all the apes ooohh ooohh and ahh ahh. you can't outperform by doing what everyone else is doing, unless you accurately use leverage. and if you're just using leverage on names that everyone else owns... well. FAFO. you'll see. take it from a guy who has paid for this tuition a few times.
- well lmk if u guys have an opinion here
- i'll dig in a bit more next week
V

Advanced Micro Devices | AMD | Long at $126.00Advanced Micro Devices NASDAQ:AMD may be the sleeping giant in the semiconductor / AI space. While all eyes on NVidia NASDAQ:NVDA , earnings for NASDAQ:AMD grew by 800% over the past year... and are now forecast to grow 40% per year. Any other company would be soaring right now (like NVidia), but that company is getting all the attention. And, to me, this means opportunity for the future. The cashflow is likely to grow tremendously for
NASDAQ:AMD into 2027 and beyond, which may inevitably reward investors with dividends.
From a technical analysis perspective, NASDAQ:AMD just entered my historical simple moving average zone. This area (currently $108-$126) is where I will be gathering shares. Something tremendous would have to change regarding the fundamentals of this company (like a scandal) for the overall thesis to change. There may be some near-term price pains as NVidia gets all the focus, but to meet demand in the semiconductor and AI space, NASDAQ:AMD is poised to fulfill that roll in the future.
Target #1 = $158.00
Target #2 = $175.00
Target #3 = $188.00
Target #4 = $205.00

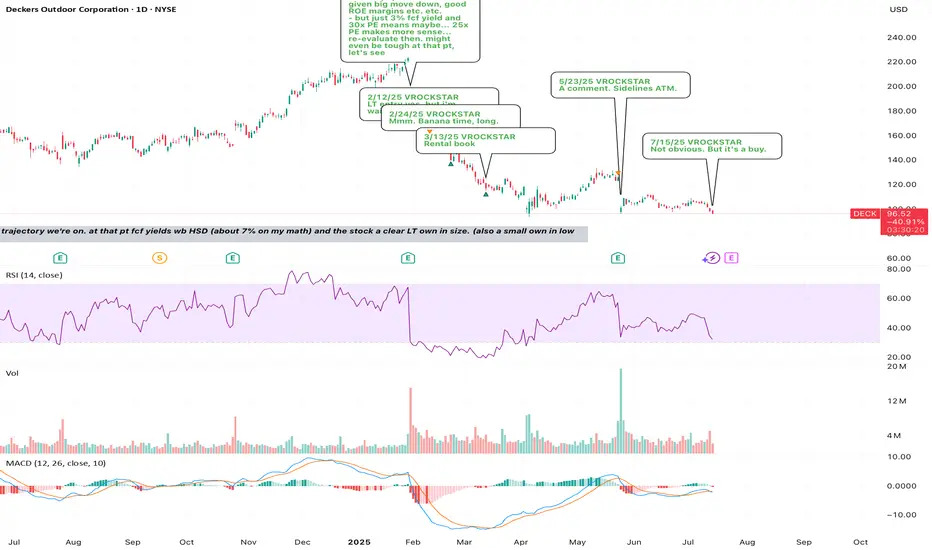
7/15/25 - $deck - Not obvious. But it's a buy.7/15/25 :: VROCKSTAR :: NYSE:DECK
Not obvious. But it's a buy.
- will reiterate that i'm not on tape so closely this week, but will revert w any comment replies by next week; nevertheless i'm checking in here on the tape
- see what T did today on NVDA/ China?
- you think it's easier or harder to resolve some of these discretionary names in the meanwhile vs. nvda H20s to China?
- exactly.
- even NKE put up pretty barfy numbers and the stock was like well... who cares
- i think we're reaching that point with NYSE:DECK here after seeing NYSE:NKE , then reading between the lines on NASDAQ:NVDA ->consumer/discretionary tariffs etc. etc.
- rates will come down, the consumer is tapped out, new fed chair on deck etc. etc.
so the way I'm playing this:
i've bought some ITM calls for aug 15 expiry. why? because it allows me to get proper MSD size (3-4%) but pay only 30-40 bps (10x leverage). the thinking is this... if stock pukes on this result, i'm high conviction that 80% scenario i'd want to load TF up. and if it rips/ or if T has a favorable bowel movement in the meantime... this will rip and off the *extreme* (remember - extreme positioning always gets you the best rewards... but TA doesn't tell you where the bottoms are as much as fundamentals IMVVVHO)... then you get a double whammy and stock is back in the $110s+. so the R/R is v good. but i don't want to get crushed if the stock/ macro work against me and need some wiggle room.
eye'ing LULU too.. but i like valuation and R/R on NYSE:DECK better esp given the NYSE:NKE print and their multiple-brand-multiple-disty strategy vs. say lulu's own-disty strategy.
V
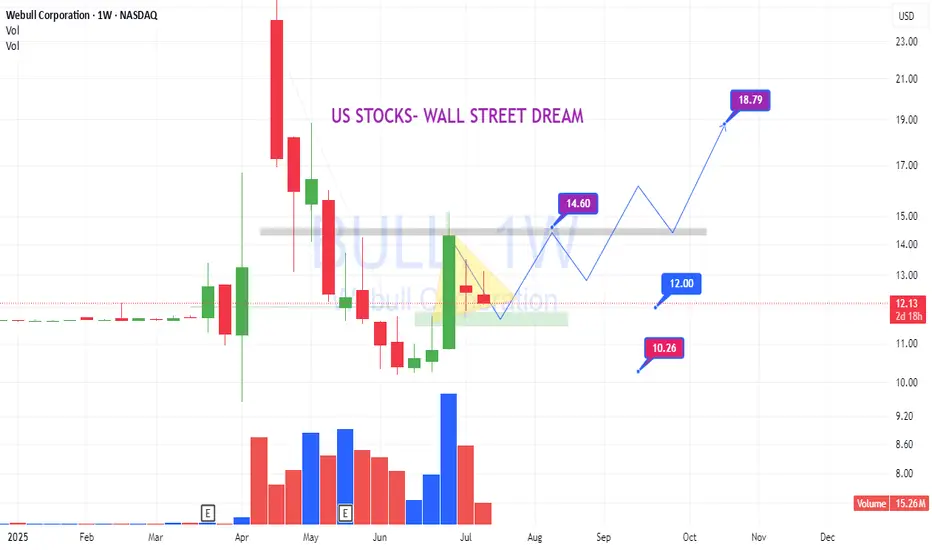
BULL: Inside bar accumulation patternBULL:
Inside bar accumulation pattern.
Less supply volume.
Wait for break and jump!
.
US STOCKS- WALL STREET DREAM- LET'S THE MARKET SPEAK!
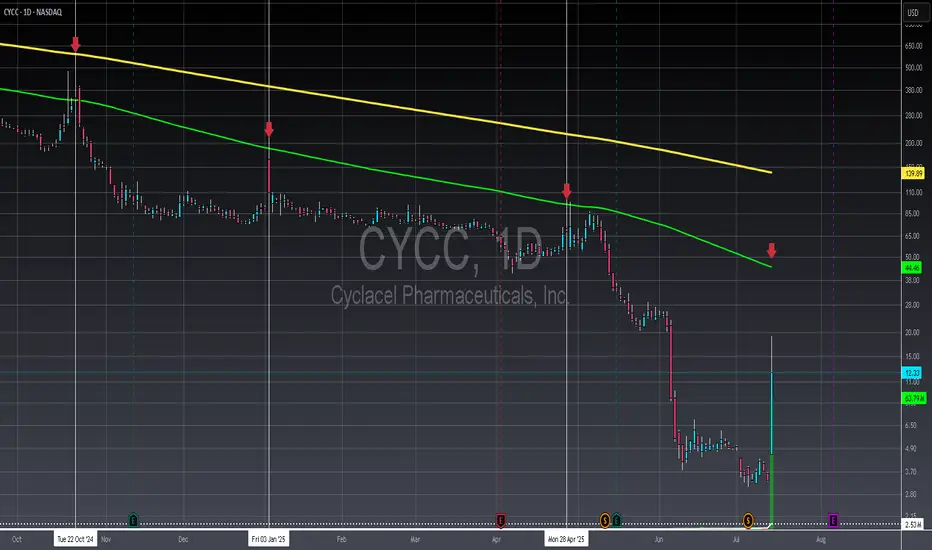
CYCC - Daily - Steer clearIf a company is being forced to split just to stay in line with exchange regulations, that's a huge warning sign right there—it's a clear indication to avoid investing. Secondly, consider this: a company that's been around since 1996 and still can't crack a $50 million market cap? That screams problems with their leadership. Financially, while there was a notable bump in net income between 2023 and 2024, it's not nearly enough to suggest they'll be consistently profitable, especially when you look back at how they were basically hemorrhaging cash from 2020 to 2023. And here's another kicker: despite some improvement in free cash flow since 2022, their cash and equivalents are almost entirely gone. This suggests they might just be shifting expenses around, which is never a good sign. Finally, while it might look like it's targeting the 100 moving average, you've got to ask yourself if you're truly willing to take the hit if it doesn't go your way. If the answer is no, then you're already on your way to being a smarter trader. Move on, there's absolutely nothing special happening here.
Not financial advice, always do your due diligence
Leave a like👍 and/or comment💬.
We appreciate and value everyone's feedback!
- RoninAITrader
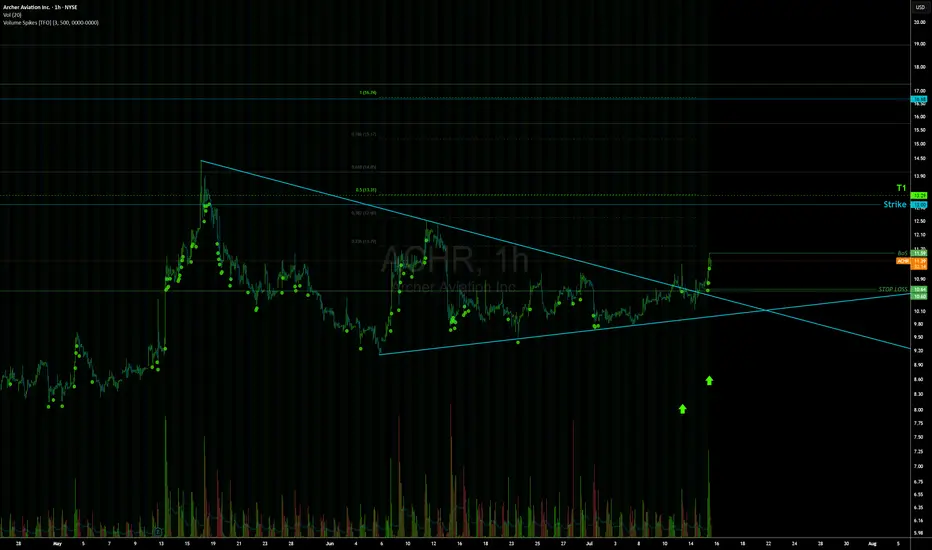
Bullishpossible entry covering the green rectangle.
i see a new high but price do whatever it likes and may fail. so, as usual it's NOT a financial advice.
I share my thoughts, hope to hear from you. Auf Wiedersehen!
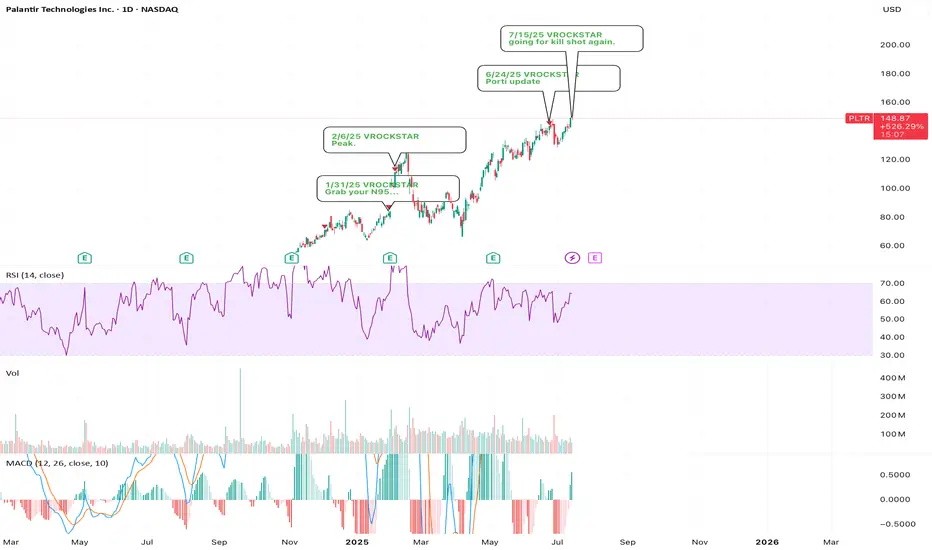
7/15/25 - $pltr - going for kill shot again.7/15/25 :: VROCKSTAR :: NASDAQ:PLTR
going for kill shot again.
- using the 2x levered meme etf PTIR to buy P's
- there are no logical explanations anymore for me to justify valuation "yeah V valuation doesn't matter"... you'll see what i mean, kid
- even 2x'ing FCF over the next 2 yrs and this thing with decelerating growth and the emergence of super intelligence means more competition, more vendors... again "you'll see kid"
- so does this go down tmr idk idc. this is a great hedge on my long book and it's done in a way where i'll roll it, pull it off, whatever.. it's not a core position in any capacity
- but it's already looking weak
- good luck holding this thing up. it wants to reset lower before it can make new highs is my armchair take (and tbh, this is secondary in my process anyway vs. the guys who just draw lines and "trust me bro" energy -- gl w that)
V
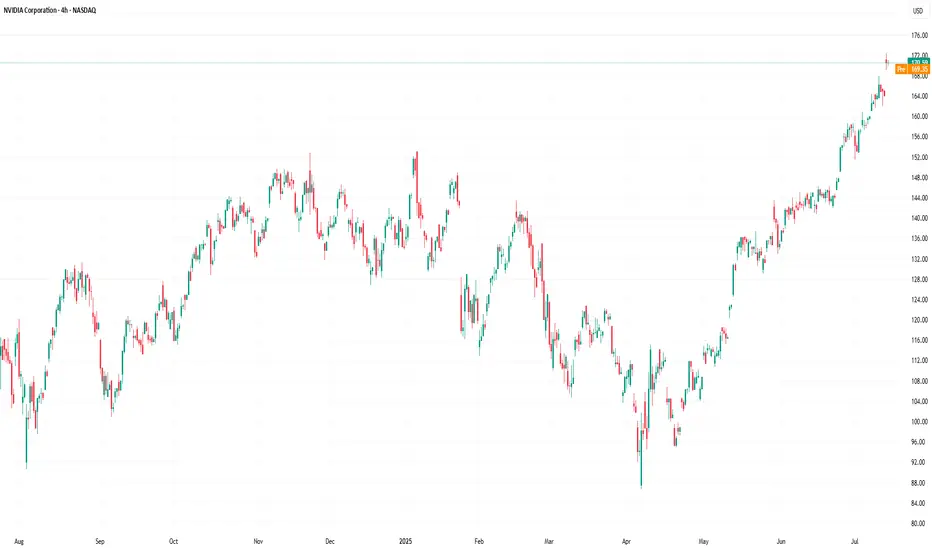
Nvidia (NVDA) Share Price Surges Above $170Nvidia (NVDA) Share Price Surges Above $170
Yesterday, Nvidia’s (NVDA) share price rose by more than 4%, with the following developments:
→ It surpassed the psychological level of $170 per share;
→ Reached another all-time high;
→ Gained more than 9% since the beginning of the month.
The bullish sentiment is driven by Nvidia CEO Jensen Huang’s visit to China shortly after meeting with US President Trump. At the same time:
→ US Secretary of Commerce Howard Lutnick stated that the planned resumption of sales of Nvidia H20 AI chips in China is part of the US negotiations on rare earth metals.
→ The head of Nvidia stated that he was assured licences would be granted very quickly, and that a large number of orders for H20 chip deliveries had already been received from Chinese companies.
Market participants are viewing the situation with strong optimism, and analysts are raising their valuations for NVDA shares:
→ Morningstar analysts raised their fair value estimate for Nvidia shares from $140 to $170.
→ Oppenheimer analysts increased their target price from $170 to $200.
Technical Analysis of the NVDA Chart
The price trajectory of NVDA shares fully reflects the exceptionally strong demand:
→ The price is moving within an ascending channel with a steep growth angle;
→ Since early May, the RSI indicator on the 4-hour chart has not fallen below the 50 level;
→ Yesterday’s trading session opened with a large bullish gap.
The chart also shows the formation of a stable bullish market structure (shown with a purple broken line), expressed through a sequence of higher highs and higher lows.
Given the above, it is difficult to imagine what might cause a sharp shift from positive to negative sentiment. If a correction begins (for example, with a test of the $160 level), traders should watch for signs of its completion — this could present an opportunity to join the emerging rally.
This article represents the opinion of the Companies operating under the FXOpen brand only. It is not to be construed as an offer, solicitation, or recommendation with respect to products and services provided by the Companies operating under the FXOpen brand, nor is it to be considered financial advice.