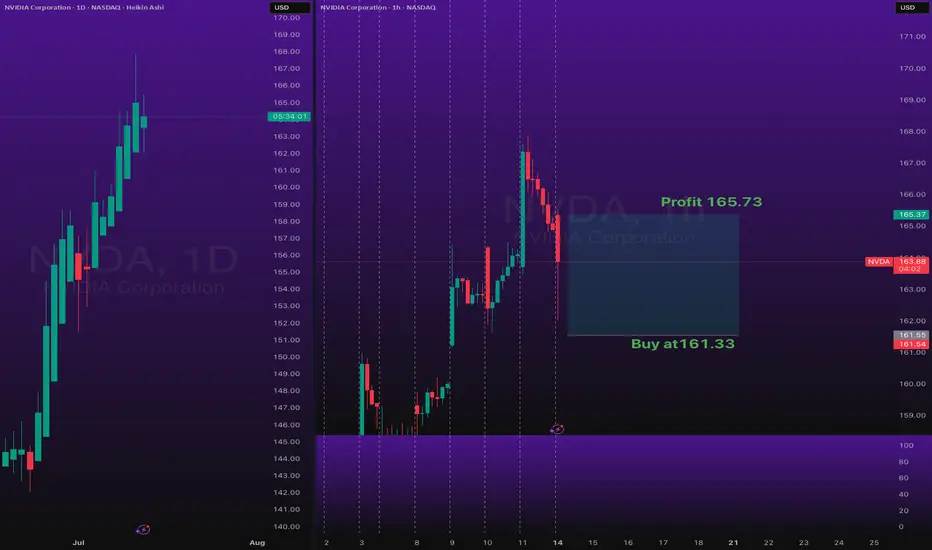
Analyzing and trading stocks using Dr. Elder's Three Screen MethThe first thing I do is analyze the weekly chart. Here I want to see price divergence to the MACD indicator
Next, I go to the daily chart and want to see the divergence between the price and the indicator
I then move to the hourly chart and look for the divergence here.
The price has only risen a couple of points above the previous peak, but that's enough for me. I enter a trade when the bar is broken
NYSE:BK

Micron Technology - Another +50% rally will follow!Micron Technology - NASDAQ:MU - will rally another +50%:
(click chart above to see the in depth analysis👆🏻)
About two months ago Micron Technology perfectly retested a confluence of support. This retest was followed by bullish confirmation, nicely indicating a reversal. So far we saw a rally of +100%, but looking at the channel pattern and previous cycles, another +50% will follow.
Levels to watch: $200
Philip (BasicTrading)
#LONGTERMVISION

Stocks SPOT ACCOUNT: WMT stocks Buy Trade with Take ProfitStocks SPOT ACCOUNT: NYSE:WMT stocks my buy trade with take profit.
This is my SPOT Accounts for Stocks Portfolio.
Trade shows my Buying and Take Profit Level.
Spot account doesn't need SL because its stocks buying account.
Looks good Trade.
Disclaimer: only idea, not advice

Adobe - A gigantic triangle breakout! 🔋Adobe ( NASDAQ:ADBE ) will break the triangle:
🔎Analysis summary:
Yes, for the past five years Adobe has been overall consolidating. But this consolidation was governed by a strong symmetrical triangle pattern. Thus following the underlying uptrend, there is already a higher chance that we will see a bullish breakout, followed by a strong rally.
📝Levels to watch:
$400, $700
🙏🏻#LONGTERMVISION
Philip - Swing Trader

Stocks SPOT ACCOUNT: NVDA stocks Buy Trade with Take ProfitStocks SPOT ACCOUNT: NASDAQ:NVDA stocks my buy trade with take profit.
This is my SPOT Accounts for Stocks Portfolio.
Trade shows my Buying and Take Profit Level.
Spot account doesn't need SL because its stocks buying account.
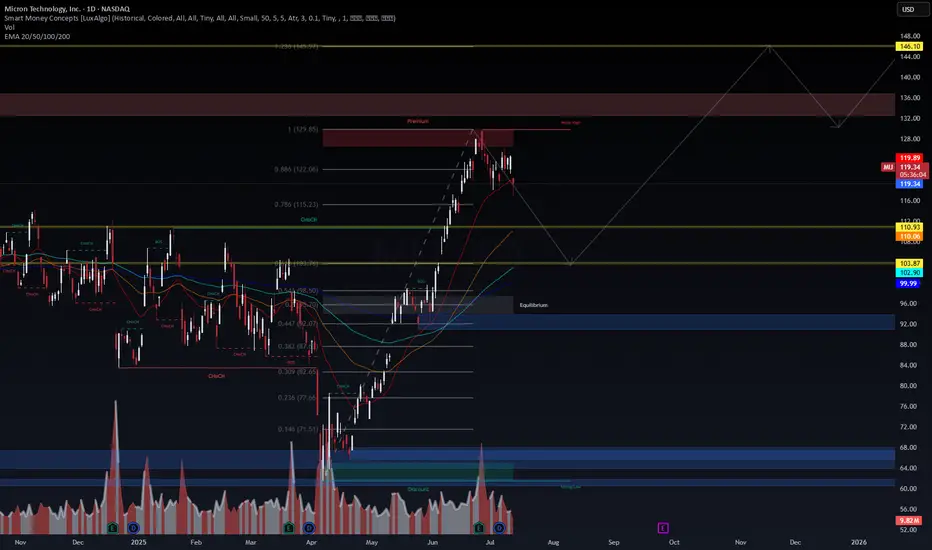
MU - SMC Premium Zone Rejection | Targeting Equilibrium Before E📉 MU - SMC Premium Zone Rejection | Targeting Equilibrium Before Expansion
🔍 WaverVanir DSS Framework | SMC x Fibonacci x Liquidity
We just observed rejection from the Premium zone and 0.886 Fibonacci retracement near $129.85, aligning with prior weak high liquidity. Price has shown signs of distribution, with a likely retracement to the Equilibrium zone ($98–$103) before any bullish continuation.
🧠 Key Observations:
ChoCH confirmed post-run to premium → Expect redistribution
Price rejected 0.886 (122.06) and weak high near 129
Strong EMA confluence forming around 110–103 range
Equilibrium zone and volume spike near $98–$103 offers valid demand
Long-term target remains open toward Fib extension @ $146.10, but only after deeper retrace
📉 Short Bias Until $103–$98 Demand Zone
🔁 Then flip long if bullish confirmation appears
📊 VolanX Market View:
Structure: Breaker → ChoCH → Premium Rejection
Bias: Retracement → Reaccumulation
Tools Used: Smart Money Concepts, Fib, Volume, EMA stack, Liquidity zones
🧠 Built using the WaverVanir DSS, designed to navigate institutional flows and macro-infused setups. We’re tracking this sequence closely across cycles.
📅 Chart Date: July 14, 2025
📍 Asset: NASDAQ:MU (Micron Technology Inc.)
💬 Follow @WaverVanir for macro-aware, alpha-focused setups.
📈 Disclaimer: Not financial advice. Educational content only.
#SMC #OptionsFlow #FibLevels #LiquidityZones #WaverVanir #VolanX #TradingView #MU #Micron #TechStocks #InstitutionalTrading #VolumeProfile #ChoCH #Equilibrium #SmartMoney
Stocks SPOT ACCOUNT: AMD stocks buy trade with take profitStocks SPOT ACCOUNT: NASDAQ:AMD stocks my buy trade with take profit.
This is my SPOT Accounts for Stocks Portfolio.
Trade shows my Buying and Take Profit Level.
Spot account doesn't need SL because its stocks buying account.

Stocks SPOT ACCOUNT: TESLA stocks buy trade with take profitStocks SPOT ACCOUNT: MARKETSCOM:TESLA stocks my buy trade with take profit.
Buy Stocks at 297 and Take Profit at 319.
This is my SPOT Accounts for Stocks Portfolio.
Trade shows my Buying and Take Profit Level.
Spot account doesn't need SL because its stocks buying account.

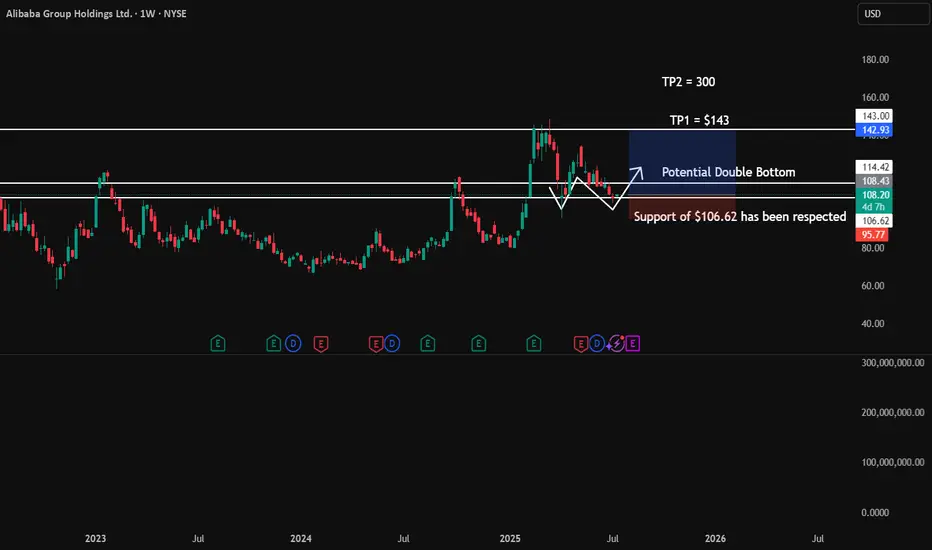
BABA longPotential double bottom to be formed on the Weekly TF.
I think well into Aug and Sept, this will mature.
$143 is a key price value zone.
MRK eyes on $80.36/74: Double Golden zone break to end DownTrendMRK and all pharma has been dropping forever.
Just pierced the Double Golden zone yet again.
Break and Hold of this zone will say "bottom".
.

GRAB : They grab your moneyHello
Fine ?
Me no and yes, or ?
What is Grab ? = Like UBER but in ASIA.
Let's go to ATH, Probably.
Enter when the actual consolidation is destroy by the up in weekly.
Don't be greedy. Stay patient.

DPZ watch $496/497: Double Fib resistance to possible new ATHDPZ has been range bound for a while.
Up against a double fib barrier into earnings.
Look for reject or break of $296.58-497.08

$MSTR: Long term bullish trendNASDAQ:MSTR long term signal triggered...
Up trend in monthly scale until end of 2025.
Heard it here first, lads.
Best of luck!
Cheers,
Ivan Labrie.

MCHP watch $59.xx: Proven Resistance break could POP stronglyMCHP trying to recover along with the Chip sector.
Now testing a well proven resistance $59.10-59.62
Looking for a Break-and-Retest of zone to enter long.

MRVL watch $64.40/43: proven Double Fib holding up the recovery MRVL trying to recover with the chip sector.
Up against a proven Double Fib at $64.40/43.
Look for a Dip-to-Fib or Break-n-Retest entry.

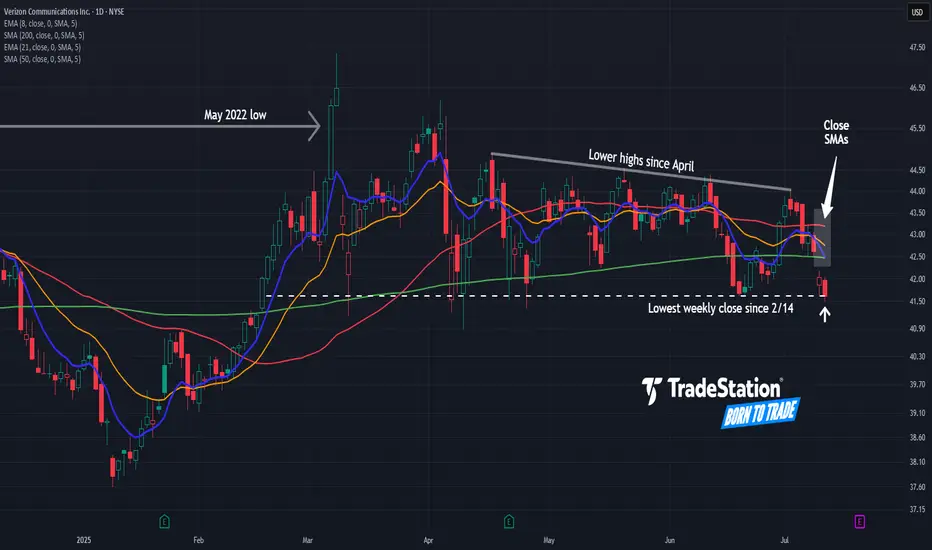
Verizon May Be Rolling OverVerizon Communications has been rangebound for more than a year, and now some traders could think it’s rolling over.
The first pattern on today’s chart is the May 2022 low of $45.55. VZ fell below that level in late 2022 and rebounded to it by mid-2024. The stock has been stuck below the same level since, including a rejection in March. Has old support become new resistance?
Second, prices have slipped below the 50- and 200-day simple moving averages (SMAs). The two SMAs are also close to each other. Those points may reflect weakening longer-term trends.
Third, the telecom stock has made lower highs since April -- even as the broader market broke out to new all-time highs.
Next, VZ just had its lowest weekly close since February. The 8-day exponential moving average (EMA) is also below the 21-day EMA. Those points may suggest that bearishness is taking hold in the short term.
TradeStation has, for decades, advanced the trading industry, providing access to stocks, options and futures. If you're born to trade, we could be for you. See our Overview for more.
Past performance, whether actual or indicated by historical tests of strategies, is no guarantee of future performance or success. There is a possibility that you may sustain a loss equal to or greater than your entire investment regardless of which asset class you trade (equities, options or futures); therefore, you should not invest or risk money that you cannot afford to lose. Online trading is not suitable for all investors. View the document titled Characteristics and Risks of Standardized Options at www.TradeStation.com . Before trading any asset class, customers must read the relevant risk disclosure statements on www.TradeStation.com . System access and trade placement and execution may be delayed or fail due to market volatility and volume, quote delays, system and software errors, Internet traffic, outages and other factors.
Securities and futures trading is offered to self-directed customers by TradeStation Securities, Inc., a broker-dealer registered with the Securities and Exchange Commission and a futures commission merchant licensed with the Commodity Futures Trading Commission). TradeStation Securities is a member of the Financial Industry Regulatory Authority, the National Futures Association, and a number of exchanges.
Options trading is not suitable for all investors. Your TradeStation Securities’ account application to trade options will be considered and approved or disapproved based on all relevant factors, including your trading experience. See www.TradeStation.com . Visit www.TradeStation.com for full details on the costs and fees associated with options.
Margin trading involves risks, and it is important that you fully understand those risks before trading on margin. The Margin Disclosure Statement outlines many of those risks, including that you can lose more funds than you deposit in your margin account; your brokerage firm can force the sale of securities in your account; your brokerage firm can sell your securities without contacting you; and you are not entitled to an extension of time on a margin call. Review the Margin Disclosure Statement at www.TradeStation.com .
TradeStation Securities, Inc. and TradeStation Technologies, Inc. are each wholly owned subsidiaries of TradeStation Group, Inc., both operating, and providing products and services, under the TradeStation brand and trademark. When applying for, or purchasing, accounts, subscriptions, products and services, it is important that you know which company you will be dealing with. Visit www.TradeStation.com for further important information explaining what this means.
MOB eyes on $3.57: Break should POP and run OR Double TopMOB with a nice recovery from much needed retrace.
Once again testing the proven Golden Genesis fib at $3.57
If/when it breaks it should be a quick pop and then some.

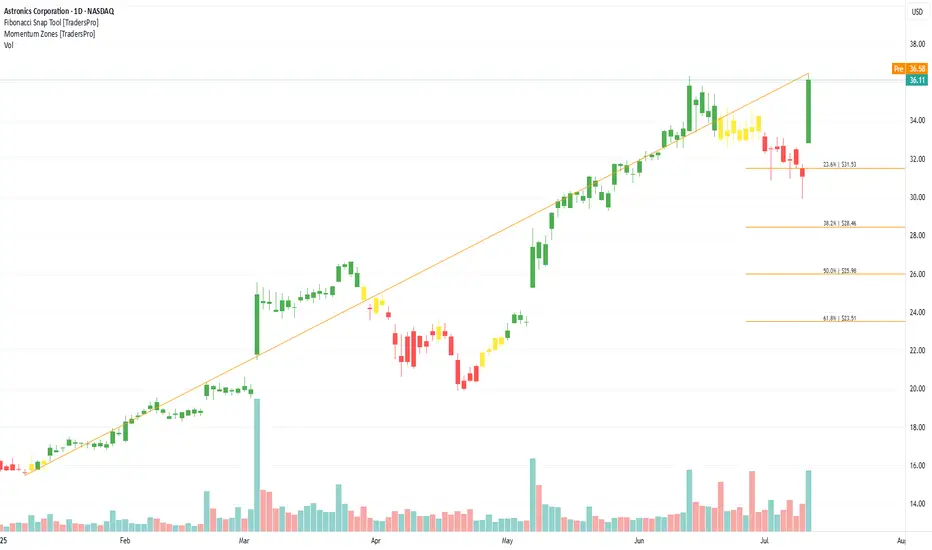
Astronics Corporation (ATRO) Powers Aircraft SystemsAstronics Corporation (ATRO) designs and manufactures advanced technologies for the aerospace, defense, and electronics industries. Its products include in-flight power systems, lighting, connectivity, and testing equipment used in both commercial and military applications. Astronics’ growth is driven by increasing air travel, modernization of aircraft systems, and rising defense spending that supports demand for mission-critical components.
On the chart, a confirmation bar with rising volume highlights strong buying momentum. The price has entered the momentum zone after breaking above the .236 Fibonacci level. A trailing stop can be placed just below that level using the Fibonacci snap tool to lock in gains while allowing for further upside.
Btcm long position Btcm 5day 1week stocks and Rsi in favor
1hr time frame shows a flag and hidden bullish divergence in my humble opinion 🎇

BABA – Dollar Cost Averaging Opportunityhi Traders,
Let's have a look at BABA.
Alibaba (BABA) appears to be approaching the end of its correction phase within a well-defined ascending channel. Based on the current price action and technical setup, we believe now is a good time to begin dollar cost averaging into this stock.
Our identified buy zone lies between $108 and $100, where price intersects the lower trendline support and key EMAs (20/50/100/200). This area offers a strong risk-reward setup for medium- and long-term investors.
The mid-term target for this trade is $160, which aligns with the upper channel resistance and previous price structure. However, from a long-term perspective, we anticipate that BABA will resume its growth trajectory and eventually surpass its previous all-time highs.
Supporting this idea, the RSI is stabilizing in neutral territory, suggesting that momentum is resetting and may shift bullish as price finds support.
Summary:
🔁 Strategy: Dollar cost averaging
🟩 Buy zone: $108 – $100
🎯 Mid-term target: $160
🚀 Long-term view: Return to growth and new ATH
📉 Correction nearing completion; bullish structure remains intact
This setup offers an attractive entry point for patient investors aiming to ride the next major upside cycle in Alibaba.

NIO – Breakout Approaching from Apexhi Traders
How are you today? Do you like NIO stock today?
The price of NIO is currently sitting right at the apex of a narrowing wedge, indicating that a decisive breakout is likely imminent. This technical formation has been building for months, and the price has now tightened into a point where volatility and direction are expected to return soon.
The RSI (Relative Strength Index) is showing bullish signs, with an upsloping structure despite the sideways price action, which suggests growing bullish momentum under the surface. This hidden strength adds confidence to a potential bullish breakout.
We’ve identified two key upside targets for the bulls:
🎯 Target 1: $5.24 — a 45% move from current levels
🎯 Target 2: $7.70 — previous resistance and a major psychological level
However, on the flip side, if the price breaks down from this pattern instead of up, we could see NIO revisit levels as low as $2.20, which would delay the bullish scenario significantly and potentially extend the consolidation phase.
Summary:
🔺 At apex of wedge pattern — breakout expected soon
📈 RSI is bullish and rising, indicating potential strength
🎯 Bullish targets: $5.24 and $7.70
⚠️ Bearish breakdown risk: Downside to $2.20
Traders should watch for a confirmed breakout or breakdown before entering, as momentum can accelerate quickly once direction is established.

Explosive Rebound: Delcath at Critical Support Zone!Delcath Systems (DCTH) has pulled back to a key long-term support trendline after a sharp correction, presenting an exciting opportunity for a powerful rebound. The stock has respected this rising support for over a year, and buyers have historically stepped in at this level.
With the analyst price target set much higher at $24.29, risk/reward here is highly attractive. A confirmed bounce could ignite strong momentum toward previous highs and beyond. I’m watching closely for bullish price action and increased volume to signal entry. Stop placement should be just below the trendline to manage risk.
Not financial advice—always use proper risk management and do your own research!

Oscar will go down to 10$ in next 3-4 months timeRecent Stock Pressure
Weak Q2 guidance from Centene weighed on sentiment, dragging OSCR down ~14%
.
Wells Fargo downgraded it to underweight, citing rising medical costs and pricing pressures in 2025
.
📊 Key Drivers for OSCR
1. 🩺 Healthcare Reform & the ACA / Medicare Advantage
Trump’s tariffs are targeted at pharma, not insurers. But if drug prices rise, costs trickle down to insurers like Oscar.
Conversely, Trump victories are seen as favorable for Medicare Advantage, potentially benefitting OSCR under a pro-Medicare Advantage regime
2. 💡 Growth & Momentum
Oscar recently posted strong Q1 results — 42% revenue growth and 45% share rally
The stock has explored the “meme stock”-like territory with ~52% weekly jump in June
🔍 What Trump Tariffs Mean for OSCR
No direct impact, as tariffs aim at imported drugs, not insurance firms.
Indirectly:
Higher drug costs → could pressure OSCR’s medical loss ratios
Meanwhile, political moves favoring Medicare Advantage and ACA stabilization could help OSCR
🌟 Outlook
Factor Impact on OSCR
⚠️ Downside risks Rising healthcare costs; regulatory uncertainty
✅ Upside catalysts Medicare Advantage tailwinds; continued execution & expansion
📉 Tech-driven momentum AI investments, ICHRA adoption, and growing RS rating (>90)
🔄 Volatility Meme-like spikes add risk—but also opportunity
🧭 Final Take
Trump tariffs on pharma won’t directly hit OSCR, but rising drug costs could hurt insurers if passed along to consumers.
Policy outlook (Medicare Advantage, ACA support) matters—bullish under Trump, bearish under heavier regulation.
OSCR is fundamentally a growth-tech-insurance stock, not a pharma or tariff play.
