Chili's: Still Cheap, Still Ignored, Still A Strong BuyCasual dining has been in limbo post-pandemic—too pricey for impulse meals, not fancy enough to feel special. But Brinker International (EAT), parent of Chili’s and Maggiano’s, is proving there's still a winning formula if you get the execution right.
🛠️ Operational Overhaul at Chili’s
Chili’s has quietly transformed itself. A deep operational review led to smarter kitchen processes and a slimmed-down menu. These changes boosted both food quality and efficiency. By simplifying things like wing sauces and adding real-time kitchen tools, Chili’s improved service speed and cut costs—freeing up staff to focus on core offerings like burgers and margaritas.
As management put it: "Marketing brings guests in, operations bring them back."
📣 Marketing That Works
Chili’s is also nailing the branding. Viral TikToks and a more relaxed, value-focused message have resonated with consumers—both old fans and new. Unlike competitors chasing trends or discounts, Chili’s has leaned into what it does best: an affordable, comfortable dining experience.
The strategy is working. Traffic is up, and customers are coming back—not just for the hype, but for the value.
📊 Financials and Growth Potential
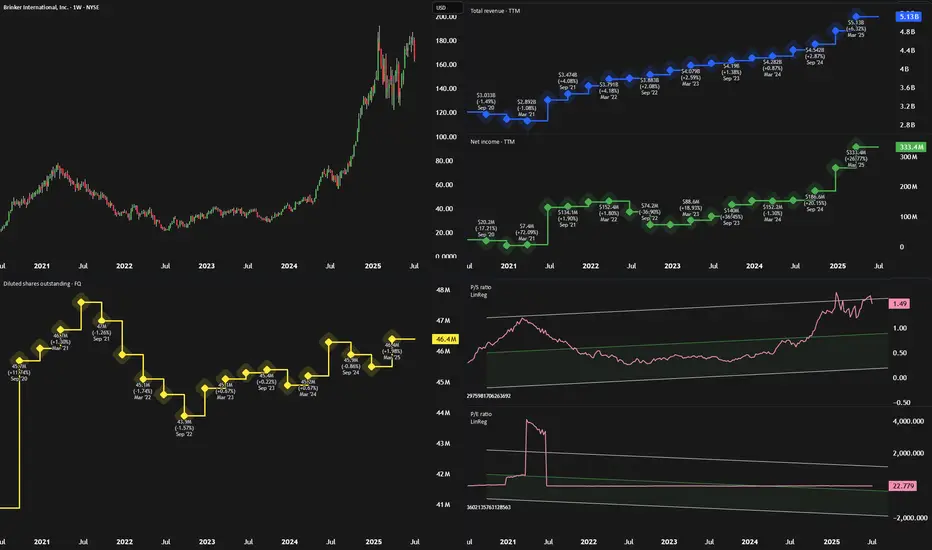
Analysts expect revenue growth of 21%, 5%, and 5.5% over the next three years, with EPS potentially growing more than 11% annually. However, we believe these estimates undervalue Chili’s long-term growth, especially as margins improve and brand momentum continues.
At just 11x cash flow and a PEG ratio of 0.47, EAT is significantly cheaper than peers like Darden (2.1) and Shake Shack (3.8). That discount suggests the market hasn’t fully priced in Brinker’s turnaround.
⚠️ Risks to Watch
Slowing improvements: Much of the "low-hanging fruit" in operations may already be picked, so future gains could taper off.
Debt load: With $430M in long-term debt, a business slowdown could raise financial pressure, despite recent earnings strength.
✅ Bottom Line: Strong Buy
Chili’s turnaround is more than a viral blip—it’s a smart reinvention. Combined with solid execution at Maggiano’s, Brinker International is proving that casual dining can still thrive.
With strong fundamentals, smart leadership, and a discounted valuation, EAT stock looks like a compelling 'Strong Buy' for the next 12 months.
Spotify's Valuation Is Red-Lining (Rating Downgrade)📈 Spotify's Remarkable Comeback
Spotify NYSE:SPOT has transformed itself from a money-losing audio platform into a disciplined, profit-generating tech firm. Through smarter podcast investments, layoffs, and better monetization strategies, the company recently swung from red ink to positive free cash flow and strong earnings — a major shift for long-frustrated shareholders.
This operational turnaround helped fuel a massive rally: Spotify shares have surged nearly 140% since May 2024.
💵 Financials Look Strong... for Now
Revenue jumped from $15 billion to $17.4 billion over the past year — a 16% increase. Spotify also improved gross margins from 25% to 31.6%, while net margins turned positive at 7%. Bottom-line earnings exploded from a $119 million loss to $1.25 billion in profit.
These gains came from several smart moves:
- Reduced payouts to creators (from 75% to 70%)
- AI-generated content, like white noise playlists, cutting royalty costs
- Ad growth in podcasts and better ad tech
- Higher efficiency in infrastructure and operations
Analysts now expect Spotify’s earnings to grow another 74% this year, 45% in 2026, and 30% in 2027.
💰 But Valuation Is Stretched
Despite the impressive financial performance, Spotify's stock appears overheated. It now trades at:
117x trailing earnings
71x forward earnings
37x estimated 2027 earnings
These multiples are far above historical norms — and could spell trouble if growth slows even slightly. The company is running out of levers to improve margins further, and rising operational costs may start to weigh on profits.
Spotify also trades at its highest-ever price-to-sales ratio, indicating elevated investor expectations. If the company underdelivers, the stock could face a significant correction.
⚖️ Our Take: Time to Hold, Not Buy
We still believe in Spotify's long-term story. Its subscription model, improving margins, and global scale offer compelling advantages. But after this big run-up, the stock no longer offers favorable risk-reward.
We’re downgrading from "Strong Buy" to "Hold", suggesting investors with gains may want to trim positions and wait for a more attractive entry point.
📌 Bottom Line: Spotify has executed well — but the stock price now reflects near-perfect performance. A pause, or pullback, wouldn’t surprise us.

Nvidia (NVDA) 2025+ Catalysts & Risks: Analyst Views🚀 Nvidia (NVDA) 2025+ Catalysts & Risks: Analyst Views
🔑 Key Catalysts Driving Nvidia’s Stock Growth (2025+)
1. 🏆 AI Chip Dominance
Nvidia maintains >90% market share in data-center AI chips (Blackwell, Hopper, Rubin). Its CUDA ecosystem and relentless innovation keep it as the “default” supplier for advanced AI, giving NVDA massive pricing power.
2. 🏗️ Surging Data Center Demand
Cloud and enterprise AI spending remains white-hot. Tech giants (Meta, Microsoft, Amazon, Google) are collectively pouring $300B+ into 2025 AI CapEx. Data center revenues are at all-time highs; analysts expect this uptrend to extend through 2026 as “AI infrastructure arms race” persists.
3. 🌐 Mainstream AI Adoption
AI is now integrated in nearly every industry—healthcare, finance, logistics, manufacturing, retail. As companies embed AI at scale, NVDA’s hardware/software sales rise, with “AI everywhere” tailwinds supporting 15–25% annual growth.
4. 🤝 Strategic Partnerships
Big wins: Deals with Snowflake, ServiceNow, and massive sovereign/international AI collaborations (e.g., $B+ Saudi Arabia/“Humain” order for Blackwell superchips; UAE, India, and Southeast Asia ramping up AI infrastructure using Nvidia).
5. 🚗 Automotive/Autonomous Vehicles
NVDA’s automotive AI segment is now its fastest-growing “new” business line, powering next-gen vehicles (Jaguar Land Rover, Mercedes, BYD, NIO, Lucid) and expected to surpass $1B+ annual run rate by late 2025.
6. 🧑💻 Expanding Software Ecosystem
Nvidia’s “full stack” software (CUDA, AI Enterprise, DGX Cloud) is now a sticky, recurring-revenue engine. Over 4M devs are building on Nvidia’s AI SDKs. Enterprise AI subscriptions add high-margin growth on top of hardware.
7. 🌎 Omniverse & Digital Twins
Industrial metaverse and simulation/digital twin momentum is building (major partnerships with Ansys, Siemens, SAP, Schneider Electric). Omniverse becoming the industry standard for 3D AI/simulation, unlocking new GPU/software demand.
8. 🛠️ Relentless Innovation
Blackwell Ultra GPUs debuting in late 2025, “Rubin” architecture in 2026. Fast-paced, aggressive product roadmap sustains Nvidia’s tech lead and triggers constant upgrade cycles for data centers and cloud providers.
9. 📦 Full-Stack Platform Expansion
Grace CPUs, BlueField DPUs, and Spectrum-X networking mean Nvidia is now a “one-stop shop” for AI infrastructure—capturing more value per system and displacing legacy CPU/network vendors.
10. 🌏 Global AI Infrastructure Buildout
Recent US export rule rollbacks are a huge tailwind, opening up new high-volume markets (Middle East, India, LatAm). Nvidia remains the “go-to” AI chip supplier for sovereign and enterprise supercomputers outside the US, supporting continued global growth.
________________________________________
📈 Latest Analyst Recommendations (July 2025)
•Street Consensus: Overwhelmingly bullish—~85% of analysts rate NVDA as “Buy/Overweight” (rest “Hold”), with target prices often in the $140–$165 range (post-split, as applicable).
•Target Price Range: Median 12-month PT: $150–$160 (representing ~20% upside from July 2025 levels).
•Key Bullish Arguments: Unmatched AI chip lead, accelerating enterprise AI adoption, deep software moat, and a robust international/sovereign AI order pipeline.
•Cautious/Bearish Notes: Valuation premium (45–50x P/E), high expectations priced in, geopolitical and supply chain risks.
________________________________________
⚠️ Key Negative Drivers & Risks
1. 🇨🇳 US–China Tech War / Chip Export Restrictions
• US restrictions: While the Biden administration eased some export bans in May 2025 (allowing more AI chip exports to Gulf/Asia partners), China remains subject to severe curbs on advanced NVDA AI chips.
• Workarounds: Nvidia is selling modified “China-compliant” chips (H20, L20, A800/H800), but at lower margins and lower performance.
• Risk: If US tightens controls again (post-election), China sales could fall further. Chinese firms (Huawei, SMIC, Biren) are also racing to build their own AI chips—posing long-term competitive risk.
2. 🏛️ Political/Regulatory Risk
• Election year: A US policy shift (e.g., harder tech stance after Nov 2025 election) could re-restrict exports, limit new markets, or disrupt supply chains (especially TSMC foundry reliance).
3. 🏷️ Valuation Risk
• NVDA trades at a substantial premium to tech/semiconductor peers (45–50x fwd earnings). Any AI “spending pause” or earnings miss could trigger sharp volatility.
4. 🏭 Supply Chain & Capacity Constraints
• As AI chip demand soars, there’s ongoing risk of supply/delivery bottlenecks (memory, HBM, advanced packaging), which could cap near-term revenue upside.
5. 🏁 Competitive Threats
• AMD, Intel, and custom in-house AI chips (by Google, Amazon, Microsoft, Tesla, etc.) are scaling up fast. Loss of a hyperscaler account or a successful open-source software alternative (vs CUDA) could erode Nvidia’s dominance.
6. 💵 Customer Concentration
• A small handful of cloud giants account for >35% of revenue. Delays or pullbacks in their AI spending would materially impact results.
________________________________________
📝 Summary Outlook (July 2025):
Nvidia’s AI chip monopoly, software moat, and global AI arms race create a powerful multi-year growth setup, but the stock’s high valuation and US-China chip tension are real risks. Analyst consensus remains strongly positive, with most seeing more upside as data-center and enterprise AI demand persists—but with increased focus on geopolitical headlines and potential supply chain hiccups.
________________________________________

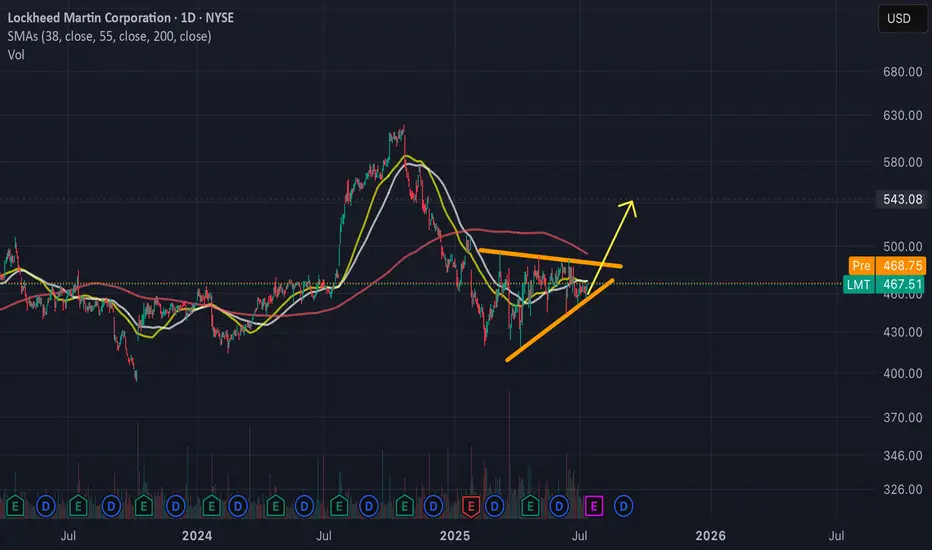
Lockheed 25-07-14 - 467 USD - moving higherLockheed with high demand for following products:
- Himars
- F -35
- rockets for Patriot System
Gap around 540 USD. Moving average preparing for golden cross.
Expect 540 USD within 12 Months.
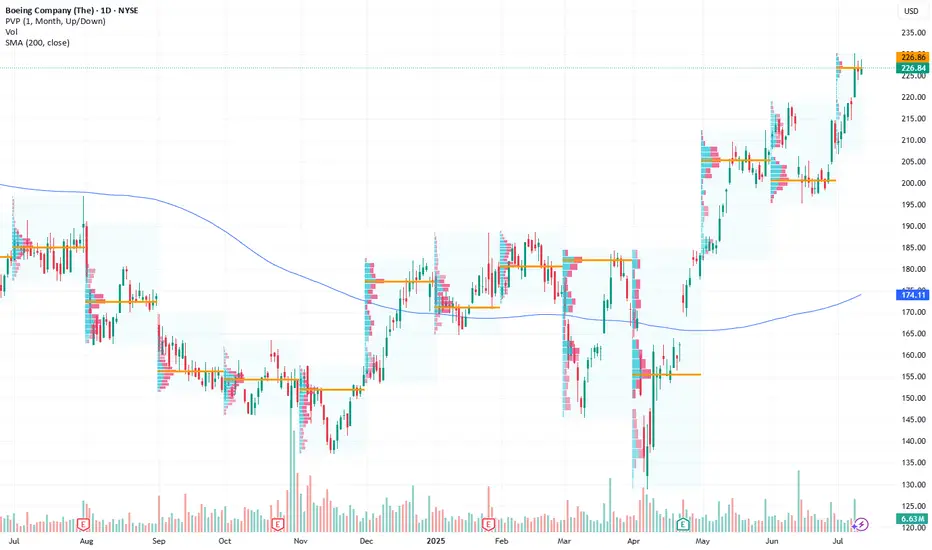
Long Opportunity: Boeing Could Take Flight Next WeekCurrent Price: $226.84
Direction: LONG
Targets:
- T1 = $233.00
- T2 = $238.00
Stop Levels:
- S1 = $223.00
- S2 = $218.00
**Wisdom of Professional Traders:**
This analysis synthesizes insights from thousands of professional traders and market experts, leveraging collective intelligence to identify high-probability trade setups. The wisdom of crowds principle suggests that aggregated market perspectives from experienced professionals often outperform individual forecasts, reducing cognitive biases and highlighting consensus opportunities in Boeing.
**Key Insights:**
Boeing continues to be a key player in the aerospace industry. Strong demand in its commercial airplane segments, coupled with resilient defense contracts, provides the company with stability. The ongoing recovery in airline travel globally adds further momentum to growth, presenting opportunities to capitalize on this positive outlook. Boeing's concerted efforts to address operational inefficiencies and ramp up production capacity also add value, particularly as the company pivots to meet increasing demand in the commercial aviation industry.
The aerospace giant has also benefited from favorable regulatory measures and accelerated demand recovery in Asia and Europe, key regions for international travel plays. Boeing's focus on ramping up production of the 737 MAX series while maintaining strong growth in its aftermarket services positions it for sustained revenue gains.
**Recent Performance:**
Boeing has demonstrated steady upward movement over recent sessions while largely consolidating within a tight technical range. Volumes have remained consistent, signaling sustained investor confidence despite broader market uncertainties. The current price action shows a favorable risk-to-reward setup approaching key resistance levels.
**Expert Analysis:**
Market sentiment remains optimistic due to strong tailwinds in the commercial aviation sector. Analysts point to Boeing's better-than-expected execution on fulfilling delayed orders, particularly for the 737 MAX. Despite concerns over persistent supply chain disruptions, experts note that Boeing's strategic partnerships and operational agility mitigate the long-term risks. Investors are encouraged by the company's forward guidance, although higher material costs remain a watch point for margins.
Technically, Boeing is testing critical resistance at $230. Analysts view a break of this region as a trigger for additional gains, leading to breakout opportunities toward the $240 level.
**News Impact:**
Boeing recently increased its production targets for 2024 and announced strategic moves to expand global service offerings. Positive sentiment surrounding favorable regulatory measures, coupled with improving demand for replacement planes and international travel, has boosted outlooks. Continued commitments from airline giants to upgrade fleets support robust future order flow.
**Trading Recommendation:**
A long position in Boeing at the current price of $226.84 targets a movement to $233.00 (T1) and $238.00 (T2). Stops should be placed at $223.00 (S1) and $218.00 (S2) to limit downside risks. This trade benefits from near-term positive catalysts, including volume consistency, strong market sentiment, and supportive global travel demand recovery.
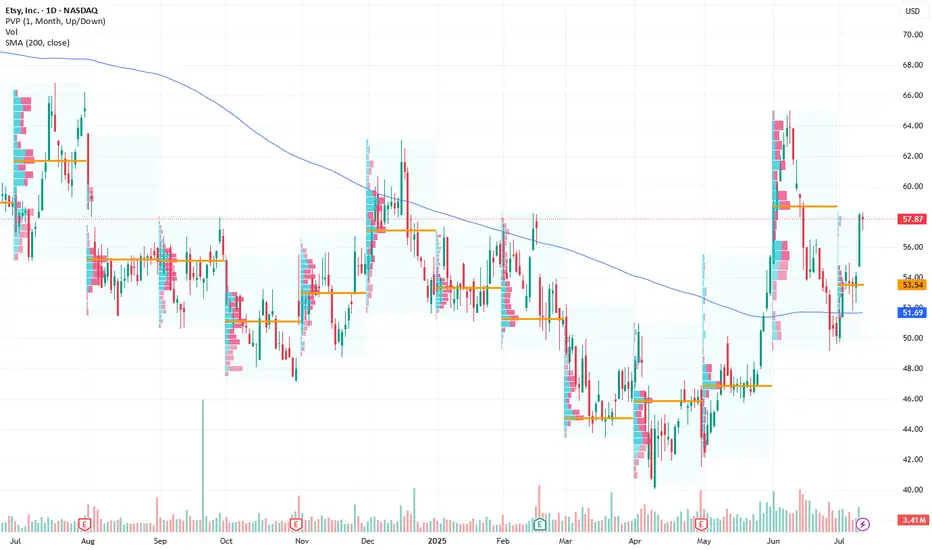
Etsy Positioned for a Strong Bullish Move Next WeekCurrent Price: $57.87
Direction: LONG
Targets:
- T1 = $60.50
- T2 = $64.00
Stop Levels:
- S1 = $56.00
- S2 = $54.50
**Wisdom of Professional Traders:**
This analysis synthesizes insights from thousands of professional traders and market experts, leveraging collective intelligence to identify high-probability trade setups. The wisdom of crowds principle suggests that aggregated market perspectives from experienced professionals often outperform individual forecasts, reducing cognitive biases and highlighting consensus opportunities in Etsy.
**Key Insights:**
Etsy has broken out of a descending wedge pattern, a bullish technical indicator that frequently signifies the end of a downturn and a shift in market sentiment. This breakout is complemented by a “golden cross” formation, where a short-term moving average crosses above its long-term counterpart, often associated with sustained bullish trends. These technical patterns, paired with increasing volume during the breakout, indicate growing investor confidence and the potential for significant upward momentum in the near term.
The company’s niche focus on craft-based e-commerce positions it well amid trends favoring small business support and unique products, adding further long-term growth potential. Recent volume-weighted metrics also show positive divergence, signaling underlying demand even during market-wide hesitations.
**Recent Performance:**
Etsy has recently recovered from a multi-month decline, trading at $57.87 after forming a strong support base around $54. This recovery has been marked by increasingly higher lows and higher highs, confirming the presence of an uptrend. The breakout from its descending wedge pattern was accompanied by above-average trading volume, underscoring market conviction in the move.
**Expert Analysis:**
Analysts are optimistic about the breakout’s implications, citing the combination of technical indicators that suggest Etsy is entering a bullish zone. A short-term target range between $60 and $64 aligns with Fibonacci retracement levels from prior downturns, while a long-term price objective could extend significantly higher if the upward trajectory sustains. The golden cross and robust RSI levels further validate a bullish stance, suggesting that momentum is far from peaking.
**News Impact:**
No major news headlines have directly driven Etsy’s recent movements, but broader macroeconomic factors, such as holiday season spending increases and potential improvements in consumer sentiment, could provide additional tailwinds. Furthermore, Etsy’s unique marketplace offering remains a draw for consumers even amid economic uncertainty, which could shield it from industry-specific headwinds.
**Trading Recommendation:**
With Etsy showing clear signs of bullish momentum and technical breakout patterns, a long position is recommended for traders seeking short- to medium-term gains. The initial target at $60.50 and the secondary target at $64.00 present attractive profit areas, while stop levels at $56.00 and $54.50 provide ample downside protection. This trade setup is supported by the confluence of technical signals, recent performance trends, and the company’s stable market positioning.
Quick View : $ASTSThe daily sees a test of the average EMA21 while the hourly tf already shows up a bullish crossover .
Looking for a new high above that level

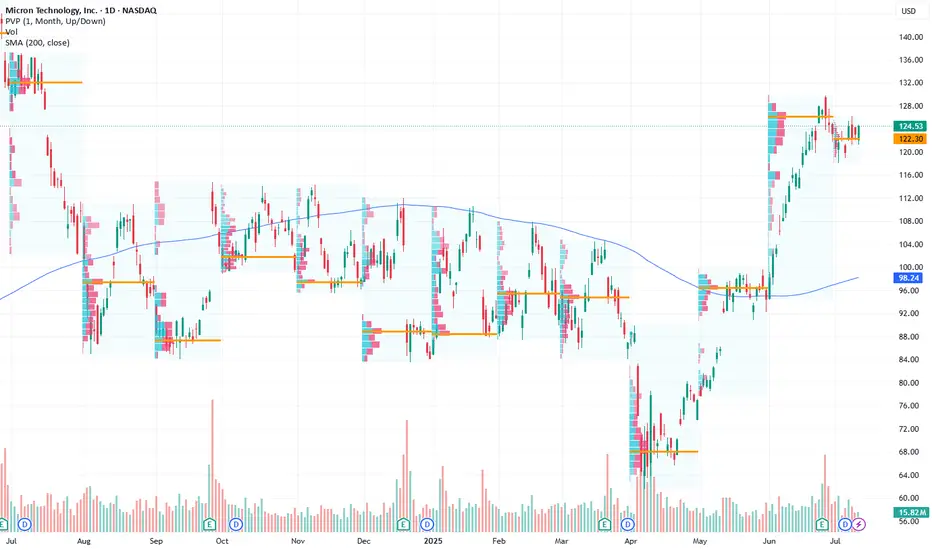
Micron Technology Inc.: Optimistic Long-Term Outlook Driven by ACurrent Price: $124.53
Direction: LONG
Targets:
- T1 = $128.50
- T2 = $130.00
Stop Levels:
- S1 = $123.00
- S2 = $120.00
**Wisdom of Professional Traders:**
This analysis synthesizes insights from thousands of professional traders and market experts, leveraging the collective intelligence to identify high-probability trade setups. The wisdom of crowds principle suggests that aggregated market perspectives from experienced professionals often outperform individual forecasts, reducing cognitive biases and highlighting consensus opportunities in Micron Technology Inc.
**Key Insights:**
Micron Technology Inc. (MU) remains a leading semiconductor company well-positioned to benefit from AI-driven demand for high-bandwidth memory, a key growth catalyst in the sector. Despite broader sector challenges with technical divergences, a break above the $130 resistance level could signal continued bullish momentum, while holding the $120 support level is critical to avoid triggering downside risks. Investors should carefully monitor price movements and geopolitical developments for directional cues.
**Recent Performance:**
Micron has traded within a tight range recently, reflecting a period of consolidation as investors weigh AI growth prospects against broader semiconductor market uncertainties. The stock has demonstrated notable relative strength, supported by positive macroeconomic trends. However, it remains vulnerable to external pressures, such as tariffs and concerns over China's economic stability.
**Expert Analysis:**
Industry experts project strong long-term demand for semiconductors driven by AI applications, with Micron benefiting from its leadership in memory technology. Optimism is underpinned by growing investments in data centers and cloud computing. Nevertheless, analysts urge caution due to potential near-term headwinds stemming from technical signals, geopolitical challenges, and macroeconomic factors such as demand fluctuations.
**News Impact:**
Reports of China's economic slowdown and upcoming policy decisions could significantly influence Micron’s short-term price movements. Additionally, developments related to tariffs and supply chain dynamics remain pivotal for assessing risks. The overarching AI growth story continues to be a key driver of optimism, which bolsters the long-term outlook for Micron’s growth narrative.
**Trading Recommendation:**
In light of Micron’s strong positioning in AI-driven markets, traders may consider a LONG position, with an entry at current levels ($124.53) and initial targets set at $128.50 and $130.00. Stops should be set conservatively at $123.00 and $120.00 to safeguard against downside risks. Carefully track any geopolitical or macroeconomic developments that might affect the broader semiconductor sector.
PayPal: Short Position Recommended as Bearish Divergence SignalsCurrent Price: $71.36
Direction: SHORT
Targets:
- T1 = $69.00
- T2 = $66.50
Stop Levels:
- S1 = $73.00
- S2 = $74.50
**Wisdom of Professional Traders:**
This analysis synthesizes insights from thousands of professional traders and market experts, leveraging collective intelligence to identify high-probability trade setups. The wisdom of crowds principle suggests that aggregated market perspectives from experienced professionals often outperform individual forecasts, reducing cognitive biases and highlighting consensus opportunities in PayPal.
**Key Insights:**
PayPal is currently showing bearish divergence on its technical charts. This pattern signals potential downward pressure in the near term, as momentum indicators weaken in alignment with subdued price action. Increased competition from fintech rivals like Stripe and Shopify, coupled with slowing transaction volume due to macroeconomic headwinds, further exacerbates the bearish outlook. Regulatory scrutiny over Buy Now Pay Later (BNPL) services and cryptocurrency initiatives has also dampened investor sentiment, adding to immediate challenges.
**Recent Performance:**
The stock has consistently underperformed relative to the broader market indices in recent weeks. Recent price movements indicate a lack of momentum, as resistance levels hold firm and sellers dominate. The fintech sector as a whole has struggled to regain investor confidence amid rising interest rates and overall market uncertainty.
**Expert Analysis:**
While PayPal remains a long-term innovator in digital payments with a diverse ecosystem including Venmo and other strategic assets, analysts have shifted focus to short-term concerns. Sizable growth in competition from nimble startups and well-funded businesses is eroding PayPal's market share. Additionally, its earnings growth has plateaued in recent quarters, with slowing active user growth underpinning these challenges. The stock's valuation appears stretched given the competitive pressures and an uncertain macroeconomic backdrop.
**News Impact:**
Recent developments, such as PayPal's exploration into blockchain initiatives and partnerships with global payment platforms, highlight its forward-thinking strategy. However, the immediate market reaction has been muted due to concerns over execution risk and the pace of e-commerce growth normalization post-pandemic. Until breakthrough results emerge from these initiatives, the short-term outlook remains bearish.
**Trading Recommendation:**
Given the bearish divergence and weak price momentum, a short position is recommended for PayPal at the current price of $71.36. A target of $69.00 (T1) and a secondary target of $66.50 (T2) provide lucrative reward potential. For risk management, place stops at $73.00 (S1) and $74.50 (S2). Traders should remain vigilant for any macroeconomic developments or earnings updates that could alter sentiment.

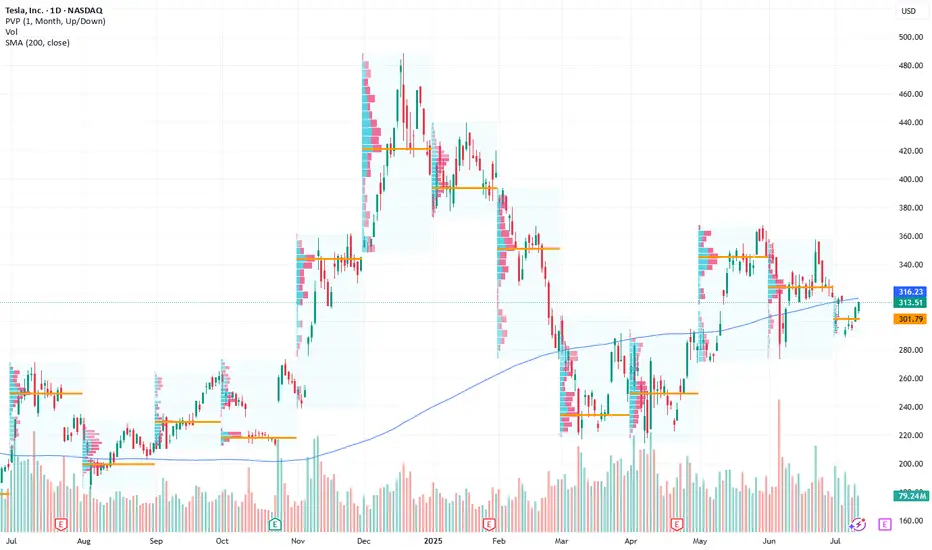
Tesla’s Next Move: Bullish Play Amid AI and Volatility Current Price: $313.51
Direction: LONG
Targets:
- T1 = $319.00
- T2 = $329.15
Stop Levels:
- S1 = $307.75
- S2 = $303.60
**Wisdom of Professional Traders:**
This analysis synthesizes insights from thousands of professional traders and market experts, leveraging collective intelligence to identify high-probability trade setups. The wisdom of crowds principle suggests that aggregated market perspectives from experienced professionals often outperform individual forecasts, reducing cognitive biases and highlighting consensus opportunities in Tesla.
**Key Insights:**
Tesla’s recent AI innovation and its expanding robo-taxi footprint signal long-term growth potential while short-term volatility requires strategic entry points. Market sentiment has significantly improved with positive news about the integration of Gro 4 AI, enhancing Tesla’s autonomous vehicle advancements. Trading at critical levels, Tesla offers a potential buying opportunity near key support zones.
The rallying investor focus on Tesla’s technological edge places it among the leaders in automation-driven growth. Despite macroeconomic pressures, Tesla’s proactive efforts in leveraging cost efficiencies and scaling autonomous solutions are helping to sustain bullish momentum.
**Recent Performance:**
Tesla demonstrated notable resilience during a turbulent earnings season, holding strong amidst mixed market signals. Recent delivery figures reflected a 13% year-over-year decline, which stirred concerns. Yet, the stock was buoyed by positive AI-related news and the market-wide optimism surrounding automation technologies, enabling Tesla to maintain its pivotal price range.
**Expert Analysis:**
Analysts acknowledge Tesla’s robust innovation pipeline centered around driver assistance and robo-taxi functionality powered by the Gro 4 AI platform. Concerns related to Elon Musk’s focus and governance have tempered enthusiasm for some traders, but these have largely been offset by Tesla’s strategic actions to sustain revenue and growth. Tesla’s prominent role in setting the market narrative for autonomous vehicles and broader EV adoption ensures ongoing support from long-term investors.
Tesla’s recent moves are growing investor confidence as it seeks to hedge against broader economic uncertainties and mitigate risks around regulatory changes. Its expansion strategy continues to highlight its leadership within the EV space, while early adopters of its AI-driven solutions may set the pace for sustainable revenue expansion.
**News Impact:**
The integration of Gro 4 AI is expected to significantly enhance Tesla’s robo-taxi and autonomous vehicle functionality, enabling it to capture market share in urban mobility services. Tesla’s announcement of an expanded robo-taxi fleet targeting key metropolitan areas could help offset delivery declines and drive future recurring revenues. While concerns about Elon Musk’s governance persist, ongoing innovation continues to support Tesla’s bullish outlook in global EV markets.
**Trading Recommendation:**
Tesla’s current price action signals an advantageous entry point for a long position, reinforced by recent bullish news and industry-leading innovations. Short-term traders can target $319.00 and $329.15 while maintaining disciplined stop-loss levels at $307.75 and $303.60. With strong support from institutional sentiment and expanding AI applications in its product line, Tesla offers substantial upside for bullish investors.
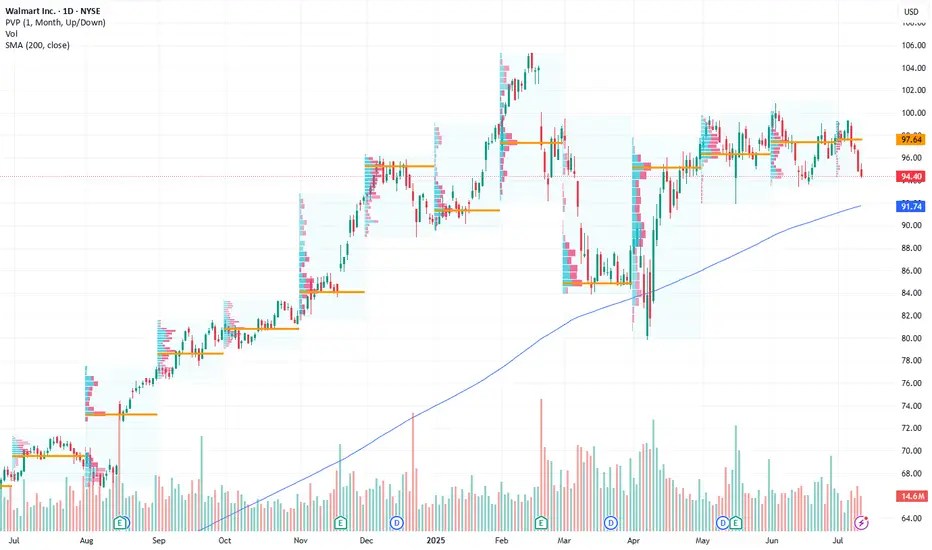
Walmart: Retail Giant Positioned for Growth Amid Bullish MomentuCurrent Price: $94.40
Direction: LONG
Targets:
- T1 = $98.20
- T2 = $101.80
Stop Levels:
- S1 = $92.10
- S2 = $90.40
**Wisdom of Professional Traders:**
This analysis synthesizes insights from thousands of professional traders and market experts, leveraging collective intelligence to identify high-probability trade setups. The wisdom of crowds principle suggests that aggregated market perspectives from experienced professionals often outperform individual forecasts, reducing cognitive biases and highlighting consensus opportunities in Walmart.
**Key Insights:**
Walmart continues to demonstrate resilience within the retail sector, benefiting from strong consumer spending trends. Its position at the 200-day simple moving average (SMA) indicates a key technical support level, providing investors with an attractive entry point for potential upside. As e-commerce gains momentum, Walmart’s operational strengths, bolstered by strategic pricing and logistics, emphasize its long-term growth potential. Consumer discretionary spending remains robust despite inflationary pressures, solidifying Walmart's steady trajectory.
The company's push into hybrid models of shopping, blending in-store and online experiences, has given it a significant edge over competitors. With strong leadership and strategic investments in technology and supply chain efficiencies, Walmart has proactively positioned itself for sustained profitability.
**Recent Performance:**
In recent sessions, Walmart’s price has shown resilience by maintaining stability at the $94 range, aligning closely with its 200-day SMA. Despite broader market volatility, bullish sentiment in the retail sector has supported investor confidence. Comparatively, Walmart has showcased better performance than many of its peers in controlling costs while expanding its digital footprint.
**Expert Analysis:**
Market experts view Walmart as a bellwether of the retail industry. Its ability to balance cost leadership with quality offerings underscores a competitive advantage. This analysis shows optimism for Walmart's e-commerce investments and operational efficiency. Technical indicators such as a narrowing Bollinger band suggest potential volatility expansion, which combined with recent upward price action, hints at possible bullish momentum. Indicators of increasing relative strength support the potential for breakout levels.
**News Impact:**
Retail activity has been positively influenced by consumer interest in savings-focused platforms, with Walmart emerging as a primary destination. Events like Amazon Prime Day indirectly bolster competition, driving visibility toward Walmart's comparable discount strategies. Additionally, Walmart's robust supply chain measures have ensured product availability, catering to high consumer expectations and supporting its market credibility.
**Trading Recommendation:**
With Walmart holding key technical support levels and benefiting from strong consumer trends, a long position appears substantiated. Traders should consider entering near the current price with stops placed below $92 for risk mitigation. Price targets at $98.20 and $101.80 reflect meaningful upside potential spurred by favorable market dynamics and Walmart’s strategic initiatives.
“How Other People’s Fear Becomes Our Profit”From a behavioral and technical standpoint, LEVI presents a textbook short opportunity following its post-earnings overreaction. After a strong earnings beat, the stock surged over 13% intraday, reaching a high of $22.07. However, this rally quickly pushed RSI into overbought territory, triggering natural selling pressure. Much of this sell-off can be attributed to traders who previously bought near the $21–$22 range and are now looking to exit at breakeven—a classic example of loss aversion and anchoring bias. This emotional response often leads to temporary price spikes followed by sharp corrections. We are now observing that exact pattern, with the stock fading to $21.92 in after-hours and closing at $21.95, signaling buyer exhaustion.
Technically, this marks a short-term trend reversal—from bullish earnings momentum to a developing downtrend. The price action shows rejection at key resistance, weakening volume, and emotional exit zones being triggered. Now is a clean, high-probability shorting opportunity, with potential to capture 2–7% downside in the next 1–2 sessions, especially as the broader market reacts to inflated valuations and profit-taking behavior.

$AAPL | Smart Money Concepts Weekly DSS Update Apple ( NASDAQ:AAPL ) is approaching a critical decision zone on the weekly SMC structure, where liquidity, volume, and macro pressure converge.
🔎 Key Observations (WaverVanir DSS):
🔺 Premium Zone (240–260) acting as a weak high with multiple CHoCH & BOS confirmations
🔻 Major equilibrium level at ~$181 aligns with EMA 200 & potential downside sweep
📈 Projected upside target: $301.52, contingent on reclaiming premium zone
📉 Breakdown watch: If $211 fails, next liquidity pockets sit between $181 and $120
⚙️ Volume Profile shows divergence—price rally on declining volume = possible distribution pattern.
🌐 Catalysts to Monitor:
Q3 earnings (E icon on chart)
China iPhone demand
US macro (Fed policy, CPI, yield curve shifts)
🧠 DSS Probability Bias:
Neutral to Slight Bullish (17/25 score)
→ Expect volatility with directional bias forming post-premium test.
📊 Trade Management:
Wait for confirmation above $260 for continuation
Or short-term bearish setups if price stalls below EMA cluster (~$213)
🧠 Posted by WaverVanir DSS | Quant x Macro x Liquidity Driven
#AAPL #SmartMoney #TradingView #MarketStructure #VolumeProfile #LiquidityZones #QuantAnalysis #WaverVanir #AppleStock #MacroTrading #OptionsFlow #TradingSignals #RiskManagement

AMZN Sitting on a Key Launchpad – What’s Next? for July 14🧠 GEX Analysis & Option Strategy:
* Gamma Wall / Resistance: $225
* Next Major Call Walls: $227.5 → $230 → $235
* Call Side Dominance: 13.3% Calls, low IVR at 27.4, IVx avg 38.9
* Put Support: $217.5 / $213.5
* GEX Bias: Mildly bullish bias above $225 — price is floating at Gamma Wall.
🟢 Bullish Option Play:
* Scenario: A breakout above $227.5 could ignite a gamma squeeze to $230–$235.
* Strategy:
* Buy AMZN 230C (7/19 or 7/26 expiry) on breakout above $227.6
* Stop: Break below $224
* Target: $230 → $234
* Lower IV makes calls cheaper; strong momentum + low IV = favorable R/R.
🔴 Bearish Hedge:
* Scenario: Rejection at $227.5 and fall below $224 zone
* Strategy:
* Buy AMZN 220P or 217.5P (7/19 expiry) if price breaks below $224.
* Target: $217 → $213
* Only valid if we break structure below trendline and BOS flips.
📈 1-Hour Chart Technical Outlook (Smart Money Concepts):
* CHoCH → BOS → Retest is confirming bullish structure.
* Price broke out of prior range (purple box around $224–$225).
* Current Setup: Minor pullback to the OB or top of range ($224.5–$225) is underway.
* Structure favors retest long entries unless we break the ascending trendline.
Key Levels:
* Support Zones:
* $224.50 (retest demand/OB)
* $222.26 (ascending trendline + structure confluence)
* Resistance Targets:
* $227.5 → $230 → $232.5 (GEX targets)
📌 Long Setup:
* Entry: $224.6–$225 (on OB retest)
* Stop: $222.25
* Target: $230–$232.5
* Confirmation: Look for bullish candle at the retest zone
⚠️ Bearish Scenario:
* If price fails $224 and breaks structure at $222.25, anticipate reversal into $219.70–$217 zone. Watch price reaction there for potential swing support.
🧭 Thoughts & Summary:
* AMZN has triggered a clean BOS and now consolidates just under a GEX breakout level.
* The next move will likely be decided early in the session — either a strong push through $227.5 → gamma ramp toward $230+, or failure and fade back toward $222–$219.
* Call buyers may find a good breakout play while keeping tight stops under the OB.
Disclaimer: This analysis is for educational purposes only and does not constitute financial advice. Always do your own research and trade responsibly.

GOOGL Eyeing a Gamma Launch Above $182. for July 14🔹 GEX Options Sentiment Analysis
* Gamma Resistance Zone:
The $180 level marks the highest positive Net GEX / Call Wall, making it a magnet and potential resistance for GOOGL.
Above that:
* $182.5 = 2nd Call Wall
* $185 = 3rd Call Wall
* $186.43 is the extreme call zone from GEX
* Put Walls (Support):
* $172.5 = 2nd Put Wall
* $167.5 = HVL
* $165 = 3rd Put Wall
* IVR & Call/Put Sentiment:
* IVR = 38.4 → moderate implied volatility ranking
* IVX avg = 42
* GEX Score = 🟢🟢🟢 (bullish bias)
* CALLs flow = 26.5% net positive
🔸 Implication:
With price above $180 gamma wall and still pushing into $182.5–$185 range, GOOGL is positioned for a potential gamma squeeze, especially if volume supports a move over $182.5.
💡 Options Trade Suggestion Based on GEX
Bullish Scenario:
* 📈 GOOGL 182.5C 07/19 or 07/26
* Entry: On break and hold above $181.50
* Target: $185–$186.5
* Stop: Below $179.50
* Reason: Riding gamma squeeze above the GEX resistance wall with strong call flow and IV breakout potential.
Bearish Rejection Scenario (if false breakout):
* 📉 GOOGL 175P 07/26
* Entry: If price rejects $182.5 and breaks below $179
* Target: $174 → $172.5
* Stop: Above $181.20
📊 1H Chart Analysis (SMC Price Action)
* Market Structure:
* Clean Break of Structure (BOS) confirmed above previous highs.
* Price is currently consolidating inside a bearish OB between $180–$181.40.
* Key Levels:
* Support: $178.8 / $177.6
* Demand Zone: $174.65 → $172.79
* Resistance: $182.5 → $185 zone
* Bias: Bullish (as long as price holds above $177.6)
* Trendline: Still being respected, with CHoCH flip bullish.
📍 Trade Setup Based on 1H Chart
Scalping Intraday Long Setup:
* Long above $181.40 (breakout from OB)
* Target: $182.5 → $185
* Stop: Below $179.80
Intraday Short Setup (if rejected):
* Short below $179
* Target: $177.6 → $174.6
* Stop: Above $181.25
🧠 Final Thoughts
GOOGL looks ripe for continuation as long as price remains above the $180 GEX wall. However, failure to clear $182.5 could invite profit-taking. Watch volume into open and how it behaves near the order block range.
Disclaimer: This analysis is for educational purposes only and not financial advice. Trade your plan, manage your risk, and stay adaptive to market conditions.

MSFT at Gamma Wall Crossroads–Will 506 Break This Time? July 14🧠 GEX and Options Sentiment (TanukiTrade GEX)
* GEX Zone Summary:
* 📈 Call Wall 1 (503.5–506.7) → major Gamma Resistance.
* 🧱 Gamma Wall (506.77) = Highest positive NETGEX — key sell zone for market makers.
* 🟢 GEX Flow: Moderate call dominance (1.95%) — not yet extreme bullish.
* 🟣 IVR 22.8 (low), IVX avg 25.2 – implied vol remains subdued.
* Options Suggestion:
* ⚠️ A move above 506.8 could trigger dealer hedging and gamma squeeze.
* Trade Idea (Bullish):
* Buy 510C or 515C (Jul 19/Jul 26 expiry) on breakout above 507 with volume.
* Stop: <503. Target: 512/516.
* 🚨 If rejection at Gamma Wall (506.8), fade the move:
* Trade Idea (Bearish):
* Buy 500P or 495P on rejection or candle close below 503.
* Target: 497.8 / 494. Stop: 506.5.
📉 1H Technical Trading Plan (Smart Money Concepts)
* Structure:
* Price made CHoCH → BOS toward 506 zone, now consolidating below resistance.
* Minor rejection seen from inside the purple supply box at 506.
* If bulls hold 501–503 zone, could be prepping a second push.
* Key Levels:
* Support: 501.48 / 497.78 / 494.11
* Resistance: 504.46 / 506.77
* Bias:
* 🟢 Bullish above 504.50, expecting breakout toward 510–512.
* 🔴 Bearish below 501.5, likely drop toward 497.8–495.
* Intraday Trading Setup:
* Scalp Long: Entry 504.5–505. Breakout candle confirmation.
* TP: 507. SL: 503.8
* Scalp Short: Entry <501.3
* TP: 498, SL: 503
* Swing Trade Scenario:
* Enter swing calls above 507. Hold for 515+ next week.
* Enter puts only if breakdown below 497.8 with CHoCH back down.
🎯 Final Thoughts:
MSFT is trading tightly below a significant GEX Call Wall, which often leads to a volatile breakout or strong rejection. If bulls push through 507+, we could see a sharp gamma squeeze into 510–515. However, if this fails, price may fade back toward 495–490 zone quickly. Patience at resistance is key.
Disclaimer: This analysis is for educational purposes only and does not constitute financial advice. Always do your own research and manage risk appropriately.

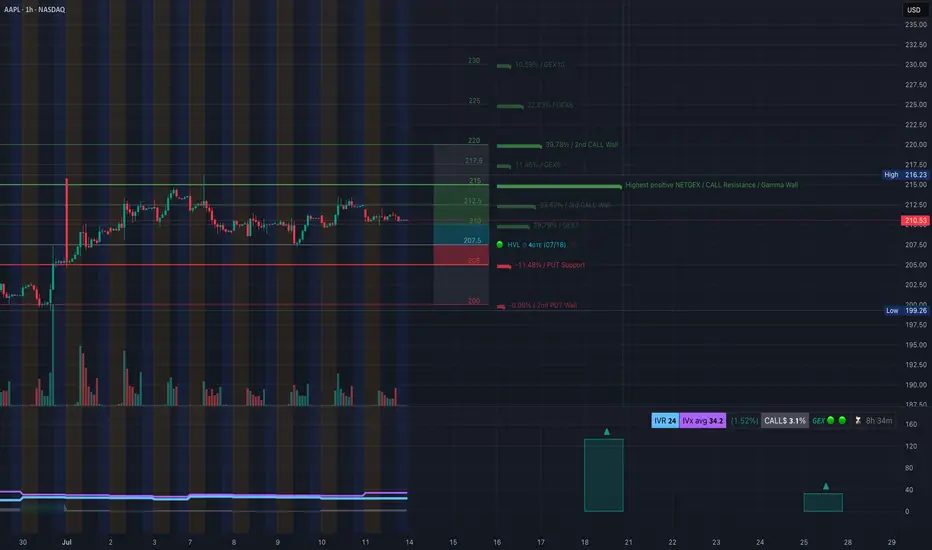
AAPL at a Pivotal Zone! TA for July 14AAPL at a Pivotal Zone! GEX & Price Action Align for Major Move 📉📈
🧠 GEX Sentiment (Options-Based Insight)
* Current Price: $210.53
* GEX Zone Traps:
* Below Price:
* 🟥 Put Support at $205 (-11.48%)
* 🔻 PUT Wall at $200 (-9.06%) — strong floor
* Above Price:
* 🟩 CALL Walls at:
* $212.5 → 29.79% GEX7
* $215 → 38.62% GEX6 (3rd largest resistance)
* $217.5 → 11.45% GEX9
* $220 → 39.78% GEX2 (heavy resistance zone)
* 🟩 Max GEX Cluster: $215–$220
* 🔺GEX10 spike at $230 → unlikely unless squeeze
* IVR/IVX:
* IVR: 24 (low volatility environment)
* IVX: 34.2 → Soft volatility bounce
* Call/Put Flow:
* Calls: 3.1% favored
* GEX trend: 🌕🌕🌕 (Neutral-to-Bullish if over $212.5)
📦 Interpretation:
Gamma compression is strong near $212.5–$215. If AAPL stays above $210.5 and reclaims $212.5, options market opens up space toward $217.5–$220. Below $207.5 = risk of drop toward $205 then $200 PUT wall.
🕹️ Option Trade Ideas Based on GEX
Bullish Strategy (IF Breaks $212.5):
* Trade: Buy AAPL 215c or 217.5c (Jul 19 or 26 expiry)
* Trigger: Hold above $212.5
* Target: $217.5–$220
* Stop: Break below $209.8
Bearish Strategy (IF Breaks $207.5):
* Trade: Buy AAPL 205p or 200p (Jul 19 or 26 expiry)
* Trigger: Loss of $207.5 with momentum
* Target: $205 → $200
* Stop: Reclaim of $210.5
🔍 1-Hour Chart Analysis (Price Action)
* Structure: Sideways consolidation between $207.5–$213.5
* Key Levels:
* Demand: $205–$207.5 (Buyers defended)
* CHoCH (Change of Character) confirmed near $209.8
* Resistance: $213.48 (rejected multiple times)
* Trendline: Rising wedge forming under liquidity sweep zone
* Liquidity Pools: Resting above $215 and below $205
* FVG/OB Zones: Thin FVG at $209.8–210.5 and mid OB around $207
📈 Scenario 1 (Bullish):
* If price bounces off $210 again and breaks $212.5 with volume, watch for sweep of $215–$217.5
* Watch for re-entry above CHoCH/BOS confluence near $211.5
📉 Scenario 2 (Bearish):
* If we break $207.5 and fail to reclaim $210.5 → liquidity vacuum opens toward $205 and $200
✅ My Thoughts & Suggestions
* Direction Bias: Neutral > Bullish if $212.5 is claimed, otherwise range-bound.
* Best Risk/Reward: Wait for $212.5 breakout confirmation OR $207.5 breakdown.
* Scalpers: Use $210.5–212.5 as chop zone — fade edges.
* Swing Traders: Only enter on clear breakouts with stop discipline.
🔒 Disclaimer:
This analysis is for educational purposes only and does not constitute financial advice. Always do your own research and manage your risk before trading.
PLTR at a Decision Point! for July 14GEX Walls and Wedge Breakdown Incoming?
🔸 GEX (Gamma Exposure) Breakdown for PLTR:
* Current Price: $141.99
* Key Gamma Resistance Zones:
* 📍 $145.15 – Highest Net Positive GEX (Gamma Wall)
* $144.58 – 2nd CALL Wall
* $146 – Overhead resistance from 2nd wall cluster
* Key Gamma Support Zones:
* $137 – HVL & 1st Put Layer
* $135 – 2nd Put Wall
* $132 – 3rd Put Wall
* $128.51 – GEX Low & Major Put Support
GEX Sentiment:
IVR: 39.3 (moderate)
IVx avg: 66.1
Options Flow Bias: CALL$ 56.7% – Slightly bullish
📈 Options Trade Strategy Based on GEX Zones:
🔹 Scenario A – Rejection from $145.15 (Most Probable):
* Bearish PUT Spread Play:
* Buy: $142.5 PUT
* Sell: $137 PUT (exp 7/19)
* Risk/Reward: Balanced downside toward HVL
* Trigger: If price stays below $142.5 and fails to reclaim $144.58
🔹 Scenario B – Breakout Above $145.15:
* Bullish CALL Play (speculative):
* Buy: $147.5 or $150 CALL
* Target: $155 (GEX9 zone)
* Only if: Price closes strongly above $145.5 on volume
🔸 GEX Outlook Summary:
* Upside capped at $146–$150 unless breakout volume enters
* Downside path to $135 / $132 is smoother if $140 breaks
* Gamma squeeze unlikely unless > $146
🧠 1-Hour Price Action & Intraday Trading Setup
⚙️ Market Structure:
* Trendline Support: Holding from recent rally
* CHoCH formed below resistance, suggesting a potential reversal
* BOS zone near $142.5–$144.6 creating supply
* Rising wedge breakdown forming
📊 Key Zones:
* Support: $140.53 (ascending trendline), then $137 (HVL)
* Resistance: $142.5 → $144.58 → $145.15
* Bearish Bias: As long as price is below $144.6
📉 Intraday Trading Plan (1H)
🔻 Short Setup:
* Entry: If price breaks below $140.50 with momentum
* TP1: $137
* TP2: $135
* Stop Loss: Above $144.60
🔼 Reversal Long (Less Probable):
* Entry: Break and hold above $145.15
* TP: $149.5 → $155
* SL: Below $143.5
🧭 Summary Thoughts:
* PLTR is sitting below strong GEX resistance with rising wedge weakness.
* Bearish structure forming unless bulls reclaim $145+ quickly.
* Favor PUT plays targeting $137–$135 unless breakout proves otherwise.
Disclaimer: This analysis is for educational purposes only and does not constitute financial advice. Always manage risk and do your own due diligence before trading.

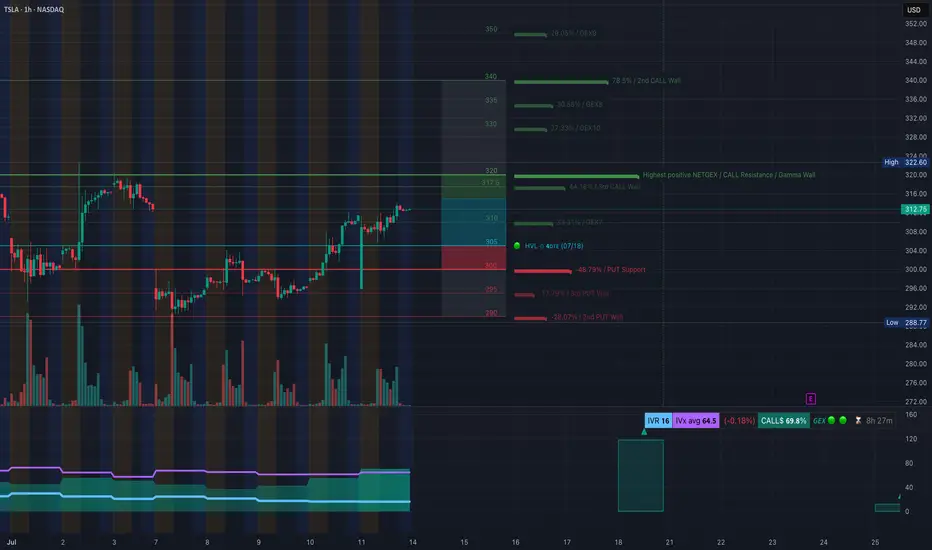
TSLA TA – Call Side Dominance Nearing Resistance-July 14TSLA GEX Analysis – “Call Side Dominance Nearing Critical Resistance 💥”
GEX Snapshot:
* Highest Positive GEX / Resistance: $320 – This is where call positioning is heaviest and likely where dealer hedging could resist further upside.
* Call Walls:
* $317.5 (44.18%)
* $320 (High NetGEX)
* $335–$340 (Intermediate resistance, weaker positioning beyond)
* Put Walls:
* $300 (48.79% support)
* $295 / $290 (3rd/2nd tier walls)
Options Oscillator:
* IV Rank (IVR): 16 (Low)
* IVx avg: 64.5
* Call Positioning: 69.8% (very bullish skew)
* GEX: 🔰 Bullish
🎯 Options Trade Setup:
Direction: Cautiously Bullish – but close to key resistance!
⚡ Aggressive Bullish Setup:
* Entry: Near $312.75 (current price)
* Strike: Buy $317.5C or $320C expiring this week
* Target: $320+
* Stop: Close below $308
* Note: Watch dealer hedging around $320. If TSLA breaks $320 with strength, gamma squeeze toward $335 is possible.
🛡️ Bearish Reversal Setup (if rejected at $320):
* Strike: Buy $310P or $305P (next week expiry)
* Trigger: Rejection at $320 + breakdown below $311
* Target: $304–$300
* Stop: Above $321
📉 TSLA 1-Hour Chart Analysis – “Breakout Zone or Fakeout Trap? Watch These Levels 🎯”
Structure:
* TSLA broke above the CHoCH and BOS zones between $308–$310. Price is consolidating under the $317.5–$320 resistance (also seen on GEX).
* There’s a clean ascending wedge/channel forming – upper boundary is near $320, and the lower trendline is near $304.
Key Zones:
* Supply Zone (Purple): $317.5–$320 (watch for rejection or breakout)
* Support: $309.8 (BOS zone), then $304 (trendline + demand overlap)
* Demand Zone: $293.5–$296 (origin of last rally)
🛠️ Trade Scenarios:
🔼 Bullish Continuation:
* Entry: Break and hold above $320
* TP1: $325
* TP2: $335
* SL: Below $311
🔽 Bearish Pullback:
* Entry: Rejection at $317.5–$320 zone and break below $309
* TP1: $304
* TP2: $296
* SL: Above $320
✅ Summary:
* GEX favors calls but $320 is a critical gamma wall – if broken, it opens room toward $335+.
* On the chart, watch the rising channel and upper resistance at $320.
* Bullish momentum is still intact unless $309 fails.
* Stay nimble: scalp calls on breakout, or prepare for a reversal put if there's rejection and structure break.
Disclaimer: This analysis is for educational purposes only and not financial advice. Trade at your own risk with proper risk management.
NVDA GEX Options Sentiment Analysis for July 14🧠 GEX Breakdown
* Key Gamma Resistance (Call Wall):
* $164.94 → Highest NET positive GEX (Gamma Wall) – Major resistance where market makers start hedging against further upside.
* $167.89 (local high) → aligns with 1st rejection wick.
* $170 → 2nd CALL Wall (67.29%) – max squeeze potential if $165 breaks with volume.
* Call Side Build-up:
* $167 – 20.62%
* $170 – 67.29%
Stacked CALL walls above = gamma trap if breached, but tough resistance ahead.
* Put Support Walls:
* $152.50 – Strongest downside gamma support
* $148–149 – Layered 2nd/3rd PUT Wall zone
📊 Options Flow Insights
* IVR: 5.6 (very low) → cheap premiums, low expected move
* IVX avg: 44.1
* Call/Put Bias:
* Calls: 11.8% dominance
* GEX Sentiment: ⚠️ Bearish Reversal Risk (high call saturation at resistance)
✅ Suggested Option Plays (Based on GEX Only)
🔸Bearish Rejection Play
* If NVDA rejects $164.94–$165.20 zone (Gamma + Supply confluence):
* Buy puts targeting $160 or $158
* Trade idea:
* Buy: NVDA 160p (Jul 19 expiry or same week)
* Entry: If price stalls/rejects $164.90–$165.20
* Target: $161 → $158
* Stop: Close above $166.00
🔸Bullish Gamma Squeeze (Only if $165 Breaks Cleanly)
* If price breaks and holds above $165.50 with strength
* Buy calls targeting $170 (2nd CALL Wall)
* Trade idea:
* Buy: NVDA 170c (Jul 19 or 26 expiry)
* Entry: $165.60+ breakout + strong volume
* Target: $169–$170
* Stop: Below $163.80
🕯 1-Hour Chart – Price Action Analysis
Market Structure
* CHoCH → BOS → BOS → creating a clear bullish leg, but current supply box at $165 is rejecting price short term.
* Trendline support: Still holding from July 8 lows
* Liquidity zone: $160.96–$161.10 (first demand zone)
Current Setup
* Price is hovering under supply zone + GEX wall → indicating indecision or potential short-term top
* MACD weakening + volume declining = possible pause or reversal
* Clean higher-low structure still intact for now
🎯 Trade Plan Based on 1H Chart
🟢 Bullish Intraday Plan
* Entry: $161.00–$160.50 demand block
* Confirmation: Bullish engulfing or rejection wick
* Target: $164.94 then $167
* Stop-loss: Below $159.80
🔴 Bearish Intraday Plan
* Entry: $164.90–$165.20 inside supply
* Confirmation: Weakening candle (doji or long wick) + no breakout
* Target: $161.00 then $158.80
* Stop-loss: Above $166.10
✍️ My Thoughts
NVDA is coiling just under a heavy GEX resistance wall. If $165 can't break, downside correction to $161–$158 is probable. GEX suggests sellers may be in control unless bulls force a gamma squeeze over $165. Stay patient — let the levels react.
This breakdown is for educational purposes only and not financial advice. Always manage your risk.

TSLA / Earning seasonNASDAQ:TSLA showing nice price action bounce off the base last week. With earnings season here, watch the $315 level — a breakout could send it toward $320 and $326 next 🚀📈 #TSLA

NFLX Price ActionNASDAQ:NFLX showing strong bearish momentum on the 1H. If it breaks below the key $1230 level, next support sits near $1215 — watch for continuation flush 👀🔥

MMM eyes on $140: Key Support that bulls MUST hold for next leg MMM trying to recover and last Earnings were good.
Currently testing a proven zone at $140.06-140.37
Bounce here would Target zone at $147.90-148.35
