MMM eyes on $140: Key Support that bulls MUST hold for next leg MMM trying to recover and last Earnings were good.
Currently testing a proven zone at $140.06-140.37
Bounce here would Target zone at $147.90-148.35

SIRI: Will you swim with Warrent Buffet?SIRI:
When Mr. Warren Buffett announced his purchase of SIRI, the stock price dipped as the crowd chased after it. Meanwhile, he quietly accumulated shares at the bottom. Once the crowd lost interest, the opportunity for SIRI to rebound emerged.
Are you swimming with Mr. Buffett?
.
US STOCKS- WALL STREET DREAM- LET'S THE MARKET SPEAK!

EAT eyes on $134: Earnings Dump fell into a key support to buy?EAT earnings report was apparently pretty bad.
Fell through several supports but trying to hold.
Watch critical and proven zone at $134.06-134.77

GNRC watch $114.19: Minor but Key fib to end Perpetual DowntrendGNRC has been trying to paint a bottom for the last month.
Now watching the Genesis fib at $114.19 for Break or Reject.
If it rejects then we will watch double fibs at $107.66-107.72

Double-Fistin' Jade-Lizards on $EXASFIRST ONE:
7/18 EXPIRATION
+1 $57.5 call
-1 $55 call
-1 $52.5 put
$49.1 BE ($340 credit)
SECOND ONE:
8/22 EXPIRATION
+1 $61 call
-1 $60 call
-$ 51 put
$48 BE ($300 credit)

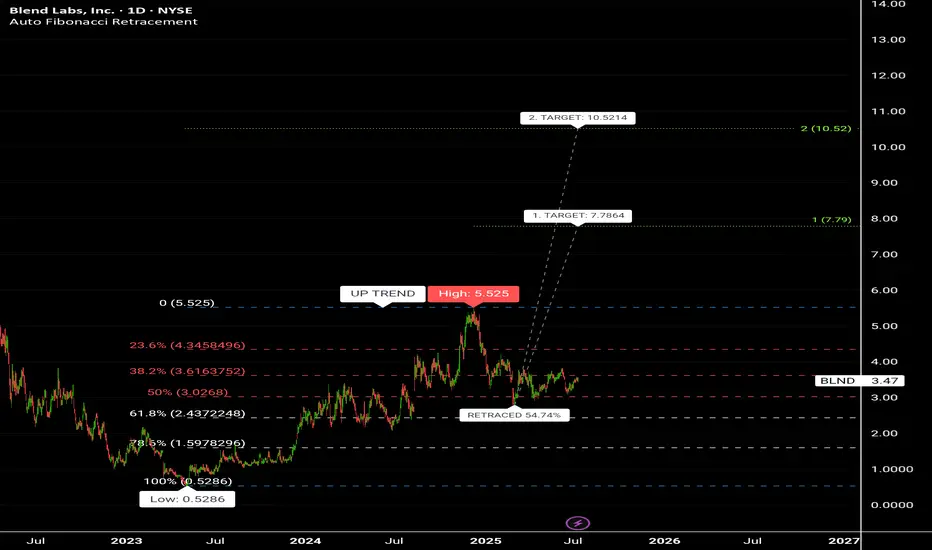
Blend Labs inc (BLND).ABCD Strategic retracment had been implementing on the chart .
Two Target prices are shown on chart , 1st Target price = 7.79 $ , and 2nd Target price = 10.52$ and this match the same Target price of the Cup and Handle pattern that almost formed by crossing nick line at 5.53$ .
It seems to me: A Positive Massive news will be appear to the public soon, and that will reach the Stock price to 10.52$ near future.
💣💣💣💣💣 Highly recommended for Buying 🔥🔥🔥🔥🔥🔥
Correlation between 2021 squeeze and 2024-2025 price actionRefer to my 2021 squeeze post idea, you can see a very similar pattern, I predict 30s mid august followed by another dip. MOASS? Probably not but maybe assuming crime has run out of tricks

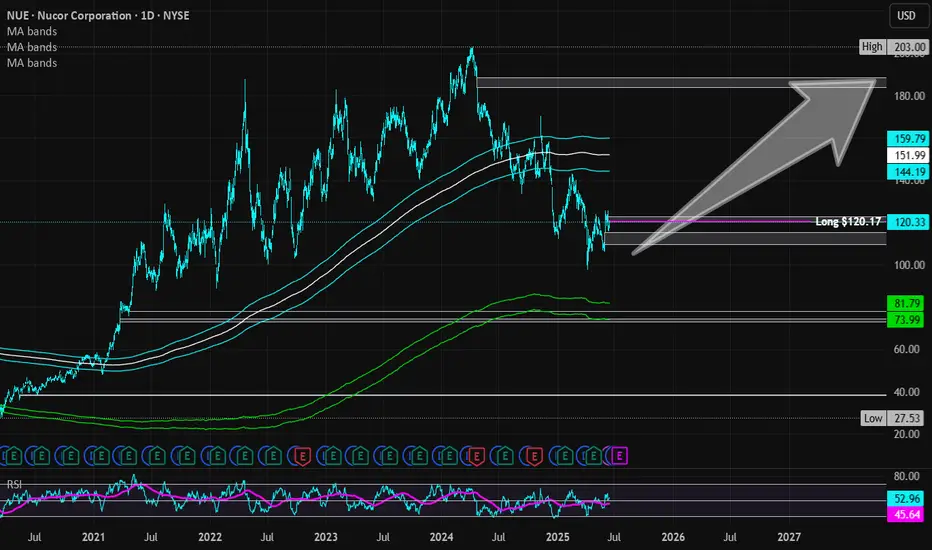
Nucor | NUE | Long at $120.17Nucor NYSE:NUE , a US manufacture of steel and steel products, will likely capitalize on reduced foreign competition as tariffs become reality. The CEO also recently stated that the steelmaker's order backlog is the largest in its history and is increasing prices. So, while there is a potential for short-term downside as tariff "unknowns" are negotiated, the longer-term upside may be there for those who are patient... but time will tell.
Basic Fundamentals:
Current P/E: 21x
Forward P/E: 15-16x
Earnings are forecast to grow 29.6% per year
Projected Revenue in 2025: $32.3 billion
[*} Projected Revenue in 2028: $39.4 billion
Debt-to-Equity: 0.4x (healthy)
Dividend Yield: 1.8%
Technical Analysis:
Riding below the historical simple moving average and there is risk the daily price gap near $109 will close before moving higher. If there is a "crash" in price, $70s is absolutely possible which will be a "steel" if fundamentals do not change.
Targets in 2027:
$142.00 (+18.2%)
$187.00 (+55.6%)
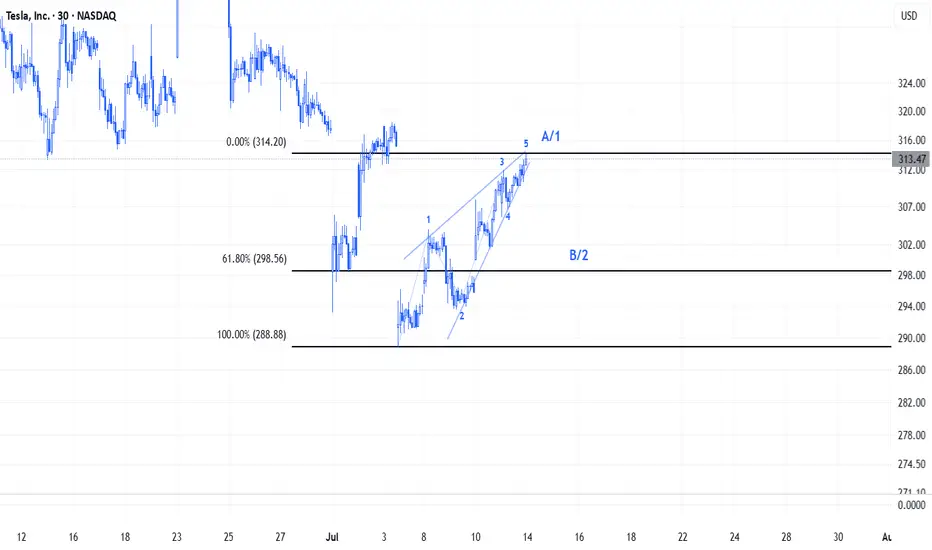
Tesla could make a move here... (July 13, 2025)Tesla's 2 Day chart looks bullish here with the RSI, let's talk about it!

GME Potential UpsideGME looks attractive from a risk to reward perspective. I am not interested in the short squeeze speculation but the technicals and recent acquisition of BTC in their balance sheet has caught my attention as they have been sitting on capital for quite some time now.
Theres a clear gap around 28.50 and of course looming tarrifs are something to look out for. Id keep my eye on this one.

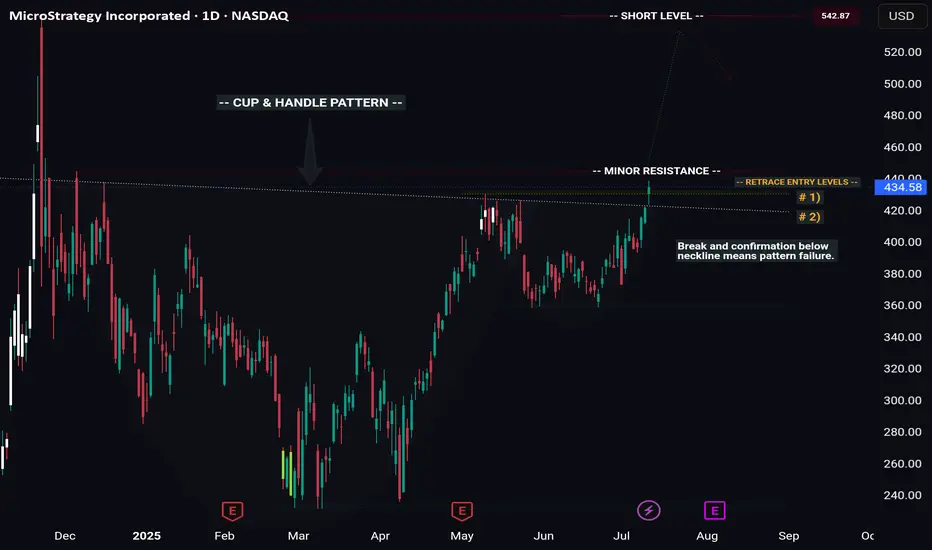
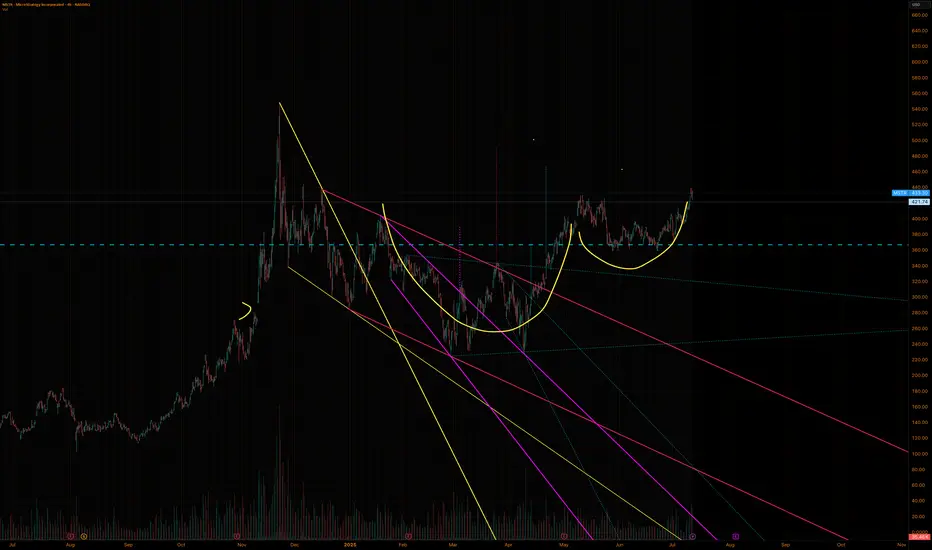
MSTR -- Cup & Handle Breakout // Long & Short SetupsHello Traders!
There is a beautiful cup and handle pattern that has formed on MSTR (Microstrategy).
This pattern offers us a wonderful long setup, as well as a potential short at the all time high.
Pattern Failure: If price both breaks and confirms below the C&P neckline the pattern is void.
Price will likely temporarily pull back from the all time high, giving us our short setup. However you'll want to be in and out quick considering price will likely continue to new highs after pulling back.
I will be swing trading the long setup and likely day trading the short setup.
Have fun and best of luck to everyone on their trading journey!

Cup and handleAfter many months, we now have a cup and handle formation. Regardless of Michael Saylor's constant buying, we have a bull flag in play that takes us to $491 USD.
$ACHR SQUEEZETime Frame: 1D
RSI : Neutral
MACD : Nearing bullish cross
Fib Levels : Retraced back to 50.0%
Targets:
#1: $13.09
#2. $16.94
Pattern invalidated of drop below 61.8% ($8.74) Fib level.

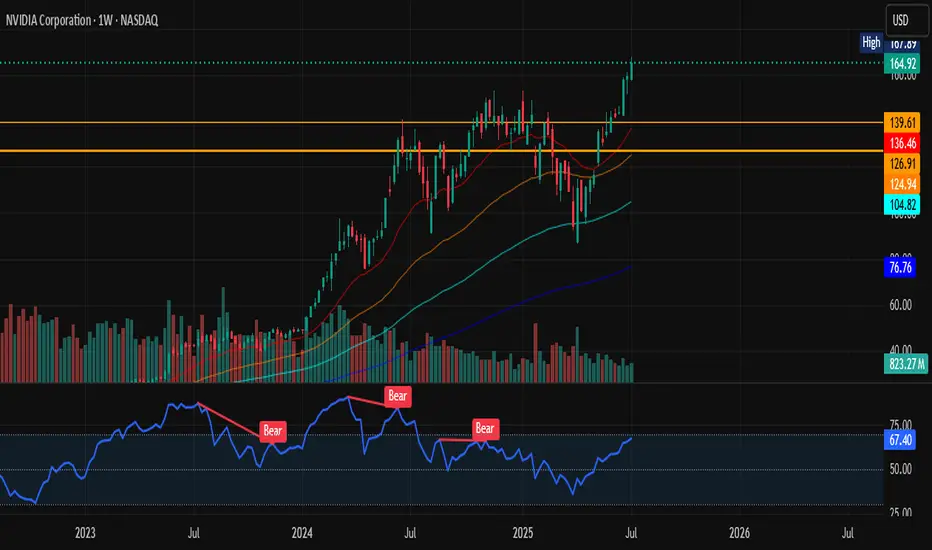
NVIDIA Technical Breakdown NASDAQ:NVDA has broken above the previous congestion/resistance zone (~$139–$145). This zone was tested multiple times and now acts as a support base.
Volume on the breakout week is strong and supporting the move.
Weekly RSI is 67.40, approaching overbought but NOT YET overheated (no bearish divergence). RSI broke past prior Bear zones, signaling renewed strength. Only time will tell.
All-time high territory so proceed with caution. Always due YOUR OWN research.
Bullish long-term trend intact as price is above all EMAs (not too shabby).
I wouldn't be surprised for a pull back soon; maybe 145ish.
Happy Sunday ya'll!
**As always: this isn't financial advice. Please seek professionals on any investments.
While You Were Watching NVIDIA, Oracle Quietly Ate the BackendEveryone's chasing the AI hype but Oracle is one of the only companies selling the picks and shovels behind the scenes.
While headlines focus on NVIDIA, Meta, and ChatGPT, Oracle has been building the back-end massive AI-ready data infrastructure, hyper scale cloud partnerships, and GPU clusters feeding OpenAI and Nvidia workloads directly.
This isn’t some pivot or marketing gimmick Oracle Cloud Infrastructure (OCI) is quietly powering the largest LLMs in the world. And Wall Street is only beginning to price that in.
Why Oracle’s Move Is Just Getting Started
1. AI Cloud Infrastructure – Not Just Software
Oracle Cloud Infrastructure (OCI) is integrated directly into OpenAI, NVIDIA, Microsoft, and Cohere LLM workflows. Ellison confirmed that AI demand on Oracle’s cloud is now booked out for years, including custom GPU clusters. OCI outperforms AWS in specific AI workloads at a lower cost. That’s a disruptor narrative in itself.
2. Earnings Momentum + Smart Money Rotation
Oracle just printed double-digit YoY cloud growth, increased margins, and committed billions in CapEx classic early-growth behaviour. It’s now a value + AI hybrid, attracting funds rotating into defensible, profitable AI infrastructure plays.
3. Stage 2 Breakout – Repricing in Motion
ORCL broke above its 2021 all-time high ($188) with conviction. Stage 2 began around $195–200, with high volume + range expansion. This is a textbook Stage 2 expansion phase not a short squeeze, not a blow-off top. Monthly structure confirms 23+ years of consolidation is complete.
Technical Markup Summary
- Stage 2 Breakout Level - $195–200
- Support Zone (Prior ATH) - $185–190
- Volume Confirmation - Highest range + volume since Dotcom era
- Current Price Action - Early parabolic expansion = healthy trend
Projected Price Targets
- TP1 $275 Fib 1.618 + round number magnet
- TP2 $310–320 Revaluation zone if earnings accelerate
- TP3 $420+ AI AWS narrative fully priced in
Why This Isn’t a Late Entry
Most traders wait for headlines and miss the Stage 2 phase, which is where real money is made. Oracle is now being repriced for the role it’s actually playing in AI not just as a legacy tech name, but as a global infrastructure layer. This breakout isn’t the end it’s the beginning.
Oracle is no longer just “that enterprise database company.” It’s becoming a core infrastructure provider for the AI era, with multi-year demand, sticky revenue, and strong technical structure.
If you missed NVIDIA’s early breakout this may be your redemption arc.
Defined support at $190
Open runway to $275+
This is a swing-to-position hold for high-conviction players. What's your thoughts?


NVDA Daily Chart – Rising Wedge Alert!Just analyzed this NVDA setup. We’re seeing a clear rising wedge forming near the top of a strong run-up — typically a bearish reversal pattern. Price tagged $167.89 and pulled back slightly, closing at $164.92.
If this breaks down, watch the $148.67 - 151.31 area, and below that $125 as a key level. Bulls want to see a strong hold and breakout above $168 to invalidate the wedge.
#NVDA #NVIDIA

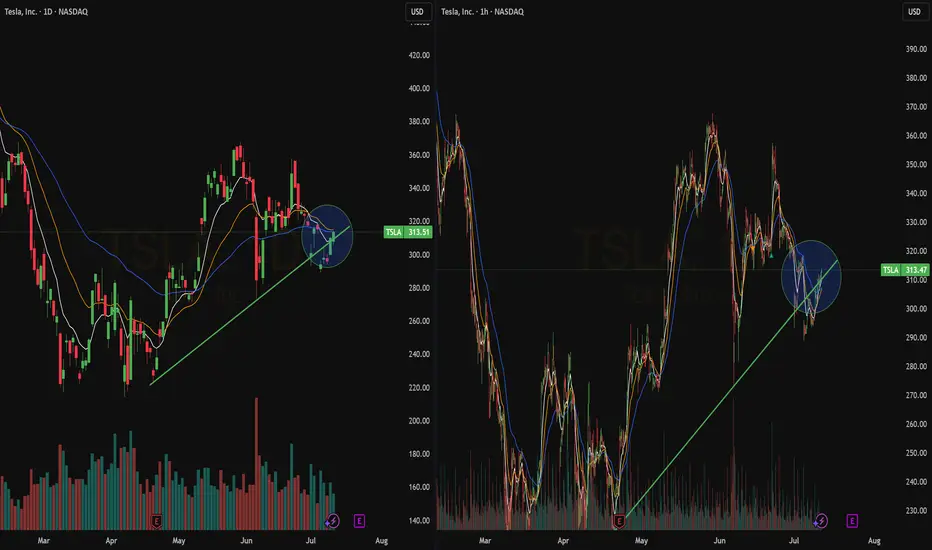
Quick Update : TSLABullish Crossover on the hourly chart at the bottom of the channel.
The action of the last hours is weak as can be seen by the lack f volume.
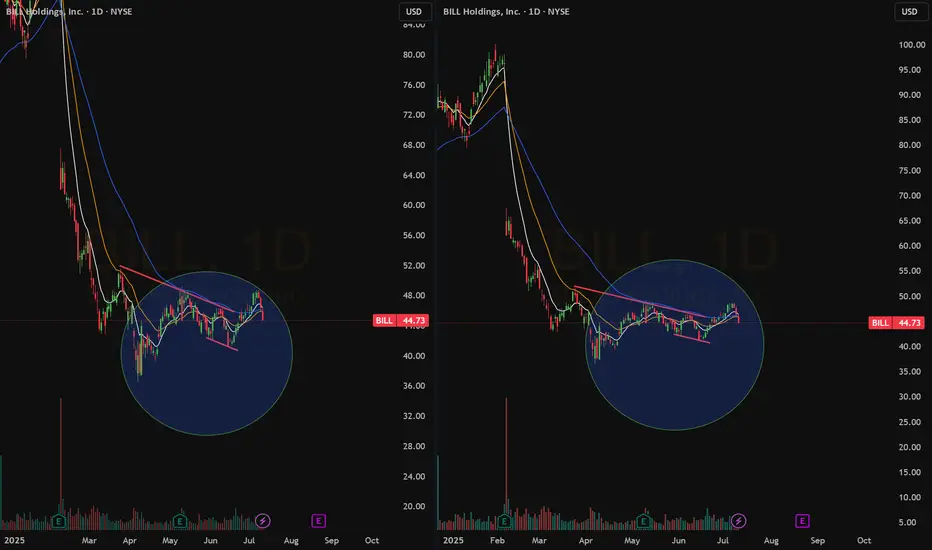
QuickView : $BILLThe stock is actually shaking among $50 and $40. I already have a short seutp. This time I see even a long setup after the small crossover on the daily Chart. Always ready to take both directions with much care to fake breakouts.
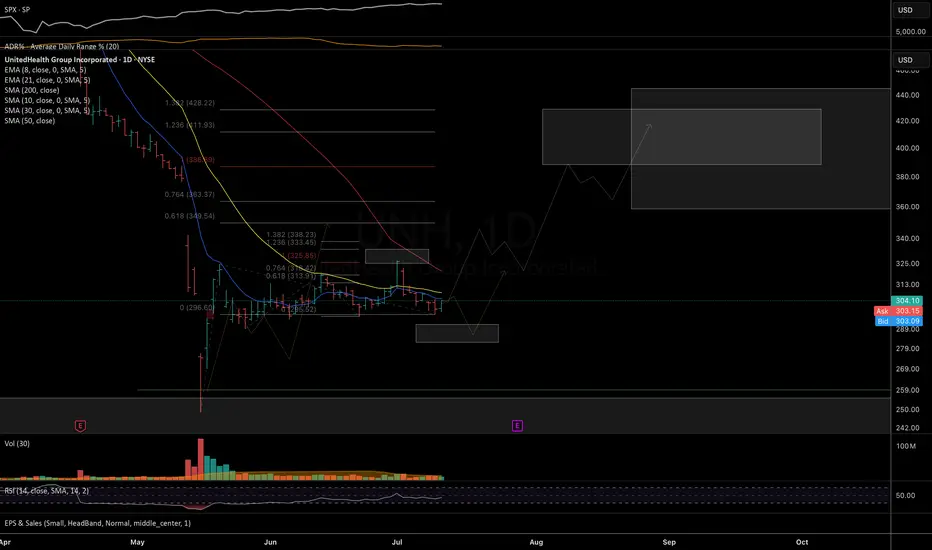
$UNH – Macro Outlook UpdateBack in April, I suggested the long-term uptrend from 2008 may have topped, shifting into a multi-year correction toward the 260–150 support zone. The decline unfolded faster than expected, with news-driven selling hitting the upper edge of that macro support — followed by a strong rebound.
Apr mind www.tradingview.com
Currently, price is consolidating constructively. As long as 282 holds, I favor a continuation higher into the 360–430 resistance zone where we’ll reassess the broader structure.
Daily chart
Macro chart
Thank you for your attention and I wish you successful trading and investing decisions!
TSLA Elliott Waves We can clearly see that a Leading Diagonal is formed on TSLA's chart.Leading Diagonal usually occurs on Wave A or Wave 1.After this chart pattern, a correction often follows reaching nearly the 61,2% fib levels of the Diagonal
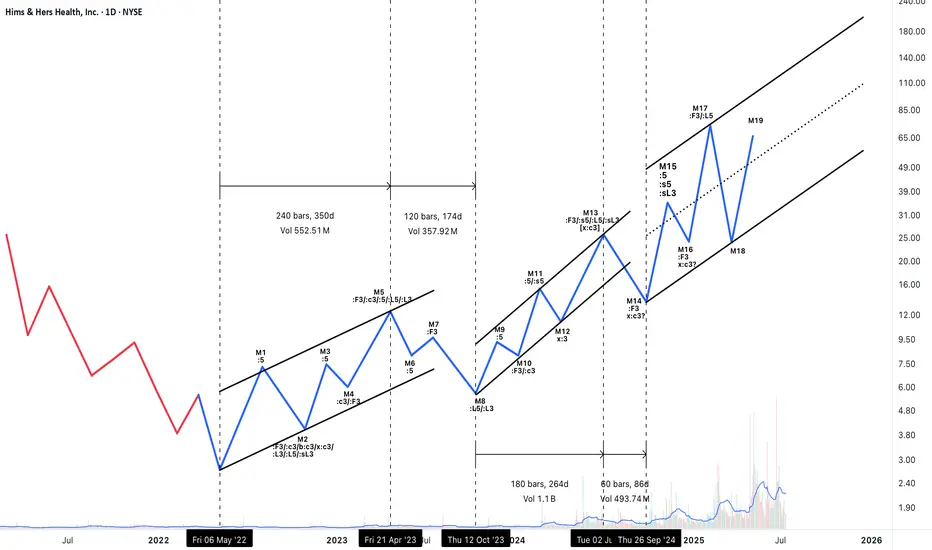
Neowave Structural Outlook – Complex Correction: W–X–Y–X–ZThis analysis interprets the ongoing structure as a Complex Correction in the form of a W–X–Y–X–Z pattern. Here's a breakdown of the logic behind the wave labeling and key observations:
Overall Structural Summary:
W wave (M1–M5): Though M1 is labeled as ":5", a closer examination of its internal structure reveals corrective characteristics. Therefore, the entire M1–M5 segment is best interpreted as a complex corrective structure, possibly a double three or flat.
X wave 1 (M6–M8): A clear Zigzag, fulfilling the requirements for a valid X. All relevant time and price criteria are met, forming a neat connector after W.
Y wave (M9–M13):
M9–M10: A Zigzag formation.
M11–M12–M13: M12 serves as an x-wave, and M13 unfolds as a simple corrective move in three waves, completing the Y wave. Though M13 is a single-leg visually, the internal structure confirms a three-part move.
The Y wave is longer in both time and complexity, appropriate for its position in the sequence.
X wave 2 (M14): Despite appearing as a short single move, it satisfies the X criteria in the context of the ongoing correction. The small size is acceptable as per rule allowances for connectors in Z formations.
Z wave (M15–ongoing):
M15–M17: Another Zigzag, forming the first leg of Z.
M18: Likely the X connector within Z.
M19: Assumed to be the beginning of the final leg of Z. The structure from here forward will determine whether Z completes as a triangle, zigzag, or another combination.
Supporting Rule Applications:
Several Neowave rules were cross-verified:
- Rule 2a and 5a were referenced to validate corrections that exceed the 61.8% retracement and duration benchmarks.
- Rule 7c and 4 supported impulse invalidations and corrections involving running structures.
Time symmetry across connectors and leg duration was considered to maintain wave consistency.
Visual Channels:
All W, Y, and Z legs are progressing within clearly defined channels.
The Z leg is currently within a steep rising channel. If Z completes as a non-triangular formation, a reversal might follow.
Conclusion & Risk Notes:
This structure, though corrective in nature, contains strong upward segments — especially within Z — making it tradable for bullish swings.
Given that Z is the final leg, caution is warranted. Once Z completes (especially if M19 develops into a three-wave structure), the larger correction may terminate, potentially leading to a larger trend reversal.
Position management (e.g., scaling out or using stop-losses) is advised as the structure evolves.