BX Long Trade Setup!📊
⏱️ Timeframe:
30-minute chart
📍 Technical Highlights:
Bullish pennant breakout forming after a strong uptrend (continuation pattern ✅)
Breakout area: Around $163 (red resistance)
Support held near $162 zone (white/yellow lines)
🎯 Targets:
TP1: $164.15
TP2: $165.05
(Both resistance levels marked in light blue)
🔐 Risk Management:
Entry: ~$163 (after pennant breakout confirmation)
Stop Loss: Below $161.80 (tight risk)
Risk–Reward Ratio: Excellent (>2:1)

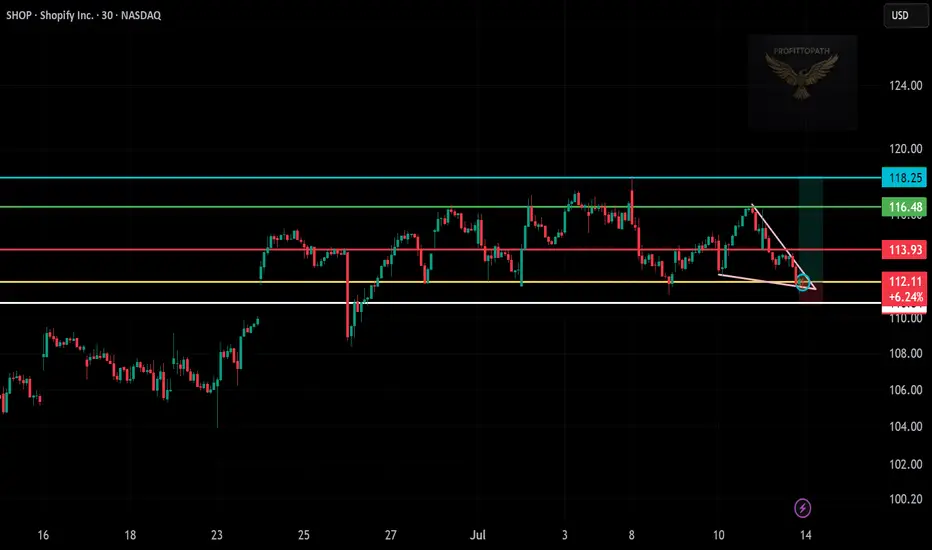
Trade Setup: Long on SHOP!📊
🕒 Timeframe:
30-minute chart
📍 Technical Overview:
Falling wedge breakout detected ✅
Support zone: $111.50–$112 (held well)
Breakout confirmation near $113
Target zones:
TP1 🎯: $116.48 (green resistance)
TP2 🎯: $118.25 (major resistance)
🔐 Risk Management:
Stop loss: Below $111.50 (white support)
Risk–Reward Ratio: Over 2:1 ✅
📈 Trade Plan Summary:
Entry: $113.00–$113.50 (breakout zone)
Target: $116.48 → $118.25
Stop loss: Below $111.50
Very DangerousCarvana back near all time highs while in an expanding triangle formation. These happen at times where volatility is increasing and swings have become more wild. It can be a sign a lower liquidity causing small dollar amounts to change the stock's price more drastically.
A daily close under $330 is a giant sell signal for me. Advising extreme caution for those long this stock. I believe there are plenty of better investments out there with far less risk.

META | Accumulation Zone Identified — Road to $990?🧠 META | Accumulation Zone Identified — Road to $990?
📊 Ticker: META (Meta Platforms Inc.)
🕒 Timeframe: 1H
📍 Current Price: $717.36
📈 Bias: Bullish accumulation → Expansion
🔍 WaverVanir DSS Thesis
Our system has flagged a liquidity harvesting and accumulation phase between $676–$740. Institutional behavior suggests price is returning to equilibrium before a potential reaccumulation and markup.
🔑 Key SMC Zones:
🔺 Premium Zone: $729–$740 — recent rejection + liquidity engineered
🔻 Discount Zone: $676–$696 — ideal accumulation range
🔵 Equilibrium Pivot: ~$705
🟦 Volume Cluster: $716–$718 → short-term magnet and likely chop area
📐 Fibonacci Confluence:
0.786 Fib = $729.37 (converging with premium zone)
1.272–1.618 extensions → Targets = $870, $990+
0.618 retracement = $676.60 — deep discount level
🚨 VolanX Execution Logic:
Wait for sweep + displacement below $700
Watch for internal BOS + higher low formation
Confirmed entry above $729 = breakout of accumulation
Scale-out zone: $870 → $990+
🧬 Trade Strategy:
Leg Action Level Risk
A Accumulate $680–$705 Low
B Confirm Break $729+ Medium
C Profit Zone $870 / $990 High reward
⚡ Alpha Outlook: META is in a controlled markup with engineered pullbacks. This is where narratives shift, and the smart money loads. VolanX signals strong alignment with SMC zones — this may be a high-conviction multileg long.
#WaverVanir #VolanX #META #SmartMoney #TradingAlpha #SMC #Accumulation #Gamma #OptionsFlow #LSTM #DSS #AITrading #TechStocks #GrowthEquity #Fibonacci #TradingView

ADOBE MONEY SNATCH! High-Reward Long Setup (Police Trap Alert!)🚨 ADOBE HEIST ALERT: Bullish Bank Robbery Plan! (High-Risk, High-Reward Loot) 🚨
🌟 ATTENTION, MARKET PIRATES & MONEY SNATCHERS! 🌟
(Hola! Bonjour! Marhaba! Hallo!)
🔥 THIEF TRADING STRATEGY 🔥 – ADOBE INC. (ADBE) is primed for a bullish heist! Time to steal profits like a pro!
🔓 ENTRY POINT: "BREAK THE VAULT!"
"The loot is unguarded!" – Go LONG at any price, but for smarter robbers:
Set Buy Limit orders (15m/30m recent swing levels).
ALERT UP! Don’t miss the heist signal!
🛑 STOP-LOSS: "ESCAPE ROUTE!"
Thief SL: Nearest 2H nearest Swing Low (Adjust based on your risk tolerance & lot size).
Police (Bears) are lurking – Don’t get caught!
🎯 TARGET: 440.00 (OR BAIL BEFORE THE COPS ARRIVE!)
Scalpers: Stick to LONG side only!
Big Bankroll? Charge in! Small stack? Join the swing robbers!
Trailing SL = Your Getaway Car!
📢 WHY ADOBE Inc?
🐂 Bullish momentum + Overbought but greedy!
🚨 High-risk Red Zone – Trend reversal? Police trap? Bears are strong here!
💸 "Take profits & TREAT YOURSELF – You earned this loot!"
📡 STAY SHARP, THIEF!
Fundamentals, News, COT Reports, Geopolitics – CHECK THEM! (Linkkss ☝👉👆👉).
Market shifts FAST! Adapt or get caught holding bags!
⚠️ WARNING: NEWS = VOLATILITY TRAP!
Avoid new trades during news!
Trailing stops = Your bulletproof vest!
💥 BOOST THIS HEIST! 💥
"Like & Boost = Stronger Robbery Crew!"
💰 More boosts = More profit heists! 🚀
Stay tuned… Next heist coming soon! 🏴☠️🤑

MP Materials Options Ahead of EarningsIf you haven`t bought MP before the previuos earnings:
Now analyzing the options chain and the chart patterns of MP Materials prior to the earnings report this week,
I would consider purchasing the 25usd strike price Calls with
an expiration date of 2025-6-20,
for a premium of approximately $2.97.
If these options prove to be profitable prior to the earnings release, I would sell at least half of them.

It looks like a good support is forming3.25-3.40 is starting to built support. I seems like Bngo is in accumulation phase.
Just waiting.

$7.73 to $76.00 in 1 day! Another 800% runner $INKTAGAIN? Another 800% runner in a day? 🚀 Such massive moves became a daily thing these days? 😲 NASDAQ:INKT
Can't wait to see new one in the morning!

KALA BIO (KALA) Bullish Channel Breakout Setup – Eyes on $13 KALA BIO (KALA) is forming a bullish ascending channel after a prolonged base, with price consistently making higher lows and higher highs. The current setup suggests strong accumulation, and the stock is now approaching a potential breakout point.
A clear uptrend channel is visible, and a breakout from this pattern could trigger a powerful move towards the analyst target at $13.00, as marked on the chart. The green arrow highlights the expected bullish momentum if the breakout materializes.
Trade Idea:
Entry: On breakout above the upper channel line, confirming momentum
Target: $13.00 (analyst target)
Stop: Below the channel support or recent swing low to manage risk
Volume confirmation and overall market sentiment will be key. As always, use proper risk management and do your own research before entering any trade.

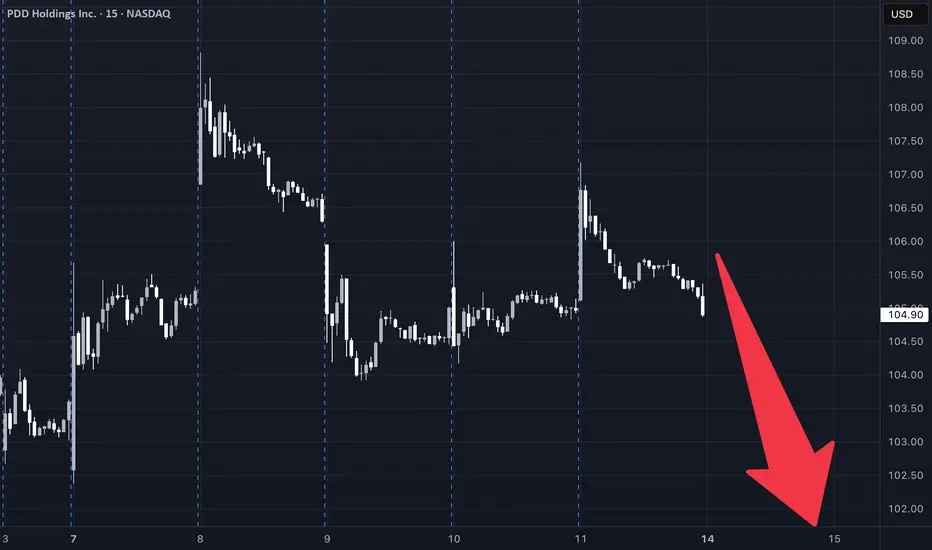
PDD Stock Trading Plan (2025-07-12)PDD Stock Trading Plan (2025-07-12)
Final Trading Decision
1. Comprehensive Summary of Each Model's Key Points
DS Report
Technical Analysis: Price: Currently at $104.91, facing short-term bearish pressures with significant support at $104.83. Indicators: Short-term indicators (30-min) show bearish signals, while daily indicators hint at a potential bullish reversal (e.g., MACD bullish divergence). Sentiment: Mixed headlines with a stable VIX suggest a favorable but cautious entry environment. Trade Strategy: Long with a target of $108.70 and stop loss at $104.10 based on recent support levels.
LM Report
Technical Analysis: Price: Above the long-term bullish trend but facing near-term resistance. Indicators: Neutral RSI levels do not suggest a clear direction. MACD shows some signs of hesitance. Sentiment: Slightly bullish due to institutional flows and a falling VIX but lacks strong conviction. Trade Strategy: Suggests a long position at $105.50, with a profit target of $113.64.
GK Report
Technical Analysis: Describes a neutral situation with prices around key EMAs and exhibiting consolidation. Weak momentum signals indicate uncertainty regarding outright positions. Sentiment: Highlights mixed news with both bullish and bearish implications. Trade Strategy: Recommends not to trade due to the unclear directional bias.
CD Report
Technical Analysis: Confirms short-term bearish momentum with price below moving averages and mixed momentum indicators. Suggests a moderately bearish sentiment based on resistance levels. Sentiment: Slightly positive VIX implies stability; however, recent call volumes show mixed institutional sentiment. Trade Strategy: Strong short position recommended to profit from resistance at $105.70.
2. Areas of Agreement and Disagreement
Agreement:
Most models agree on near-term bearish indicators (e.g., weak momentum, mixed MACD signals across timeframes). Multiple reports note the importance of the $104.30-$106.20 price range as critical support/resistance.
Disagreement:
Long vs. Short Positions: DS and LM suggest potential long positions based on technical rebounds, while CD firmly recommends a short position anticipating downward movement. Market Sentiment: Some models see potential bullish opportunities in VIX stability and call volume, while others express caution due to mixed signals.
3. Conclusion and Recommendations
Overall Market Direction Consensus
The market is in a neutral to moderately bearish state based on the conflicting signals from the models. The current indicators do not suggest a strong bullish trend, while technical analysis indicates possible downward momentum.
Recommended Trade
Direction: Short Position Entry Price: $104.90 at market open. Stop Loss: $106.20 (1.2% loss). Take Profit: $102.50 (2.3% gain). Position Sizing: Based on a $10,000 account with a 2-3% risk tolerance, risking approximately $100-$120 total. Holding Period: 3-4 weeks maximum. Confidence Level: 65% based on resistance rejection and mixed sentiment.
Key Risks and Considerations
Risk of a market reversal if bullish news arrives or a strong institutional buying momentum occurs. Close monitoring of technical indicators is required, particularly the MACD and RSI, as conditions shift either direction could warrant position adjustments.
TRADE_DETAILS (JSON Format)
{ "instrument": "PDD", "direction": "short", "entry_price": 104.90, "stop_loss": 106.20, "take_profit": 102.50, "size": 200, "confidence": 0.65, "entry_timing": "open" }
📊 TRADE DETAILS 📊 🎯 Instrument: PDD 📉 Direction: SHORT 💰 Entry Price: 104.9 🛑 Stop Loss: 106.2 🎯 Take Profit: 102.5 📊 Size: 200 💪 Confidence: 65% ⏰ Entry Timing: open
Disclaimer: This newsletter is not trading or investment advice but for general informational purposes only. This newsletter represents my personal opinions based on proprietary research which I am sharing publicly as my personal blog. Futures, stocks, and options trading of any kind involves a lot of risk. No guarantee of any profit whatsoever is made. In fact, you may lose everything you have. So be very careful. I guarantee no profit whatsoever, You assume the entire cost and risk of any trading or investing activities you choose to undertake. You are solely responsible for making your own investment decisions. Owners/authors of this newsletter, its representatives, its principals, its moderators, and its members, are NOT registered as securities broker-dealers or investment advisors either with the U.S. Securities and Exchange Commission, CFTC, or with any other securities/regulatory authority. Consult with a registered investment advisor, broker-dealer, and/or financial advisor. By reading and using this newsletter or any of my publications, you are agreeing to these terms. Any screenshots used here are courtesy of TradingView. I am just an end user with no affiliations with them. Information and quotes shared in this blog can be 100% wrong. Markets are risky and can go to 0 at any time. Furthermore, you will not share or copy any content in this blog as it is the authors' IP. By reading this blog, you accept these terms of conditions and acknowledge I am sharing this blog as my personal trading journal, nothing more.
XOM 125 PT Leader of its sector XLE and showing relative strength.
Technical analysis is consistent with pattern formation and breakout
GOOGL Raid Plan: Bulls Set to Hijack the Chart!💎🚨**Operation GOOGL Grab: Robbery in Progress! Swing & Run!**🚨💎
🌟Hi! Hola! Ola! Bonjour! Hallo! Marhaba!🌟
Dear Money Makers & Silent Robbers, 🤑💰💸✈️
Get ready for another high-stakes market heist – this time, we’re raiding the vaults of GOOGL (Alphabet Inc.) using the Thief Trading Strategy™. Based on sharp technical intel and subtle fundamental whispers, the setup is clear: the bulls have cracked the code, and it’s time to grab our loot.
🟢 🎯 ENTRY POINT - THE LOOT ZONE
"The vault is wide open!"
Snatch your bullish entry anywhere on the chart, but the pros will place limit buys on recent pullbacks (15m/30m zones), either on swing lows or highs. The pullback is your door in — don’t miss it!
🛑 STOP LOSS - ESCAPE ROUTE
Set the Thief SL at the recent 2H swing low (162.00).
But remember, each robber’s risk appetite is unique — adjust your SL based on your size, cash, and courage.
🎯 TARGET - GETAWAY MONEY
💼 Main Target: 186.50
Or if heat rises early, vanish with your gains before the full score hits. Disappear like a ghost — profit first, questions later!
🧲 FOR SCALPERS – THE QUICK GRAB
Only ride the long wave — shorting is off-limits in this mission.
If your wallet is loaded, dive in. If not, join the swing crew.
Use trailing SL to protect your cash stack 💰.
📈 THE SETUP – WHY THIS RAID WORKS
The GOOGL Market is bursting with bullish energy — a classic Red Zone robbery moment.
Overbought tension, fakeouts, trend shifts — exactly where we love to strike! Consolidation and reversals = opportunity for the brave.
📣 TRADING ALERT - NEWS AHEAD!
🚨 Avoid entries during news releases – they trigger alarms!
Use trailing SL to lock in your stash, especially during high-volatility windows.
🔍 TIPS FROM THE THIEF’S DESK
Stay updated with the latest whispers — from fundamentals to geopolitical noise, COT positioning to sentiment swings. The market changes faster than a thief on the run — so adapt fast!
💖 Show some love: 💥Hit that Boost Button💥
Let’s fuel this robbery plan with more power and precision.
Every day in the market is a new heist — let’s win like thieves, not sheep. 🏆💪🤝❤️🚀
I'll be back soon with another masterplan...
📡 Stay sharp, stay hidden — and always aim for the vault. 🤑🐱👤🎯

BTM Triangle Squeeze: Watching for Breakout Above TrendlineBitcoin Depot Inc. (BTM) is setting up for a potentially explosive move as price action consolidates within a tightening triangle pattern. After a strong rally from mid-May, BTM found consistent support along an ascending trendline, recently bouncing and holding above this key area.
Currently, price is pressing up against a well-defined descending breakout line. A clear break and close above this trendline could signal the start of a new bullish leg, especially with analyst price targets near $7.00 suggesting further upside potential.
My Trade Plan:
Entry: Watching for a confirmed breakout above the descending trendline, ideally on higher volume.
Target: Analyst price target at $7.00, with potential for further extension.
Stop: Below the ascending support line or recent swing low to manage risk.
This setup shows strong momentum and a classic technical pattern. As always, I will wait for confirmation before entering, and will manage risk accordingly. This is not financial advice—please do your own research before trading.

META Platforms Long Setup – Ready for the Next Move?💣 META Masterplan: Bullish Break-In Activated! 💼📈
🌟Hi! Hola! Ola! Bonjour! Hallo!🌟
Dear Money Makers & Silent Strategists, 🤑💰💸✈️
We’ve locked in on our next high-value digital vault: META Platforms Inc.
Built on our signature Thief Trading Style™ — where fundamentals meet stealth technical precision — this is your map to the bullish jackpot.
📍 ENTRY PLAN – Door’s Unlocked!
✅ Enter at any level — this heist is already in motion.
OR
🎯 Set your Buy Limit on a 15m/30m swing low or high — classic pullback infiltration.
🛑 STOP LOSS – Your Exit Route
Before breakout? Hold the line.
After breakout? Drop your SL at the recent 4H swing low – and size it to your risk appetite.
This isn’t luck — it’s calculated theft. 🔐
🎯 TARGET ZONE – Grab & Vanish
🎯 Aim: 770.00
But if the cops (aka sellers) show up early, get out with your loot — no shame in a clean getaway.
“Profit is the win. Perfection is fantasy.”
⚡ SCALPERS' TIPS – Quick In & Out
💵 Big wallet? Enter now.
💳 Tight budget? Follow the swing team.
Either way — longs only, and trailing SL is your safety rope.
📊 WHY META? – Intel Behind the Mission
🔍 This plan is reinforced by:
🔥 Strong Fundamentals
📈 Sentiment Signals
🧠 Quantitative + Macro Flow
💼 COT Data
🌐 Intermarket Correlations
It’s all aligning — the pressure’s building, and the breakout door is creaking open...
🚨 TRADING ALERT – Stay Outta Trouble
💥 Avoid placing new trades during major news drops.
🎯 Use trailing SL to protect and lock profits — your getaway vehicle must be ready.
💖 Support the Heist? Smash Boost!
Fuel the mission — every Boost empowers the crew.
This is Thief Trading Style — we don’t chase, we plan, strike, and vanish with the win. 🏆💪🐱👤
📡 Another breakout mission incoming. Stay hidden. Stay profitable. 🤑🚀

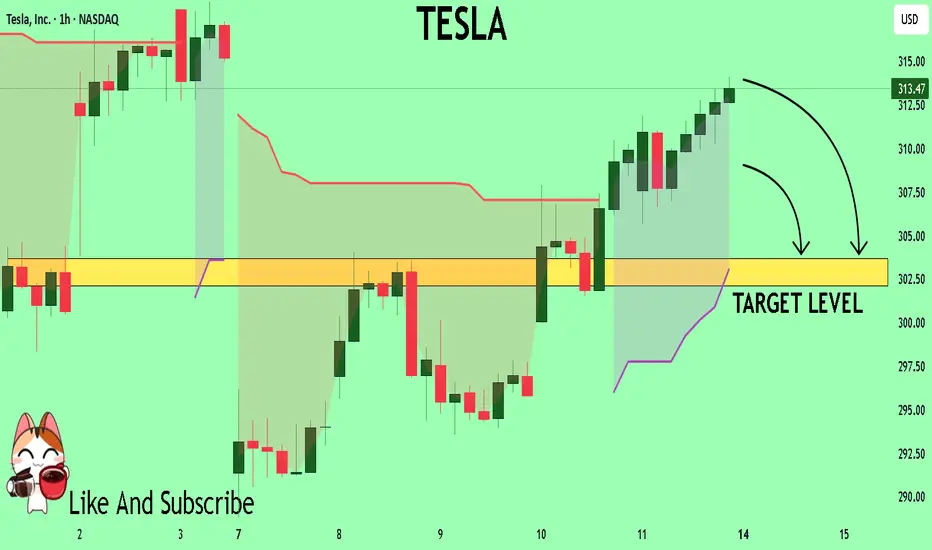
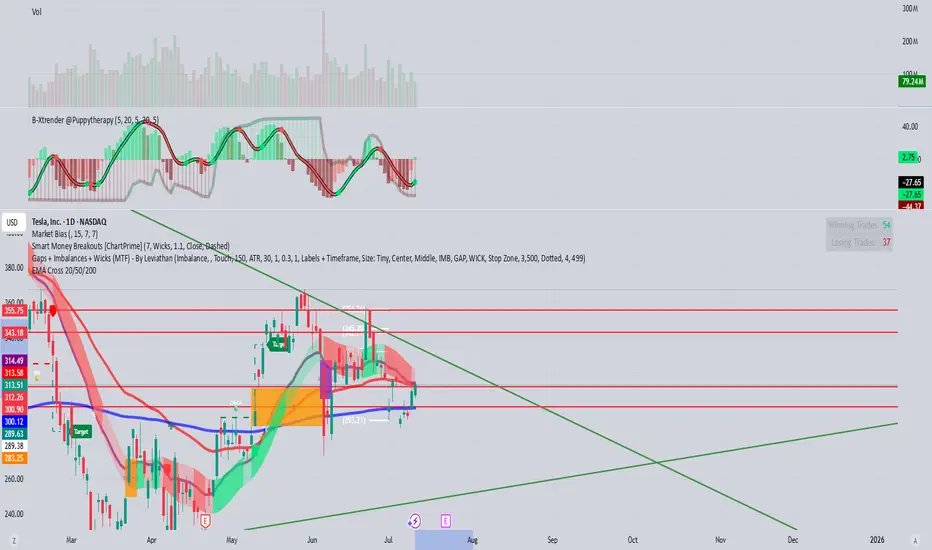
TESLA My Opinion! SELL!
My dear friends,
Please, find my technical outlook for TESLA below:
The price is coiling around a solid key level - 313.47
Bias - Bearish
Technical Indicators: Pivot Points Low anticipates a potential price reversal.
Super trend shows a clear sell, giving a perfect indicators' convergence.
Goal - 303.67
About Used Indicators:
The pivot point itself is simply the average of the high, low and closing prices from the previous trading day.
Disclosure: I am part of Trade Nation's Influencer program and receive a monthly fee for using their TradingView charts in my analysis.
———————————
WISH YOU ALL LUCK
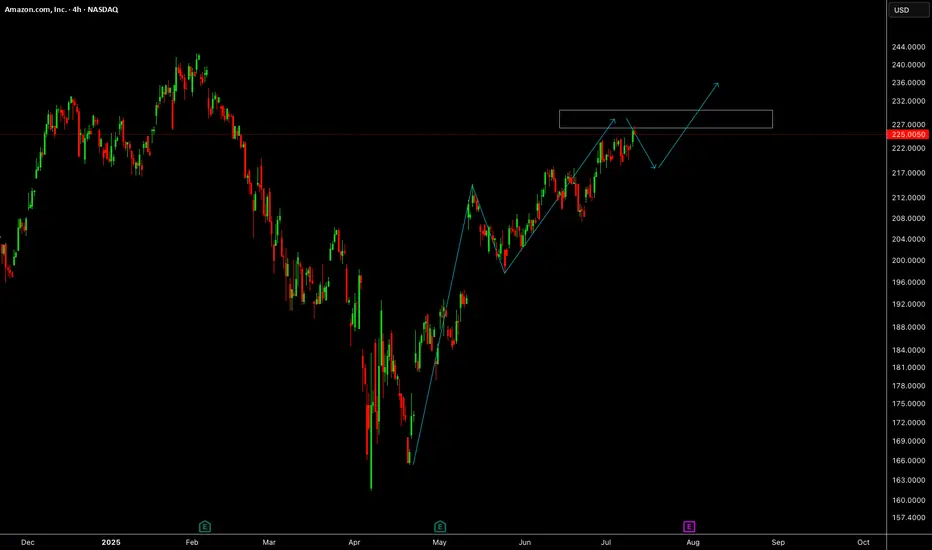
AmazonAmazon needs small correction and further push up towards 235 level.
Disclosure: We are part of Trade Nation's Influencer program and receive a monthly fee for using their TradingView charts in our analysis.
Microsoft from 2000 to 2017 - Ranging Moments - 13/07/2025A lot of patience is required by Investors.
Stakeholders' Trust and good faith are required in company products & services. Also Board of Directors and Company Management play a big role in growing the company.
An amazing point I can notice,
During this period, Steve Ballmer was from 2000 to 2014.
The CEO plays a crucial role in determining the company's hard pocket returns for investors or the highest risk for investors.
After Stever Ballmer left his position, Microsoft did 10X in stock price.
From approx $50 to $500 within the period of 8 years only.
So What made Microsoft in ranging price points for that period?
Innovation?
Bad Choices of Acquisition?
If you have any good points to connect, comment down on this post?
Happy trading.

High Wave Candle on the weeklyWe have a High Wave Candle on the Weekly chart.
The candle is at the support of the upward parallel channel.
The candle is also under the 50 EMA.
The candle is at the vicinity of the 0.618 Fibonacci level.
Bears want to see the close of the next candle below 12.45, then the next price target at 11.82; bears ideally would like to see a complete break of structure to the downside and a candle close below 10.38 for a complete bearish takeover.
Bulls want the structure to maintain intact and a close above the Fibonacci Golden Zone 13.75.

AAPL - Another Possible BreakoutsHello Everyone,
Apple AAPL is the another possible breakouts in my list.
Good entry point could be 205-206 , Re-test point.
228-230 is target price for me , which is approx %10 above from 205-206.
I tried to draw possible price action on Graphs.
Same as I mentioned in GOOG , Apple is Apple and you can get it in every price point for long term.
But short term you can watch the these price points that i mentioned to get some gain.
This is just my thinking and it is not invesment suggestion , please do not make any decision with my anaylsis.
Have a lovely Sunday and good start a Week

GOOG - Possible Break OutHello Everyone,
Happy Sunday to All.
I would like to make a quick Analyse on GOOG. When i was scanning the stocks,i reliazed that this could be a possible breakout and could be a opportunity to buy.
This looks like a breakout and i am expecting to Re-test trend line which price level 175 $.
Then first target is 190-192 which is approx %8 - 10 above from 175.
If it will restest and hit the 175 , this could be good entry point.
If not then first target is 190-192 which is approx %5 above current price level.
Long Term , of course Google is Google no doubt to jump in every price points :)
For me, short term i would wait 175 and put my order to that price , then wait for next moves.
This is just my thinking and it is not invesment suggestion , please do not make any decision with my anaylsis.
Have a lovely Sunday and good start a Week

$Tsla $350 looks promisingNASDAQ:TSLA $350 looks promising in the upcoming weeks.
AMEX:SPY NASDAQ:QQQ NFA
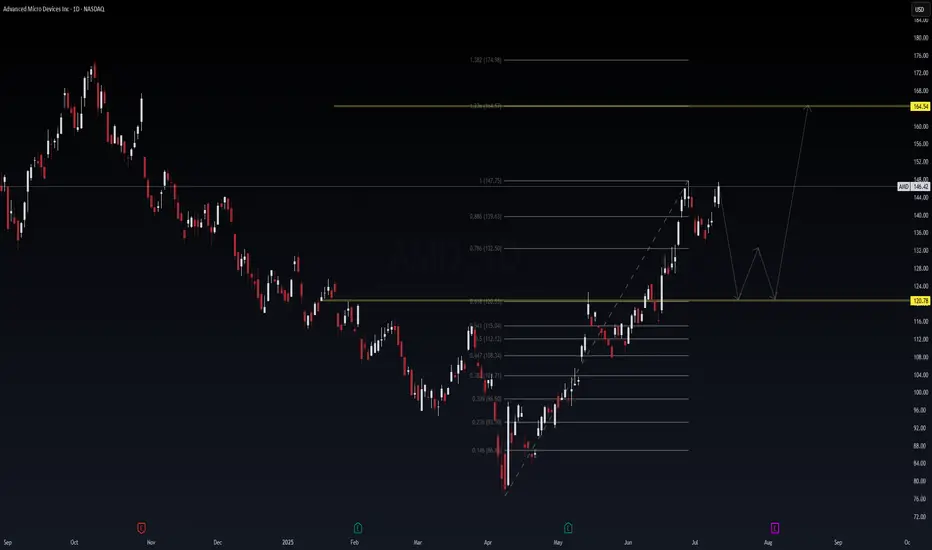
Trading Thesis: Silicon Whiplash – AMD Coiling for a Re-Launch🧠 Trading Thesis: “Silicon Whiplash – AMD Coiling for a Re-Launch to $164+?”
📉 Ticker: NASDAQ:AMD
🗓️ Timeframe: Daily (1D)
📍 Current Price: $144.42
📈 Fibonacci Expansion Target: $164.54 (1.236 extension), $174.98 (1.382 extension)
📉 Support Zone: $120.78
🔭 Play Duration: 2–4 weeks (event-based structure)
🔍 WaverVanir Thesis
Advanced Micro Devices ( NASDAQ:AMD ) is presenting a high-conviction pullback-to-launchpad setup.
After reaching the $147.75 resistance (1.0 Fib extension), AMD has begun carving out a potential W-pattern reaccumulation that could send it to $164.54+. This setup aligns with AI infrastructure momentum and strong GPU/CPU roadmap tailwinds into Q3.
⚡ Catalyst Radar
🚀 MI300 AI GPU Rollout: Recent guidance confirms massive momentum in AMD's data center AI segment, expected to double in Q3. MI300X is gaining traction in the hyperscaler race (vs. NVDA).
💰 AI Arms Race: AMD is aggressively capturing GPU demand in sovereign AI, defense compute, and private AI stack builders (OpenAI, Anthropic, Meta).
📅 Earnings Catalyst: Next report in early August. Expect YoY revenue growth rebound + margin guidance upgrade.
📐 Technical Blueprint
📉 Support Zone: $120.78 (Golden Pocket reversion area)
📊 Pullback Scenario: If price rejects from $147.75 again, a W-pattern retrace to $124–121 would offer a prime long entry.
📈 Upside Targets:
Target 1: $164.54 (1.236 Fib extension)
Target 2: $174.98 (1.382 extension)
🔍 WaverVanir DSS Signal
The DSS signal model confirms:
Smart Money Concepts (SMC) bullish orderblock was reclaimed at $115
Volume profile shows breakout from low-volume node — setting up for a clean sweep to higher liquidity zones
Momentum divergence on RSI and MACD supports the "cool-off before liftoff" thesis
🧠 Strategic Setup
Scenario Trigger Action
Bullish Continuation Break + close above $148 Chase breakout with $155/$165 calls
W Reversion Entry Drop to $124–121 with holding wick Long entry with call spreads into earnings
Bearish Breakdown Close below $118 Wait and reassess — structure invalidated
⚠️ Risk Management: Tighten stops below $117. Risk defined. No long if structure breaks down on high volume.
✅ Summary
AMD’s structure screams accumulation, not distribution. The convergence of technical structure, fundamental catalysts, and AI expansion cycles makes this one of the highest-risk-adjusted setups heading into earnings season. We are watching for pullbacks to enter long toward $164–175.
🧩 #Tags:
#WaverVanir #AMD #Semiconductors #AITrade #MI300 #GPUWar #FibExpansion #TradingThesis #NVDA #OptionsFlow #AIInfrastructure #SmartMoneyConcepts #VolumeProfile #WPattern #NASDAQ100
AAPL - Weekly HV/IV PerspectiveGood evening —
I wanted to do one more write up with that being on NASDAQ:AAPL as we enter the week with futures just opening.
HV10 (16.58%) is trending -11.56% below IV (28.14%) showing a weekly price gap differential of -$2.89 on the stated implied move to what trending markets are doing. This current IV value entering the week sits 69% within the sliding year spectrum.
Now, with Apple consolidating in range for almost eight weeks after selling off when it reached its 4T milestone in December of 2024, has now begun advancing back upwards in price. The strength here is obvious and the quality of company is well, Apple.
My price targets on the week is first the upper band of stated IV ($220.58) then moving on towards the upper implied range of HV63 ($225.87). I believe the markets are going to push apple higher while balancing the indices out selling off in other areas. This would start to accelerate HV10, as it is now 91.23% coiled to its yearly lows and needs to unwind. Hopefully with a few short-term trending days increasing we find our regression.
Please come back next week and see how our position and volatility progressed forward.
