ConAgra Brands | CAG | Long at $19.38ConAgra Brands NYSE:CAG , maker of Marie Callender's, Healthy Choice, Birds Eye, Orville Redenbacher's, Slim Jim, and many more, has seen a continuous drop in share price since the rise of interest rates, inflation, and tariffs. The stock is currently trading near its book value of $18.71 and has a dividend yield of 6.9%. Debt-to-equity is reasonable (0.9x), but the company does have a Quick Ratio of 0.2x (short-term liquidity issues) and a Altman's Z Score (bankruptcy risk) of 1.7, which should ideally be 3+. Like almost every large-scale food company, earnings growth is relatively low, but 2025 is anticipated to be its worst performing year - which explains the price.
While the stock is not likely to generate triple-digit returns in the near-term, NYSE:CAG is a strong company with a nice dividend and some growth ahead. I foresee such stocks getting new life with drops interest rates. However, a dip near $17 (into my "crash" simple moving average area) or even slightly lower is possible - which may likely result in another stock entry.
Thus, at $19.38, NYSE:CAG is in a personal buy-zone with future entries planed near $17 or below.
Targets into 2028
$22.00 (+$13.5%)
$25.00 (+29.0%)

RCAT see you at 11The drone industry, particularly for military and government applications, is experiencing significant growth.
The Pentagon is fast-tracking drone production and deployment, which directly benefits companies like RCAT, ONDS etc

$NVDA - $270 PT in BULL ChannelThe stock is currently bouncing off of the lower channel line of the rising Bull Channel. Price action has created a Cup and Handle. The projected Price Objective sits at around $270. Remember, the height of the cup is the project target which from current stock price extends to around $270.

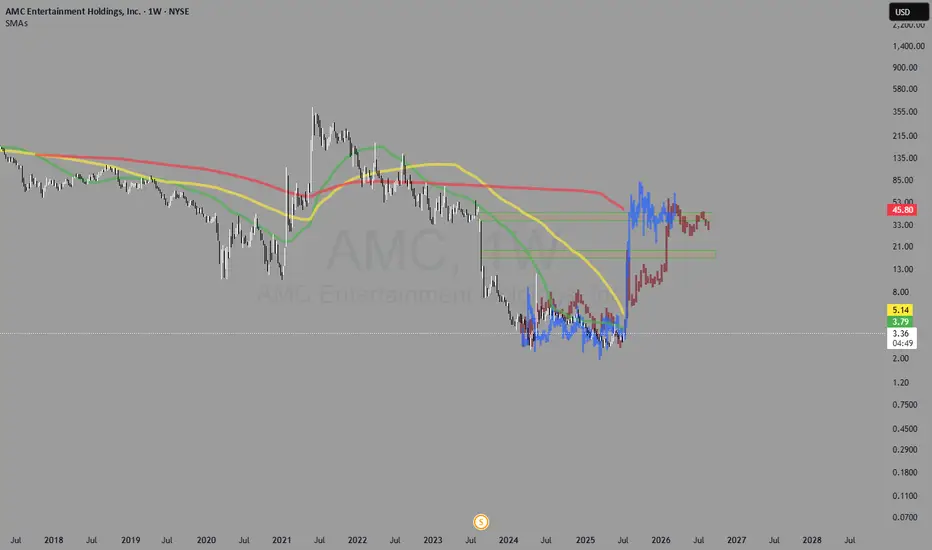
Call your mom. This stock has taught me how to trade. I found it. I bought it for the first time in 2021 and that's how my trading journey began.
Now in July of 2025, I think we might see movement we have been waiting for over the past years.
I remembered a documentary I watched over 15 years ago about a trader making unreal returns (1000s% per year) discussing his strategy. The key points I remember are the deviation from the SMAs. Stocks, that are laggers, kissing/sitting at/over moving averages, especially sitting right above the 100 day moving average for a prolonged period of time (just watch BX:GMES weekly on the 100 SMA;)) and how those stocks see INSANE amount of gains, when they move. I wish I remebered the exact documentary. I see it coming to life in these memes, it seems.
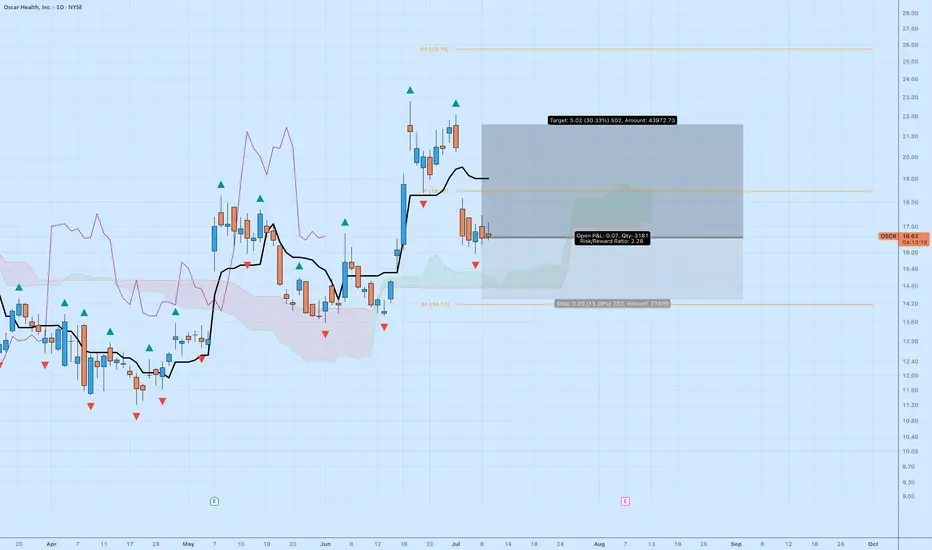
OSCR: Pullback Setup with 30% UpsideOscar Health NYSE:OSCR has pulled back into a logical area of support after a strong breakout in June. While the aggressive move may be over, this trade still offers solid upside with controlled risk.
🔍 Technical Breakdown
Price is basing above the cloud with a clean series of higher lows.
Ichimoku: Trend remains bullish, and price is holding the Kijun-sen.
MACD not shown, but momentum has stabilized after the initial thrust.
🎯 Trade Setup
Entry: ~$16.60
Target: $21.62 (+30.33%)
Stop: $14.40 (–13.29%)
Risk/Reward: 2.28 — attractive given current market conditions
This is a measured continuation setup — not aiming for the moon, just a reasonable trend extension.
META (Meta Platforms Inc.) – Macro Compression Before Expansion META sits at a decisive macro juncture:
A clean SMC structure combined with Fibonacci premium zones signals an imminent directional expansion.
🧠 Macro Thesis:
Price is coiled just under 0.786–0.886 Premium Zone ($729–$760)
↳ This is a known trap area for retail liquidity – institutions often engineer sweeps here.
Volatility compression and volume tapering beneath the “weak high” setup
↳ Perfect conditions for either an engineered breakout raid or a sell-side liquidity hunt.
Fibonacci Expansion Zones:
🟢 Bull case: Clean path to $796 → $870 → $990
🔻 Bear case: Reversion into EQ → discount zones → $676 or $611
🗺️ Trade Structure:
🟢 Scenario A: Expansion Breakout
Entry: $729.50+ (break above weak high)
Target Range: $740.91 → $796 → $870 → $990
Stop: $710.04 (below EQ + EMA confluence)
🔻 Scenario B: Distribution Rejection
Entry: Break below $710
Target: $676 → $647 → $611
Stop: $729.50
📊 Institutional Alignment:
SMC shows liquidity-engineered structure with BOS + CHoCH confirmed
EMA 100/200 still rising → trend remains intact unless $675 fails
🧠 Positioning around EQ and premium zones is key. META is not in a “buy or sell” zone—it's in a smart money trap. Let price decide.
This is chess, not checkers.
📍 Posted by WaverVanir International LLC – Advanced Market Intelligence & AI Governance Engine
#Meta #META NASDAQ:META #SmartMoney #InstitutionalFlow #LiquidityZones #TradingPlan #FibStrategy #MarketCycle #SwingTrading #WaverVanirResearch #AITrading #VolanX #QuantStrategy #CapitalFlow #TradingView

META (Meta Platforms) – Battle at the Premium | WaverVanir Resea🚨 META is coiling at a critical inflection zone.
We're observing textbook Smart Money Concepts (SMC) behavior on both the daily and intraday timeframes:
🧠 Key Observations:
Price is hovering below the Premium Zone (0.786–0.886 Fibonacci: ~$729–$760) – a known liquidity trap.
15M structure shift shows a CHoCH (Change of Character) and BOS (Break of Structure), signaling possible upside.
Volume is tapering near a weak high – suggesting accumulation or engineered liquidity sweep.
⚔️ Scenarios in Play:
🟢 Bullish Breakout:
If META breaks and closes above $729.50 with strength and volume:
Long Trigger: $729.50+
Targets: $740.91 → $796 → $870+
Stop: Below $718 (EQ/EMA cluster)
🔴 Bearish Rejection:
If price rejects premium and breaks below $710:
Short Trigger: <$710
Targets: $676 → $647 → $611
Stop: Above $723
🎯 Strategic Outlook:
META is trapped between buy-side and sell-side liquidity. We’re watching for either a bullish expansion above weak highs or a reversion into discount toward deeper demand zones.
Volume and macro catalysts (e.g., earnings, tech sector rotation) will decide the direction.
📍 Posted by WaverVanir International LLC – Institutional Market Intelligence Engine
#Meta NASDAQ:META #OptionsFlow #SmartMoneyConcepts #TradingStrategy #VolumeProfile #Fibonacci #LiquidityZones #WaverVanirResearch #VolanX #TechStocks #MarketOutlook #InstitutionalTrading #LongOrShort #TradingView #SwingTrade #BreakoutSetup

Tesla - Major Breakout BrewingTesla has been going through the wringer, between Robotaxi news, tariffs and the ongoing feud between the most powerful man in the world (Trump) and the richest man in the world (Elon). No doubt the news has had its fair share of impact on the stock. But Technicals will always hold more weight than news. I'll breakdown a few reasons why I believe this stock is due for a major run to ATHs
As you can see on this 4H chart, a nice falling wedge is forming and PA is respecting it, even with the wild gaps. On top of this being a bullish pattern, TSLA is also in a crucial area of support within the $290s . If you look back to Jun 9th 2025, you can see Tesla bounced from the 281 level to the 330s which is another indicator of strong support. Not to mention, a the 50 MA crossed the 200 MA on the daily on July 1st which is another bullish indication. The wedge looks to bottom out at the 280 level but I don't see this stock going that low. $290, 291 is an optimal entry to go long.
The long term trend line from April 21st 2025 has not been completely invalidated as of yet. If it retests at 310 and falls back within the wedge, I am still bullish. If price falls under $280, I am bearish. But until then, load up because the next stop is $350 after breakout, then $400, then ATHs. I'm expecting the breakout to happen by earnings or potentially before if this unnecessary feud between Trump and Elon ends.
P.S. I didn't get a good entry on this trade but I have a long position due to expire on the 25th.
Good luck trading.
-AceBoogieWitMe

GOOGL Short Term Trading IdeaEntered at $173.55 on 07/08.
Expecting earnings to be reported on 07/23 and beat expectations by a huge margin.

VivoPowerHey,
My chart getting a little more developed. By using the Volume Profile and OBV, I've identified my "Volume Box". It tells me a lot about the history of the chart, and when the action happened. This chart has approached the bottom of the bullish fibonacci channel, and what happened? Stacked candles on longer timeframes, and a ramp up in the On Balance Volume. I don't like to see a volume profile shelf below. I prefer to see a nice, round bell curve in the VPVR, before the prices moves either up or down to its next price range. But, in this case, we're at the bottom of the fib channel with stacked candles indicating reversal, and we have a descending overhead , which is what has pushed us to the bottom of the fib channel, and upon clearing that descending overhead, the price is looking for relief. Ripple can pump. You know the story. It's "Ripple" in my brokerage account. The potential of this ticker is within the bullish fib channel ahead, and a good general rule of thumb, in stocks, is to look to the .618 as the target. That's just the first page of the complete fib theory that I've developed. But it gives you a taster. Each fib level provides its own guidance, so it's guru-free.

Alphabet - The textbook break and retest!📧Alphabet ( NASDAQ:GOOGL ) will head much higher:
🔎Analysis summary:
If we look at the chart of Alphabet we can basically only see green lines. And despite the recent correction of about -30%, Alphabet remains in a very bullish market. Looking at the recent all time high break and retest, there is a chance that we will see new all time highs soon.
📝Levels to watch:
$200
🙏🏻#LONGTERMVISION
Philip - Swing Trader

Oscar Health Bullish Continuation Oscar Health has broken out of a long descending wedge and is now resuming its broader bullish channel trend. With volume surging and smart money signals appearing near key supports, the chart targets a 94% measured move to $26.76, with the possibility of continuation toward $50.00 if trend strength persists.
A strong bullish structure remains valid as long as price stays above $13.68.

PANW: Following a Rhythmic Path Within a Clear TrendWhat we're looking at on this weekly chart for PANW is a very clear and structured uptrend, essentially a roadmap for the stock's price. The entire movement is contained within a well-defined ascending channel, which is broken down into three key zones:
The Lower Green Band (around 150): This is the "Strong Support" or the ultimate buy zone. Historically, whenever the price has pulled back to this level, buyers have stepped in aggressively, marking a significant bottom.
The Upper Red Band (around 210): This is the "Strong Resistance" or the primary sell zone. When the price gets up here, it tends to run out of steam, and sellers take control, pushing the price back down.
The Middle Grey Band (around 180): This acts as the market's centerline or "1st support." It's a pivot area that the price frequently interacts with.
The most interesting feature highlighted here is the cyclical or rhythmic pattern of the price action, marked by the red ovals. The chart shows a recurring theme: the stock rallies toward the upper red resistance, gets rejected, and then experiences a sharp, multi-week pullback.
Putting it all together:
The chart suggests that PANW is currently in the middle of one of these pullback phases after being rejected from the upper part of its channel. The analyst has laid out a potential scenario based on this historical rhythm:
The price may continue its descent, potentially breaking the 180 1st support level.
The ultimate target for this pullback would be the 150 Strong Support zone, where the stock has historically found its footing.
From there, the pattern would suggest a new rally could begin, with an initial target back up towards the 196 Key resistance area.
In short, while the long-term trend is up, the chart implies the current correction may have more room to run before the next major buying opportunity presents itself around the 150 level.
Disclaimer:
The information provided in this chart is for educational and informational purposes only and should not be considered as investment advice. Trading and investing involve substantial risk and are not suitable for every investor. You should carefully consider your financial situation and consult with a financial advisor before making any investment decisions. The creator of this chart does not guarantee any specific outcome or profit and is not responsible for any losses incurred as a result of using this information. Past performance is not indicative of future results. Use this information at your own risk. This chart has been created for my own improvement in Trading and Investment Analysis. Please do your own analysis before any investments.

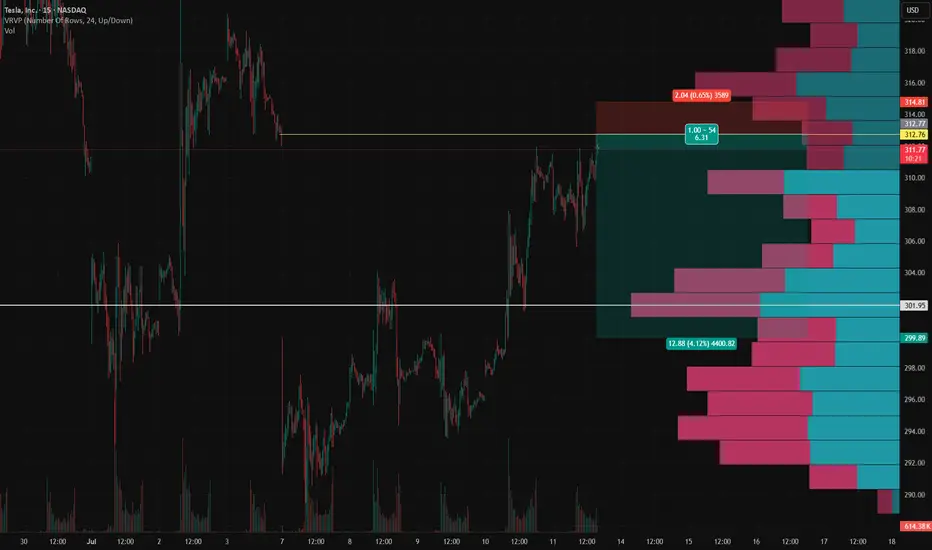
TSLA Short Setup – Fading the July 7 Gap FillTSLA Short Setup – Fading the July 7 Gap Fill 📉
This short idea on TSLA builds off a key gap fill from Monday, July 7 , combined with a strong local volume profile and risk-reward alignment on the 15-minute chart.
Entry: $312.76
Stop Loss: $314.81 (above gap resistance and local high)
Target: $299.89 (gap base and volume shelf)
RR: ~6.3R
Why I'm shorting here:
TSLA has just filled the July 7 gap , which often acts as a technical resistance zone on retest.
Price stalled right as it completed the fill — with visible hesitation and selling pressure stepping in.
VRVP shows low liquidity above, suggesting diminished reward for upside continuation.
Below, there's a clean volume shelf around $294–$300 that could attract price if weakness confirms.
Trade Logic:
This is a classic fade-the-gap-fill setup, targeting the lower edge of the volume cluster for a potential bounce or reversal zone.
As always: size accordingly, stick to the stop, and don’t chase if the entry’s already gone.
Thoughts? Anyone else watching this gap level?
ADSK at a Pivotal Juncture: Bulls Defend the 270 Support ZoneThe most dominant feature here is the well-defined ascending channel that has been guiding the price since the lows of mid-2022. This structure suggests a controlled, systematic uptrend.
The lower boundary of this channel has consistently acted as a floor, where buyers have stepped in with confidence. Conversely, the upper boundary has served as a ceiling, where sellers have taken profits. The width and consistency of this channel indicate a balanced, yet bullish, long-term sentiment.
Now, let's layer in the horizontal zones, which are critical areas of "price memory."
The 230 level is a classic example of a resistance-turned-support flip. For over a year, from late 2022 through 2023, this area acted as a major ceiling. You can see the price repeatedly tried and failed to break through. Once it finally cleared that level in early 2024, it became a new floor, which was successfully tested as support around mid-2024. This is a significant technical event that confirms a shift in market structure.
The 270 level is the next major battleground. This zone was a key support area back in 2021 before the major downtrend. More recently, it acted as a point of resistance on the way up. The price is currently trading just above this 270 zone.
Putting it all together:
The current price action shows ADSK holding above the critical 270 support level, which is constructive for the bulls. However, it has recently pulled back after testing the upper half of the ascending channel.
In essence, the chart presents a tug-of-war. The long-term trend, as defined by the channel, remains upward. The price is currently situated above a key horizontal support at 270, but it is also showing some exhaustion after failing to push toward the top of the channel. The immediate test will be whether buyers can defend this 270 area as a new base of support for the next leg higher.
Disclaimer:
The information provided in this chart is for educational and informational purposes only and should not be considered as investment advice. Trading and investing involve substantial risk and are not suitable for every investor. You should carefully consider your financial situation and consult with a financial advisor before making any investment decisions. The creator of this chart does not guarantee any specific outcome or profit and is not responsible for any losses incurred as a result of using this information. Past performance is not indicative of future results. Use this information at your own risk. This chart has been created for my own improvement in Trading and Investment Analysis. Please do your own analysis before any investments.

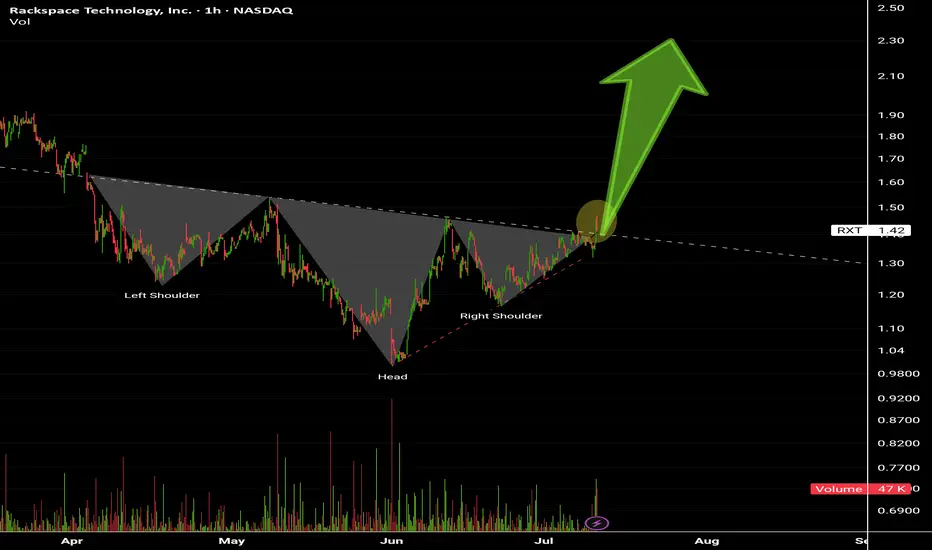
Rackspace Technology inc Inverted Head and Shoulders pattern.
Breaking 1.42$ Today.
Target price above 2.2$ .
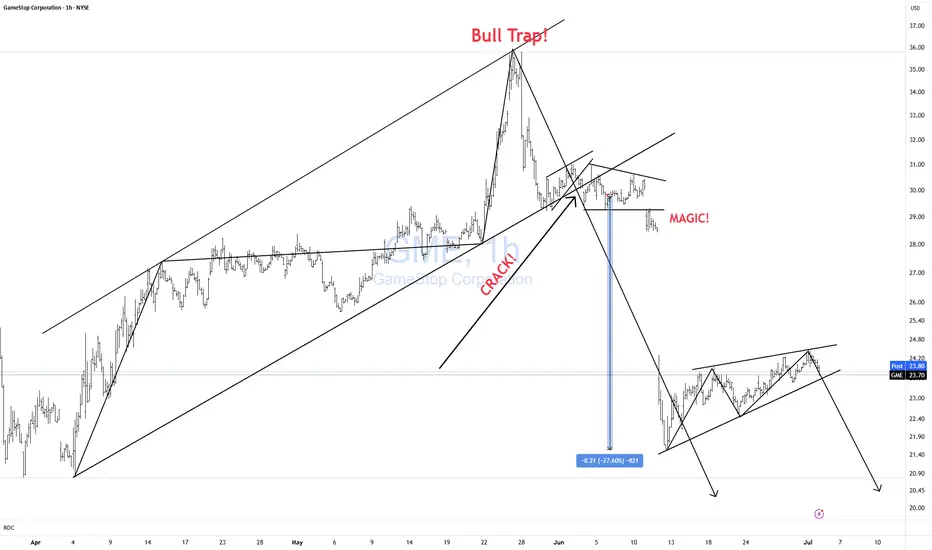
GME CRACK?Unfortunately, I keep getting forced to create new posts for the same Isea bc TV forces me to "target reached" on updates. Here is my previous post.
We have yet another bearish formation setting up in GME. Rising bearish wedge.
Wait for the CRACK!
Click Boost, like, follow, and subscribe for more!
AAPL BUY 1st target $223AAPL is forming a wedge and been lagging for 2 years. I was expecting $182 but we never saw that level, after weeks of $200 range consolidation it's clear this is basing, first target of resistance is $223 then we could be off to the races. I would expect to see this as soon as next week provided #donthecon can stop bullying American companies long enough to focus on important things

NFLX CRACK!!Classic breakdown move from a rising F flag!
Massive Head and shoulders formed, that head test followed through, taking out stops, and now failing off the top of the channel.
Screaming CAUTION to the bulls!
Nice simple short setup for bears.
Click boost, follow, and subscribe. Let's get to 5,000 followers. ))

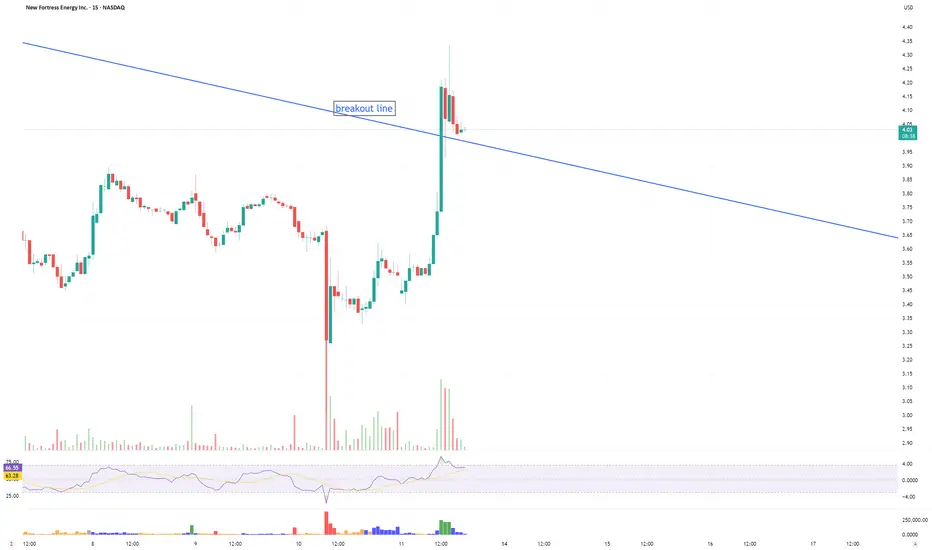
$NFE will Fast LNG have a breakout?Corruption and little fiefdoms plague NFE's progress in Puerto Rico. Even with a great bounce today, NFE needs to hold above this 'breakout line' to have a chance to regain its former shareholder glory. Will it do so? Will the CEO ever grab a gain when he bought at $8.77?
AMTX piece de resistanceAMTX hit resistance and was rejected 7/9. Aemetis will power through this, timeframe tbd.
But with another ATM sale on the horizon, this great concept circular biofuel economy will be a slog for shareholders.

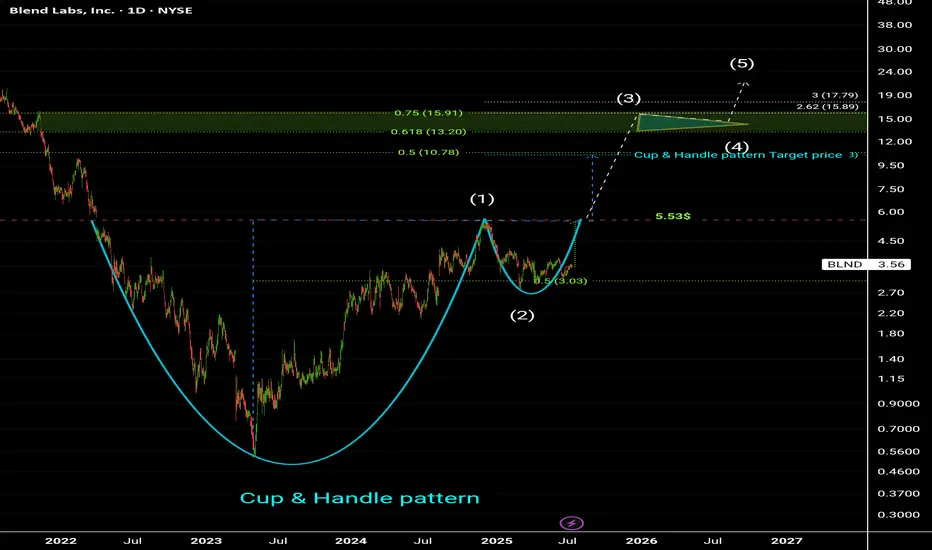
Blend labs inc (BLND).Cup and Handle pattern at the bottom
Target prices on chart.
Highly recommended for Buying now 👌
AMD 150 Target NASDAQ:AMD is setting up nicely — could push toward $150 by next week.
Break above $153 opens the door for a daily gap fill move. Watching closely. 🔥📈
