ASTS massive daily bull flagWith the cult like following on this ticker, a 4H break out and hold of this bull flag to the upside could see massive retail money piling in to send the price back to $54 ATH. RSI is also showing potential bullish confluence. The 4H chart has daily EMAs overlayed. The price is currently sitting above the daily 7EMA. Breakout above ATH and it's clear blue skies with no resistance. Huge potential.

GOOGL Ready to Recharge or Break? TA for July 16📊 GEX Sentiment & Options Outlook (Based on July 15 Data)
* Key Resistance Zone:
‣ 184–185: Highest Positive NET GEX, 3rd Call Wall → Strong gamma resistance
‣ 190–192.5: Additional call wall cluster—unlikely to break without strong momentum
‣ 195: GEX10 level (top bullish magnet if a breakout triggers)
* Support Zone:
‣ 180: Minor call wall, near current price
‣ 177.5: HVL zone for July 18 expiration — gamma cushion
‣ 172.5 / 167.5: Key PUT walls — heavy gamma support
* GEX Bias:
→ Neutral-to-Bullish skew with 43.11% Call Wall support near 180, and strong upward pressure up to 185 if price stays above 180.
* Options Sentiment:
* IVR: 38.8 (moderate)
* Calls Dominance: 27% of total options flow
* Bias: Bullish if price remains above 180 base; bearish break under 177.5 may open path to PUT zones.
📈 1-Hour Chart Smart Money Price Action (SMC-Based Analysis)
* Market Structure:
* Strong BOS (Break of Structure) confirms trend
* Minor CHoCH pullback near 180–182 zone showing healthy consolidation
* Holding mid-channel support trendline
* Key Zones:
* Purple Supply Zone at 182.5–183.5 — expect reactions
* Demand Zone near 174.5–172.5 — major support and rebuy area
* Trendline Support: Still intact, price respecting channel so far
* Trade Scenarios:
🔹 Bullish Setup:
* Entry: Break and hold above 183
* Target: 185 → 187.5
* Stop: Below 180
* 🔻 Bearish Setup:
* Entry: Loss of 180 and breakdown under 177.5
* Target: 174.5 → 172
* Stop: Above 182.5
* Bias: Consolidating, leaning bullish if it defends trendline and clears purple supply. Look for a reclaim of 183 with volume for next leg.
🎯 Final Thoughts
If GOOGL holds above 180, there's potential for a gamma squeeze into 185–187.5. However, a break below 177.5 flips sentiment short, targeting the demand zone around 174–172. Wait for structure confirmation before chasing.
This analysis is for educational purposes only and does not constitute financial advice. Always do your own research and manage your risk before trading.

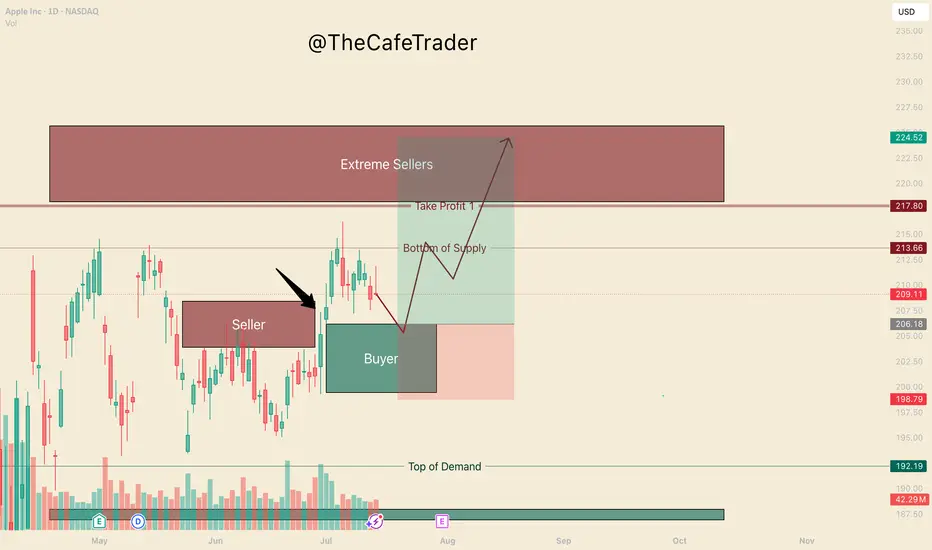
APPL. Bulls are in ControlHello, I’m TheCafeTrader.
This post is for technical traders looking to capitalize on short swings and options.
What you’re seeing here are supply and demand zones — areas where liquidity is concentrated. These levels are identified using a system built around footprint data, order flow, and market imbalances.
🔹 Key Observation:
I’ve marked a seller that price has now broken above. This tells us that buyers have overpowered a sell-side participant, and are now likely targeting deeper liquidity in the $218–$225 range.
🔹 On Apple’s Behavior:
Apple can be slow and choppy at times. So, if you’re trading options, consider going as close to the money as possible and give yourself some time on the contracts.
🔹 New Buyer in the Market:
Between $199–$206, a new aggressive buyer has stepped in. This player appears to be pressuring the first line of sellers (labeled “beginning of supply”).
🟢 My Expectation:
I expect AAPL to pull back to around $206 before catching a bid. As long as price holds above $199, buyers remain in control. In this range, I anticipate further accumulation by bulls.
🔸 Take Profit Levels:
• First TP: Just before the major selling cluster around $218
• Final TP: Deep inside the seller zone near $223
⸻
📊 Follow for more short-term analysis. This week, we’re covering both short- and long-term views of the MAG 7.
⸻
MASTERCARD Best buy entry now. Target $625.Mastercard (MA) has been trading within almost a 3-year Channel Up that only broke (but recovered naturally) during Trump's trade war. Still, the 1W MA100 (green trend-line) contained the downfall, as it always had.
Normally the Bearish Legs of this pattern tend to find Support on the 1W MA50 (blue trend-line), as the latest one did 3 weeks ago. Now that the price is trading still on the 0.382 Fibonacci retracement level, it historically is the best buy opportunity, as per all previous Bullish Legs.
The Channel Up has always priced its Higher High (top) on at least the -0.236 Fibonacci extension. As a result, we are targeting $625.00 before the year ends.
-------------------------------------------------------------------------------
** Please LIKE 👍, FOLLOW ✅, SHARE 🙌 and COMMENT ✍ if you enjoy this idea! Also share your ideas and charts in the comments section below! This is best way to keep it relevant, support us, keep the content here free and allow the idea to reach as many people as possible. **
-------------------------------------------------------------------------------
💸💸💸💸💸💸
👇 👇 👇 👇 👇 👇

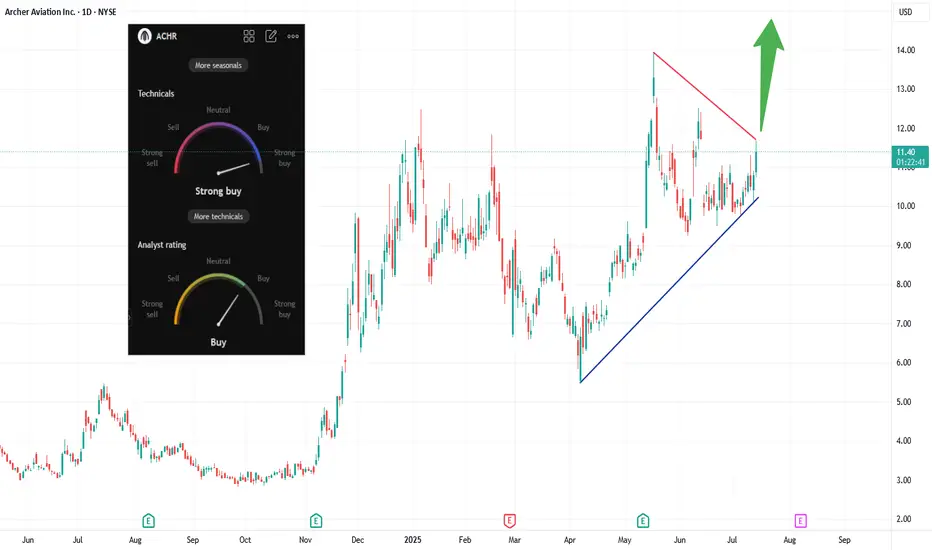
ACHR Eyes Breakout: eVTOL Sector Surges on Regulatory Tailwinds The eVTOL space is lighting up today, ACHR included. Shares have rallied ~7%, tapping into a bullish breakout off its ascending triangle and challenging its descending resistance (see chart). Analyst ratings lean strong‑buy, and technicals support further gains.
📈 Why the excitement?
A Trump executive order is fast‑tracking drone and air taxi regulations, boosting investor confidence across the sector.
Archer recently secured ~$850M in funding to accelerate U.S. rollout — fortifying its balance sheet and manufacturing plans.
The company is part of a new global alliance aiming to streamline eVTOL certification, joining forces with the FAA and five countries.
🚁 What’s next?
If ACHR breaks the red trendline resistance near ~$12, we could see a sharp move toward $14+ (green arrow on chart) as momentum builds. Watch closely for strong volume on the breakout — it could offer a clean entry.
Bottom line:
eVTOL is flying high today, and Archer stands poised to lead the charge. A breakout here could spark a fast move — keep it on your watchlist.
Best Buy’s Lower HighsBest Buy fell sharply on “Liberation Day.” Now, after a modest rebound, some traders may see further downside risk.
The first pattern on today’s chart is July 10’s peak of $74.75. That was below the June high, which in turn was under May’s high. Such a succession of lower highs could indicate a bearish trend.
The potential topping behavior is also happening below the close on April 2, immediately before President Trump announced aggressive tariffs.
Third, prices are stalling near the 50- and 100-day simple moving averages. That may reflect a bearish long-term trend.
Finally, the retailer has returned below its 8- and 21-day exponential moving averages. That may suggest short-term trends have gotten more bearish as well.
TradeStation has, for decades, advanced the trading industry, providing access to stocks, options and futures. If you're born to trade, we could be for you. See our Overview for more.
Past performance, whether actual or indicated by historical tests of strategies, is no guarantee of future performance or success. There is a possibility that you may sustain a loss equal to or greater than your entire investment regardless of which asset class you trade (equities, options or futures); therefore, you should not invest or risk money that you cannot afford to lose. Online trading is not suitable for all investors. View the document titled Characteristics and Risks of Standardized Options at www.TradeStation.com . Before trading any asset class, customers must read the relevant risk disclosure statements on www.TradeStation.com . System access and trade placement and execution may be delayed or fail due to market volatility and volume, quote delays, system and software errors, Internet traffic, outages and other factors.
Securities and futures trading is offered to self-directed customers by TradeStation Securities, Inc., a broker-dealer registered with the Securities and Exchange Commission and a futures commission merchant licensed with the Commodity Futures Trading Commission). TradeStation Securities is a member of the Financial Industry Regulatory Authority, the National Futures Association, and a number of exchanges.
TradeStation Securities, Inc. and TradeStation Technologies, Inc. are each wholly owned subsidiaries of TradeStation Group, Inc., both operating, and providing products and services, under the TradeStation brand and trademark. When applying for, or purchasing, accounts, subscriptions, products and services, it is important that you know which company you will be dealing with. Visit www.TradeStation.com for further important information explaining what this means.

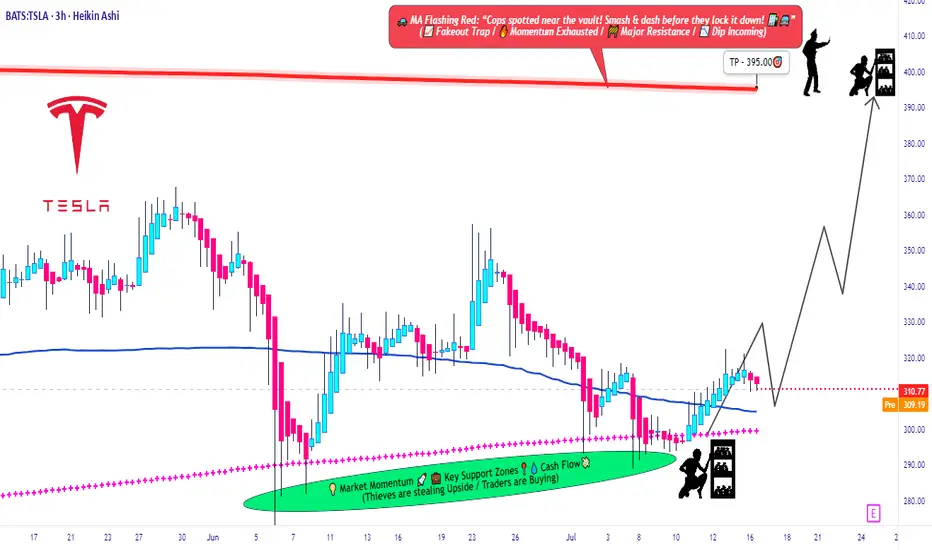
Tesla -> The all time high breakout!🚗Tesla ( NASDAQ:TSLA ) prepares a major breakout:
🔎Analysis summary:
Not long ago Tesla perfectly retested the major support trendline of the ascending triangle pattern. So far we witnessed a nice rejection of about +50%, following the overall uptrend. There is actually a quite high chance that Tesla will eventually create a new all time high breakout.
📝Levels to watch:
$400
🙏🏻#LONGTERMVISION
Philip - Swing Trader

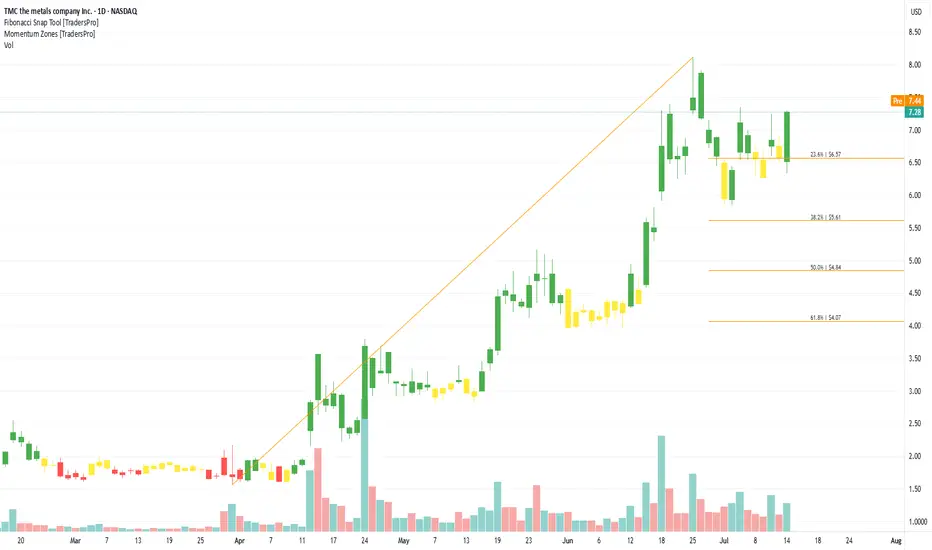
TMC the metals company Inc. (TMC) Mines Ocean NodulesTMC the metals company Inc. (TMC) is developing deep-sea mining solutions to source key battery metals like nickel, cobalt, copper, and manganese from polymetallic nodules found on the ocean floor. These metals are critical for electric vehicles and clean energy storage. TMC’s growth is driven by the rising demand for sustainable battery materials, global EV adoption, and the need to diversify away from traditional, land-based mining operations.
On the chart, a confirmation bar with increasing volume shows strong momentum. The price has entered the momentum zone by breaking above the .236 Fibonacci level. Traders can use the Fibonacci snap tool to set a trailing stop just below that level to protect gains while allowing for additional upside potential.
RGTI Heading to $17+ Good evening trading family
So currently due to price action it appears we are on our way to 17 dollar target however we expect a little bit of a correction at the 15 range.
However worst scenario if we go below 11 dollars be prepared for a sinker down to 8.
Trade Smarter Live Better
Kris/ Mindbloome Exchange

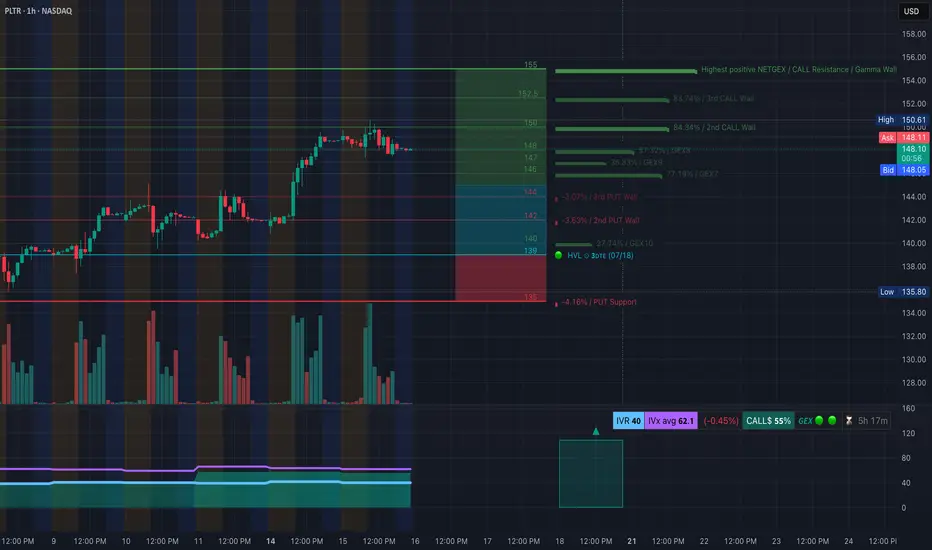
PLTR Sitting on the Edge! Will $147 Hold or Break? July 16Technical Overview:
PLTR is showing signs of a distribution top after a strong rally. The most recent 1H structure shows a Change of Character (CHoCH) just under $149 with lower highs forming and weak bullish reaction.
* CHoCH confirmed under $148.50
* Price struggling inside supply zone: $148.50–$150
* Ascending trendline now broken — possible bearish drift starting
GEX + Options Flow Analysis:
* GEX Resistance Zones:
* $150.00 (83.74% / 3rd Call Wall)
* $152.5 and $155 stacked with heavy GEX Call Resistance
* PUT Walls:
* $144 (3.07%)
* $142 (3.63%)
* Gamma Pivot: $139 = HVL + GEX10 zone
* IVR at 40, with IVx Avg 62.1 → Options relatively quiet, but favoring downside protection
* Call Bias = 55%, but weak
SMC + Price Action:
* BOS followed by CHoCH just beneath $149.15
* Price rejecting inside the OB zone from $148.50–$149.50
* Break of bullish trendline confirms bearish momentum shift
* Downward channel forming under the broken trendline
Trade Scenarios:
📉 Bearish Setup (Favored):
* Entry: $148.20–$148.50 (into supply zone)
* Target 1: $144.50
* Target 2: $139 (HVL + GEX10 support)
* Stop: $150.20
📈 Bullish Breakout (Needs Strength):
* Must break and close above $150
* Entry: Break and retest of $150.50
* Target: $152.5 → $155
* Stop: $148.20
Final Thoughts:
PLTR looks tired near the top of its rally. With GEX resistance above and CHoCH confirmed, the odds favor a pullback unless bulls can reclaim $150 with strength. Watch $147–$144 for possible bounce or breakdown.
This is not financial advice. Please trade based on your own plan and always use proper risk management.
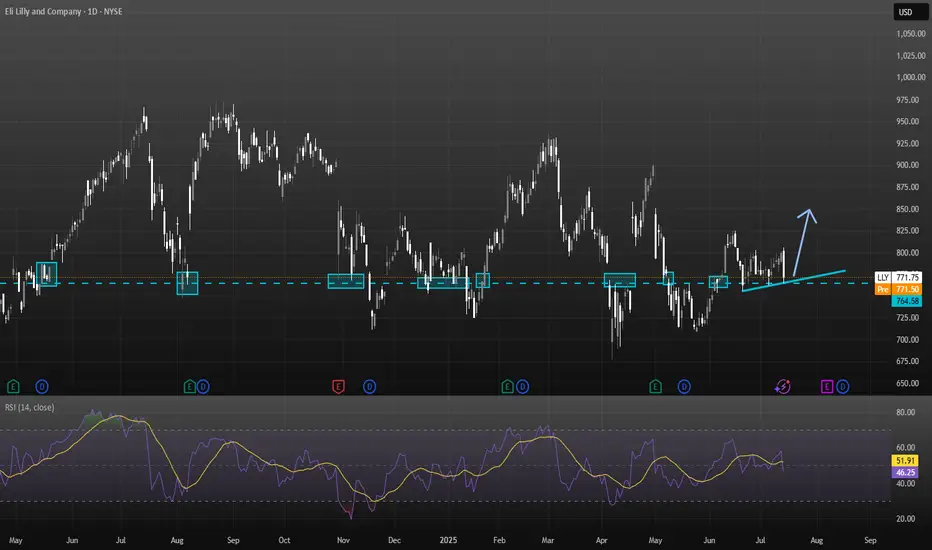
Eli Lilly (LLY) – Full Technical + Fundamental Analysis (July 20
I wanted to take a deeper dive into LLY and analyze more than just trendlines—looking into both the technical structure and the broader fundamentals of the stock.
Sources: i have a list of sources at the end of my report
Technical Breakdown:
Current Price: ~$771.75
Resistance Zone: $950–970 prior rejection levels
Support Zone:
Strong: $760–765 (multiple historical rejections and rebounds).
Secondary: $717 (previous bounce area).
Trendline: Steadily rising higher-lows, supporting price above $760.
RSI: Recently cooled from 79 (overbought) to ~51 (neutral), suggesting balanced conditions. No immediate overbought or oversold signals.
Chart Pattern Summary:
Price respects a higher-low ascending trendline.
Buyers defend $760, but $800+ remains heavy resistance.
Breakdown below $760 risks a drop to ~$717.
Breakout above $800 opens upside toward $950–970.
Growth Catalysts:
1. Zepbound & Mounjaro dominate the obesity/diabetes sector.
2. Retatrutide & Orforglipron (next-gen obesity treatments) could further expand market share by 2026.
3. Revenue growth: ~45% YoY in Q4 2024.
4. Analysts forecast ~15% annual revenue growth and 20%+ EPS CAGR through 2027.
Risks:
1. Q1 2025 saw adjusted EPS guidance trimmed to ~$20.78–22.28 from previous ~$22.50–24, causing ~7% drop in stock .
2. Valuation rich: forward P/E ~35 vs peers like Novo at ~14
3. 025 EPS estimates have slightly fallen (from $22.20 to $21.94) while 2026 expectations rose.
4. New rival Hengrui/Kailera shows ~18–19% weight loss, close to Zepbound’s ~21%, though still pre-approval
5. Regulatory volatility: Trump has floated heavy pharma tariffs (up to 200%) and repatriation incentives; Lilly has U.S. capacity but details remain uncertain
Analyst Sentiment:
Consensus target: $1,000+ within 12–24 months.
MarketBeat & StockAnalysis rate LLY as Strong Buy.
Institutional ownership remains high.
What to Monitor Next
1. FDA approvals for orforglipron or retatrutide (expected late 2025).
2. Next earnings—watch for forward guidance recovery.
3. Policy shifts (potential tariffs on pharma imports).
4. Obesity drug competition (Novo Nordisk, Chinese biosimilars).
Final Position: Modest Long Bias
Eli Lilly is technically holding trendline support while fundamentally leading in a booming therapeutic sector. Together, this makes LLY a long-term buy, though caution near $760 is warranted.
I tried to summaries as short as possible as i didn't want to make this post into an essay
Please note this is not financial advice
Sources Used for Analysis:
1. Eli Lilly Company Filings & Reports
2. Latest Earnings Reports (Q1 2025, prior Q4 2024)
3. Pipeline Updates and FDA Submission News
4. MarketBeat (Analyst ratings & price targets)
5. Yahoo Finance (EPS estimates, revenue growth forecasts)
6. StockAnalysis.com (Valuation ratios, dividend data)
7. Bloomberg and CNBC (News on guidance revisions)
8. Federal Reserve statements and forecasts
9. Bureau of Labor Statistics (BLS) – healthcare inflation data
10. WSJ and Financial Times – reporting on pharma tariffs and global healthcare policy shifts
11. Industry and Sector Insights
12. Novo Nordisk Investor Updates – competitor tracking
13. Statista – Obesity/diabetes global prevalence reports
14. World Health Organization (WHO) reports
15. Standard RSI and trendline patterns (based on TradingView style)
16. Support/resistance zones derived from historical price action Market Sentiment Tools
17. CNN Fear & Greed Index
18. S&P 500 Health Care Sector ETF (XLV) trends
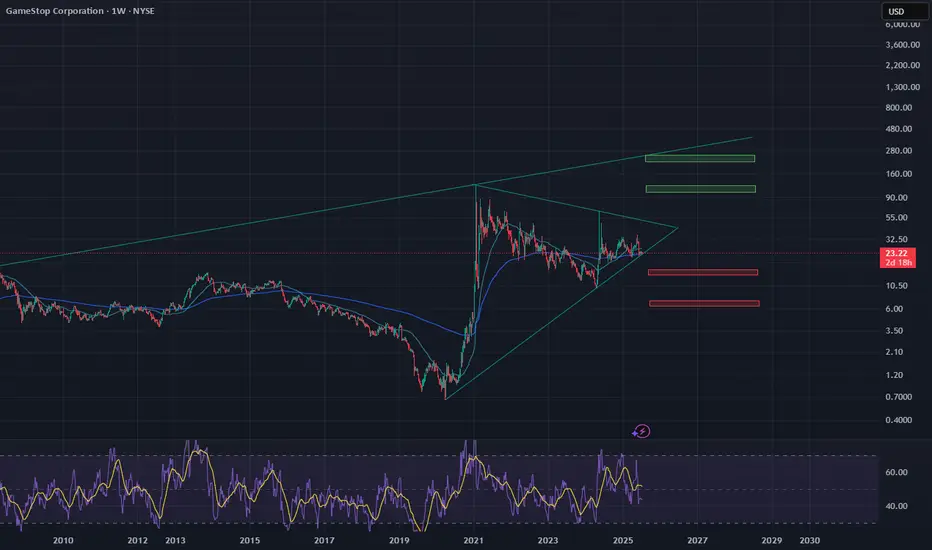
GME is ready to decide (weekly candles)I'm bullish because the market is bullish
Reasons for being Bullish
-above 200sma weekly and have held it as support
-200sma day crossed above 200sma weekly
-everyone knows about the stock, momentum could be something never seen before because of the notion of becoming rich in a day. Treating this as a casino.
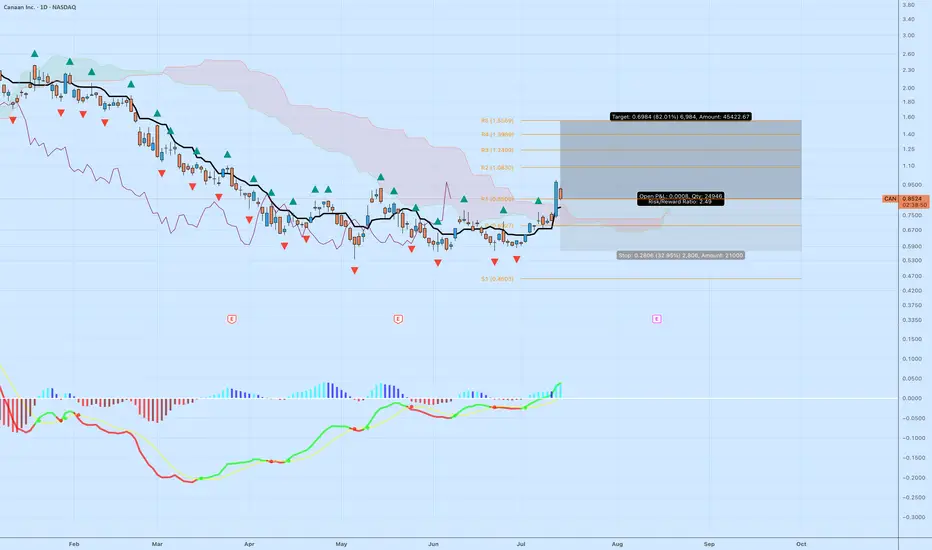
CAN Long: Bullish Reversal Setup with Upside Potential to 1.55Canaan Inc. ( NASDAQ:CAN ), a key player in Bitcoin mining hardware, has endured a steep downtrend throughout 2025, sliding from peaks near 3.50 down to recent troughs around 0.80 amid crypto sector headwinds. However, the chart is flashing signs of exhaustion and a potential bullish reversal, with price stabilizing and momentum indicators turning positive.
Technical Analysis:
Price Action and Structure: After a series of lower highs and lows, the stock has bounced from support near 0.80, with the latest close at 0.8503 showing buyer interest. Price is pushing against a descending trendline (red down-arrows) and exiting a consolidation cloud (likely Ichimoku Kumo, shaded purple), which could transition from resistance to support on a sustained breakout.
Key Levels:
Support: Immediate floor at recent lows (~0.80), with deeper support at S1 (0.4603) if selling resumes.
Resistances: Layered overhead including R1 (1.0666), R2 (1.0830), R3 (1.2409), R4 (1.3969), and R5 (1.5669). Targeting the higher end near 1.55 aligns with extension toward R5 for a stronger move.
Indicators:
The lower panel oscillator (resembling MACD with red/green bars and lines in red, green, yellow) displays a bullish crossover: green line above red, histogram shifting from red (bearish) to blue/green (bullish). This suggests momentum divergence and potential for upside continuation.
Volume spikes on recent upticks reinforce buying pressure.
Trade Setup:
Entry: Enter long at current levels around 0.85, or wait for a close above cloud resistance (~0.90) for confirmation.
Target: Take profit at 1.55 (near R5 confluence), offering approximately 82% upside from entry based on chart projections and historical patterns.
Stop Loss: Place below key support at 0.57 to account for volatility, providing room for minor pullbacks while protecting capital.
Risk/Reward Ratio: About 2.5:1 (reward of 0.70 vs. risk of 0.28 per share), a solid setup for the potential reversal in this high-volatility stock. Size positions to risk 1-2% of total capital max.
Invalidation: Exit if price breaks decisively below 0.57, signaling downtrend resumption toward lower supports.
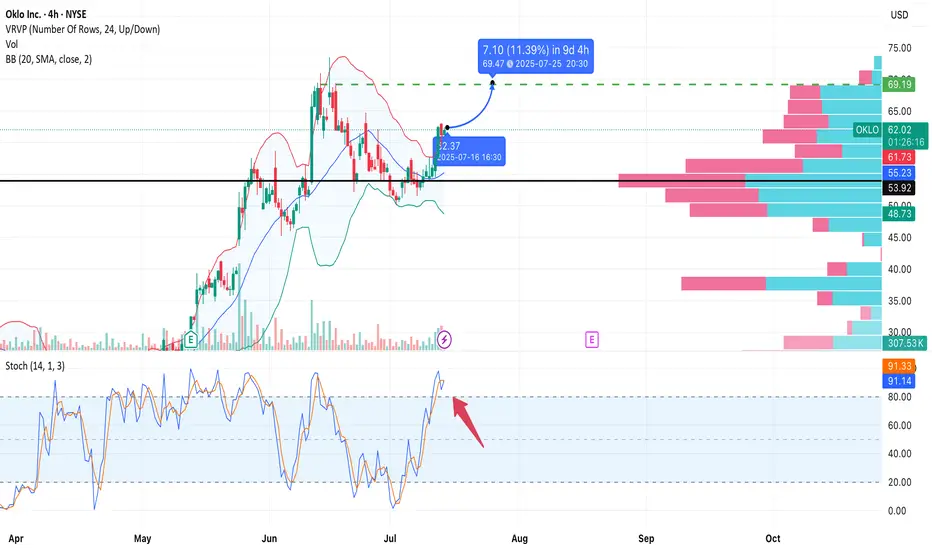
OKLO – Upside Potential Ahead of EarningsNYSE:OKLO
Type: Swing/positional
Timeframe: 4H
Style: No stop-loss, technically driven
Target: 69.50
Risk: Moderate (earnings volatility risk)
Overview:
Oklo is forming a bullish continuation pattern after consolidating above the 55.00 support area.
The price has broken above the Bollinger Band basis and reclaimed the 61.78 resistance zone.
Stochastic shows overbought conditions, but the trend remains strong.
The volume profile reveals a low-resistance zone up to ~69.50, offering clean air for upward momentum.
Entry Zone:
• Entry near 62.2 (market price)
• The setup remains valid while price stays above ~61.5
• Upcoming earnings (July 19) may act as a catalyst
Target:
• Take Profit: 69.50
Expected move: +11%
No Stop? Then Watch Closely:
Soft invalidation if price breaks below 59.50 (4H close)
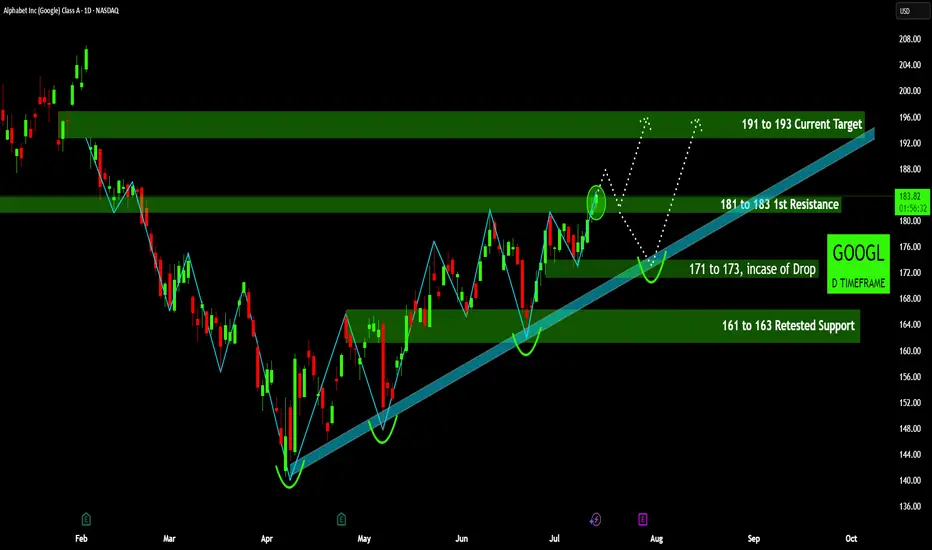
Analyzing GOOGL's Path: Breakouts and Critical Support• Strong Upward Trendline : The chart clearly displays an ascending trendline (light blue) from early April, indicating a robust bullish trend. The price has consistently found support at or near this line, reinforcing its significance as a key technical level.
• Recent Breakout and Potential Retest : The price has recently broken above a notable resistance zone around the $181-$183 mark (highlighted in green). The dotted white lines suggest a potential retest of this newly formed support level before a continuation of the upward movement, a common pattern following a breakout.
• Identified Price Targets Ahead : Two distinct target zones are identified above the current price: the $181 to $183 range as the "1st Target" (already reached/broken out of), and a higher "2nd Target" between $191 to $193. These represent areas where upward momentum might face resistance or profit-taking.
• Critical Support Zone for Drop Scenarios : In the event of a price drop, the chart indicates a critical support zone from $171 to $173. This area aligns with the ascending trendline, making it a crucial level to watch for potential bounces if the price pulls back.
• Confirmed Retested Support Below : Further down, the chart highlights a retested support zone between $161 and $163. The repeated testing and holding of this level affirm its strength as a reliable base for the price in the longer term.
Disclaimer:
The information provided in this chart is for educational and informational purposes only and should not be considered as investment advice. Trading and investing involve substantial risk and are not suitable for every investor. You should carefully consider your financial situation and consult with a financial advisor before making any investment decisions. The creator of this chart does not guarantee any specific outcome or profit and is not responsible for any losses incurred as a result of using this information. Past performance is not indicative of future results. Use this information at your own risk. This chart has been created for my own improvement in Trading and Investment Analysis. Please do your own analysis before any investments.
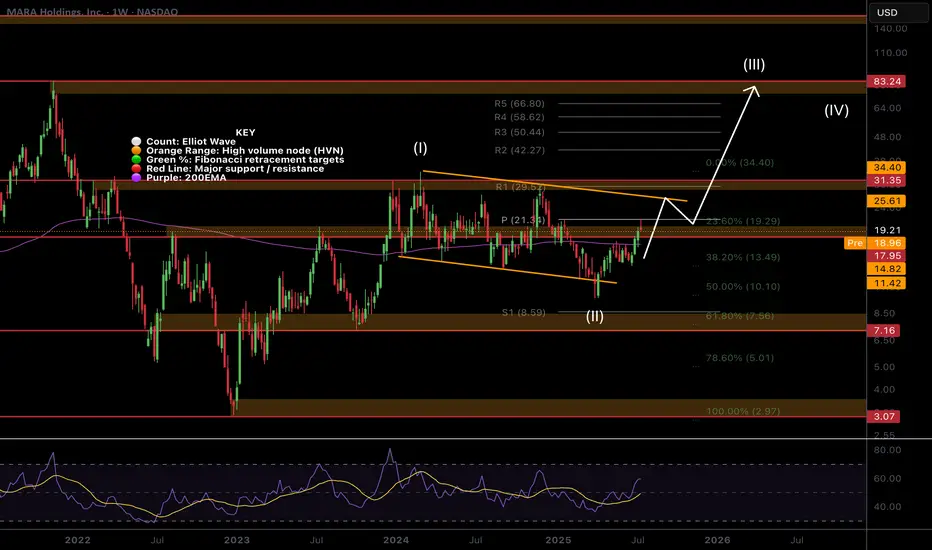
$MARA Hits the Weekly PivotNASDAQ:MARA path has been grinding higher clearing the High Volume Node (HVN) resistance where it is sat as support.
The weekly pivot rejected price perfectly so far but if the count is correct and Bitcoin doesn't dump I expect this continue strongly towards the descending orange line resistance as my partial take profit target.
Once that line is broken i am looking at terminal bull market targets of $80 but will of course take profit at key areas along the way.
Wave 2 swung below the descending support and recovered at 0.5 Fibonacci retracement potentially kicking off wave 3.
Safe trading
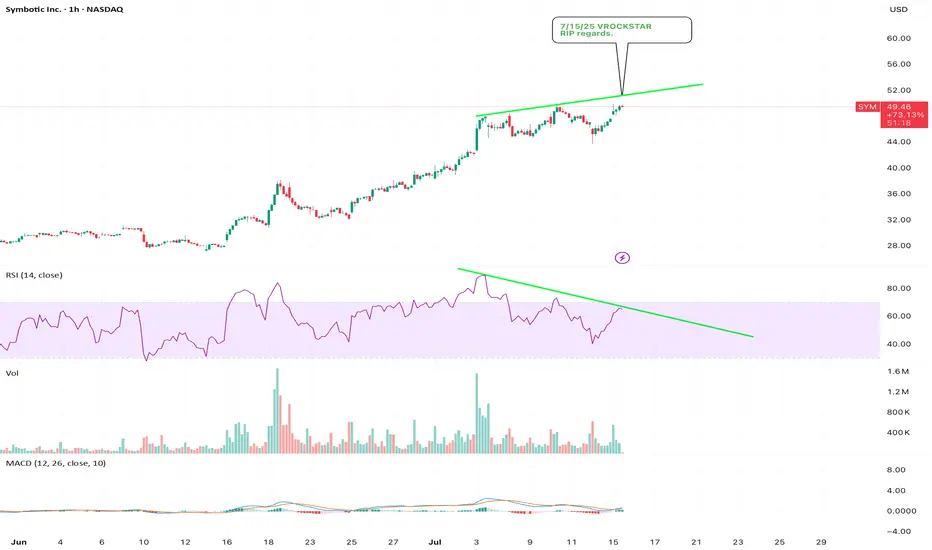
7/15/25 - $sym - RIP regards.7/15/25 :: VROCKSTAR :: NASDAQ:SYM
RIP regards.
- sizing this up
- muh robots
- but didn't do muh work
- hedge
- but seeing that -6% open on monday told me how incredibly fragile this structure is
- might head higher idk idc. one of my 10 hedges rn. you guys know
- pltr
- cvna
- qubt
- sym
- ura
- qs
- a few others ;)
V
Tesla Bulls Assemble: It’s Time for a Clean Robbery🚨🔥TESLA STOCK ROBBERY BLUEPRINT: Thief Trading Heist Plan v2.0🔥🚨
(Swing & Day Traders, Scalpers — Welcome to the Ultimate Market Raid)
🌍 Greetings, Money Makers & Market Bandits!
Hola! Ola! Bonjour! Hallo! Marhaba! Salute from the global Thief Squad! 💰💸🕶️
Today, we’re unleashing a bold market raid on NASDAQ:TSLA (Tesla Inc.), using our signature Thief Trading Strategy™ — a fusion of technical precision, smart risk, and fundamental power. This is not your average trade idea — this is a robbery plan, tailor-made for those ready to outsmart the market with elite tactics.
🎯 The Mission: Steal the Bullish Breakout Before the Bears Wake Up!
Market Status:
Tesla is showing early signs of bullish strength — short-term consolidation with a potential breakout toward the upper red zone. However, that red zone is where the “Police” (resistance + short sellers) wait to ambush — so we enter with strategy, not emotion.
🟢 Entry Zone – "Vault is Open, Thieves Assemble!"
We’re looking for a long entry anywhere inside the most recent pullback zones (use 15m / 30m candles). Place layered buy-limit orders like a DCA thief stacking charges, targeting the swing low or support wick.
🔑 Pro Tip: Be patient. Let the pullback bless your orders. We rob smarter, not harder.
🛑 Stop Loss – "Escape Route Planned"
Stop Loss = Placed under swing low (3H TF). Current suggested SL: $280.00 (adjust for risk profile).
💬 Thief Note: Your SL depends on position size, number of entries, and account leverage. Never risk your life savings on one job. 😉
🎯 Target Zone – "The Big Loot"
Main Target 🎯: $395.00
Optional Exit: Trail your SL and escape early with bags full of gains. Exit before the trap if heat rises. 🔥
👀 Scalpers – "Fast Hands Get First Cash"
Stick to the long side only. Shorting this train is standing in front of a robbery truck. Use trailing SLs and grab those quick gains.
If you're a small account thief — no worries — ride with the swing crew. We share the loot.
📊 Why the Heist Now?
TSLA's move is supported by:
🔍 Fundamental strength & positive sentiment
🌐 Macro tailwinds & sector rotation favoring EV/Tech
🧠 Intermarket & index alignment
📰 Bullish outlook from recent positioning and COT data
🧨 Consolidation base forming an explosive setup
⚠️ Caution Tape – News Alert Zone
🚨Stay Clear of Major News Releases!
Avoid opening fresh entries during high-impact news. Use trailing SLs to protect your gains. Market heat can go nuclear — be alert, not emotional.
💖 Support the Heist – Smash That BOOST Button!
If you love this Thief Strategy, hit the BOOST 💥
Help us reach more robbers, dreamers, and money makers across TradingView. Let’s build the biggest, smartest, most strategic trading crew ever.
📌 Disclaimer (We're Thieves, Not Financial Advisors)
This is not financial advice — it’s a strategic idea shared for educational purposes. Adjust based on your own risk profile. Never enter a robbery without a plan. 🧠💼
🔥 Stay locked in. Another market heist blueprint is coming soon.
Until then — keep your charts clean, your entries smart, and your exits legendary.
💸Rob the Market — The Thief Way™
🐱👤🎯📈🚀
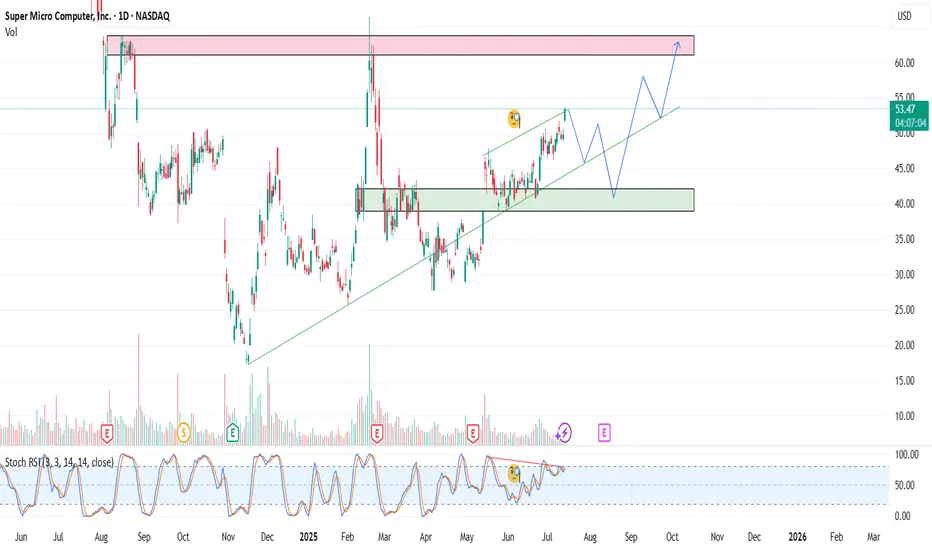
SMCI: When a chart says it’s time to reconnect with the AI hypeOn the daily chart, Super Micro Computer Inc. (SMCI) is showing a clean bullish setup. Price broke out of a descending trendline (green dashed), confirmed it with a retest, and is now consolidating above the breakout zone. The golden cross — where the MA50 crossed above the MA200 — confirms a long-term trend reversal.
Volume profile indicates strong accumulation near $41–43. The 0.5 Fibonacci level at $41.84 acted as support. Above the current range, there’s low volume resistance up to $63.57 (0.786), followed by $66.44 and a final extension target at $79.82 (1.272).
Fundamentals: SMCI is a leading server hardware manufacturer. Demand for their systems has soared with the explosion of AI infrastructure. The company maintains solid financials, with rising quarterly revenue and growing presence in the cloud sector. Institutional investors have been actively increasing their positions since late 2023 — a sign of strong long-term conviction.
Tactical plan:
— Entry: market $42–43
— Target 1: $55.91
— Target 2: $63.57
When technicals scream textbook breakout and fundamentals bring AI momentum to the table — it might just be one of the best late entries in the AI wave this summer.

AMD is a strong buyAs mentioned, NVIDIA is overbought RSI over and other indicators. Put your bets on AMD.
BABA: What are you seeing on this chart?BABA:
.
What are you seeing on this chart?
A perfect shakeout.
Smart money has joined at the bottom.
What's next?
.
US STOCKS- WALL STREET DREAM- LET'S THE MARKET SPEAK!

Axsome Therapeutics (AXSM) Breaks Out — Targeting Analyst Price Axsome Therapeutics (AXSM) has just broken out of a multi-month descending trendline, signaling renewed bullish momentum. I will buy at the open, targeting the analyst price target of $176.68 for a potential strong upside move. My stop will be set just below the prior resistance line (~$110), which should now act as support. This setup offers a favorable risk/reward, with the trendline breakout confirming renewed interest and upside potential.

SMCI – Reloading the AI BeastSMCI continues to show strength as a key player in the AI infrastructure space. In this update, I present a new strategy with staggered entry zones at $49, $45, and $38 — designed to capture value during healthy pullbacks within a larger bullish trend.
Entry Plan:
1) $49
2) $45
3) $38
Target:
1) $56
2) $61
3) $66
📉 If price dips back to $45 or $38, I will reload heavier. No FOMO. Let the market come to us.
Drop a 👍 if you're still riding SMCI or waiting for the next entry.
This analysis is for educational and informational purposes only. It does not constitute financial advice or a recommendation to buy or sell any securities. Always do your own research and consider your risk tolerance before making investment decisions.