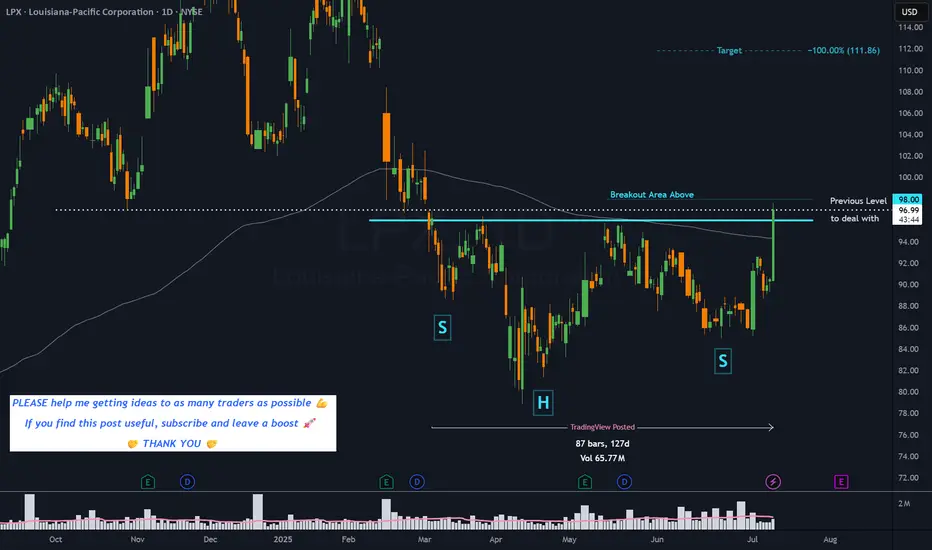
LPX - 4 months HEAD & SHOULDERS══════════════════════════════
Since 2014, my markets approach is to spot
trading opportunities based solely on the
development of
CLASSICAL CHART PATTERNS
🤝Let’s learn and grow together 🤝
══════════════════════════════
Hello Traders ✌
After a careful consideration I came to the conclusion that:
- it is crucial to be quick in alerting you with all the opportunities I spot and often I don't post a good pattern because I don't have the opportunity to write down a proper didactical comment;
- since my parameters to identify a Classical Pattern and its scenario are very well defined, many of my comments were and would be redundant;
- the information that I think is important is very simple and can easily be understood just by looking at charts;
For these reasons and hoping to give you a better help, I decided to write comments only when something very specific or interesting shows up, otherwise all the information is shown on the chart.
Thank you all for your support
🔎🔎🔎 ALWAYS REMEMBER
"A pattern IS NOT a Pattern until the breakout is completed. Before that moment it is just a bunch of colorful candlesticks on a chart of your watchlist"
═════════════════════════════
⚠ DISCLAIMER ⚠
Breakout Area, Target, Levels, each line drawn on this chart and any other content represent just The Art Of Charting’s personal opinion and it is posted purely for educational purposes. Therefore it must not be taken as a direct or indirect investing recommendations or advices. Entry Point, Initial Stop Loss and Targets depend on your personal and unique Trading Plan Tactics and Money Management rules, Any action taken upon these information is at your own risk.
═════════════════════════════
Franco-Nevada Breakout — Is $160 the Launchpad?With gold breaking to new all-time highs and capital rotating into high-quality royalty names, Franco-Nevada looks poised to lead the charge in the next leg of the bull market.
After spending nearly 3 years in a wide consolidation ($106–160), FNV has now posted a clean monthly close above $160 — the key resistance level that capped every rally since 2020. This is not just any breakout — it's the classic "base + breakout" structure that often precedes major upside moves.
🔍 Technical Highlights:
✅ Multi-year base breakout confirmed on monthly close
✅ Strong confluence of Ichimoku, MAs & low-volume node just above $160
✅ $160 flips from resistance to structural support (role reversal)
🎯 Measured Move Target: $230
📍 Initial Target Zone: $208–215
📈 Retest of $160 offers a ~30% upside with tight risk
🛑 Risk Management: A pullback that holds $160 on weekly/monthly close would validate the breakout.
Breakdown below $160 on volume would put the move on hold and reintroduce range risk.
💡 Bottom Line: This is a textbook breakout with asymmetric risk/reward. While gold gets the headlines, Franco-Nevada may quietly be leading the charge in royalty sector performance.

UNH setting up for a big moveUNH wedge... gaps to fill... obviously some uncertainty and earlier tried to break out, but an eventual breakout to the upside is written on the wall

SMCI BULL FLAG PART 2smci bull flag, reclaimed bullish emas recently, volume starting to come back in, imo has potential to run to 60+

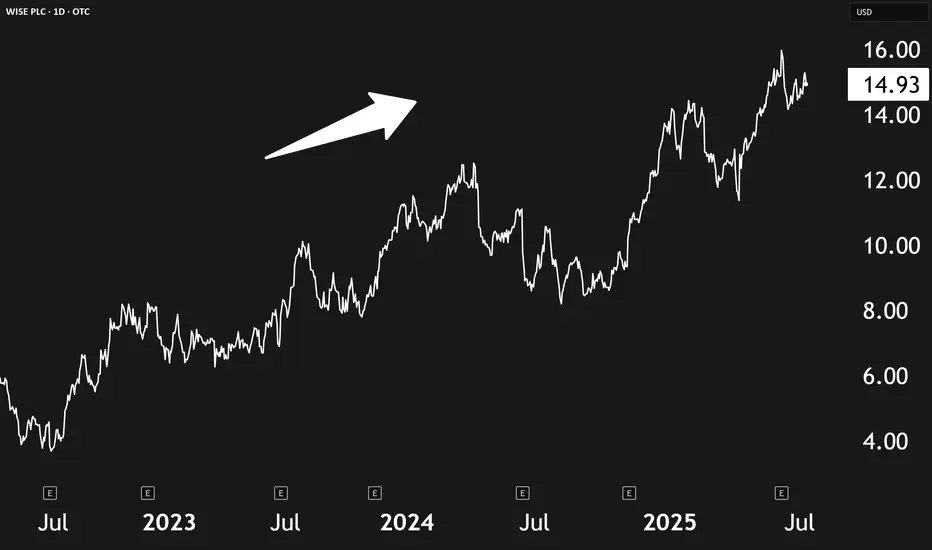
Wise Is Poised To Capture A Multi-Trillion Dollar OpportunityA few months back, we highlighted key investment trends for the next decade—among them, cross-border finance and fintech disruption. Now, Wise plc OTC:WIZEY , a British fintech leader, is showing strong alignment with both themes, and it may soon benefit from even more investor attention as it plans to move its listing from the UK to the U.S.
🌍 What Wise Does
Wise offers low-cost, tech-driven cross-border payment services. Rather than sending money physically across borders, it uses a network of local money transfer entities to settle transactions locally. This allows the company to avoid high bank fees and offer fast, affordable currency exchanges. Currently, 65% of its international payments are settled instantly, and 95% are completed within 24 hours.
Its infrastructure, built over the past decade, gives Wise a strong moat—few competitors can replicate its speed and pricing. The company also offers personal and business multi-currency accounts, a debit card, and an investing feature called "Wise Assets." Additionally, Wise licenses its payment rails to institutions like Morgan Stanley and Monzo, creating another layer of growth potential.
📈 Financials & Growth
Wise has seen explosive growth:
- Revenue has more than tripled since 2021.
- Profits are up 7.2x during the same period.
- Active users, transfers, and customer balances are all climbing steadily.
Management expects mid-teens growth in both revenue and profits, though we see this as conservative given Wise’s network effects.
💰 Valuation & U.S. Relisting Potential
Currently valued at ~$17.8 billion with a P/E of ~24.7x, Wise trades more cheaply than many U.S. fintech peers. If EBIT projections hold—$900M in 2026 and $1.1B in 2027—the multiple could compress to ~17x, making it even more attractive.
Relisting in the U.S. could spark multiple expansion as it gains visibility and liquidity among U.S. investors. Wise trades at about 5x sales today; even a modest bump closer to 10x could signal major upside.
⚠️ Risks to Watch
Low U.S. liquidity: Shares currently trade over-the-counter under WIZEY, which comes with low volume and potential slippage.
Emerging competitors: Rivals like Remitly (RELY) are growing.
Security risks: Any breaches, like the one it faced years ago, could damage trust.
✅ Final Take
Wise stands out as a rare combination of profitability, growth, and competitive edge in a massive, underpenetrated market. With a planned U.S. relisting and strong financials, it’s well-positioned for continued upside.
Rating: Strong Buy
Gold royaltyI am following long diagonal trend line in the chart of GROY. There is some divergence in RSI, and support in the distance from MA. A company with good value and probable triple bottom.
With two new producing royalties from this year growth looks inevitable.
Do your own research!

ServiceNow Is Our Top Tech Compounder PickIn a tech world often driven by hype and speculation, ServiceNow NYSE:NOW stands out as a reliable growth engine—a true compounder. Unlike flashier tech names, ServiceNow delivers steady revenue growth and expanding margins, all while offering mission-critical software to businesses.
📈 What’s a Compounder, Anyway?
Compounders are companies that grow steadily over time by reinvesting profits at high returns. They may not make headlines, but they consistently outperform by:
- Growing demand for their shares
- Reducing share supply (or keeping dilution low)
These are the businesses long-term investors love: predictable, resilient, and scalable.
🧩 Why ServiceNow Fits the Bill
ServiceNow has quietly built a powerful B2B software business, helping organizations streamline operations. Here’s why it qualifies as a compounder:
Strong Revenue Growth: From $3.3B in 2020 to $11.4B today
Rapid Profit Growth: Net income jumped from $34M to $1.54B in the same period
Operating Leverage: Margins have grown from 3.4% to 13.2%, thanks to stable 80%+ gross margins and low incremental costs
Recurring subscription revenue is rising fast—up 20% YoY—driven by the mission-critical nature of its software and increasing AI capabilities.
💸 The Valuation Case
Although many quant models give NOW a weak grade for valuation, context matters. Historically, the stock is trading in the middle of its typical range—about 18x sales and 58x free cash flow.
Looking ahead:
Analysts forecast 20% annual EPS growth through 2027
That implies a forward P/E of 42x, with potential to drop further as margins expand
Combine that with AI-powered upselling and potential share buybacks, and NOW’s valuation starts to look compelling.
⚠️ Risks to Watch
Premium Price Tag: If markets decline, richly valued stocks like NOW could fall harder
Tough Competition: Rivals like Salesforce and Palantir are aggressively chasing similar markets
✅ Bottom Line
ServiceNow may not be flashy, but its financial performance, recurring revenue model, and growth runway make it a solid long-term bet. If management reins in share dilution and continues margin expansion, this stock could deliver serious compounding over the next decade.
Rating: Buy

COIN long -- currently in Wave 3 of 5 wave advance I've been using Elliott Wave Theory to look at COIN's price action. We seem to be in the middle of Wave 3.
- Wave 1: April 7, 2025 to May 22, 2025
- Wave 2: May 23, 2025 to June 13, 2025 - we pulled back right below the 23.6% Fibonacci retracement level with ~$244 serving as support.
- Wave 3: June 14, 2025 - now. The third wave usually has 5 distinct sub-waves. As of July 7, 2025 We appear to be in the 3rd sub-wave of wave 3. Using the upper channel line, price target for this wave is around $408-$410. Quite possible if we see BTC move up explosively, which also seems imminent given the highest weekly close on July 6, 2025.
COIN is a very volatile stock that has explosive moves to the up and downside. I think we still have more room to run in this current wave 3--even beyond sub-wave 1 peak at $380.

Bitfarms about to rip higherWith Bitcoin hitting all-time highs today, Bitfarms is trading near its all-time lows and breaking out of this downward sloping trendline. Look for BITF to go much higher if Bitcoin continues its rally!

TMUS watch $227.03-227.69: Key support zone to end downtrend? TMUS has dropped a lot from its ATH a few months ago.
Currently testing a key support zone at $227.03-227.69
Look for a clean bounce to signal end of the downtrend.

Its A Prime Set Up Guys, May 13th May 13th there will be a press conference with the CEO I think.
All techinals show a sharp fall will occur soon and I bet its the 13th.
Reached the top of the trend line and we are very over extended. Ying and a yang, time for the yang.
See my price path for a rough guess.
RIH Longan upward trend in the prices of an industry's stocks or the overall rise in broad market indices, characterized by high investor confidence

DDOG: Navigating Key Support and Resistance ZonesAscending Trendline/Channel:
o A prominent green ascending trendline, starting from the lows in April, defines the current bullish momentum.
o This trendline has acted as dynamic support, with the price bouncing off it on multiple occasions. As long as the price remains above this line, the intermediate-term uptrend is considered intact.
Key Support Zones (Green Bands):
o Primary Support (130 to 135): This is the most immediate and critical support zone. Historically, this area acted as resistance in late 2024 and early 2025. Now, it is being tested as potential support—a classic example of a "role reversal" or "polarity" principle. The price is currently trading just above this zone.
o Secondary Support (118 to 120): If the primary support at 130-135 fails to hold, the next significant level of support is identified between 118 and 120. This zone provided support in the latter part of 2024.
Key Resistance / Target Zones (Red Bands):
o 1st Target / Resistance (~155): This level represents the first major overhead resistance. The chart shows a recent sharp rejection from this area, which initiated the current downward move. For the uptrend to continue, bulls would need to break and hold above this zone.
o 2nd Target / Resistance (~165): Should the price overcome the 155 level, the next major resistance is identified around 165. This corresponds to the major high seen at the end of 2024.
Current Price Action:
DDOG recently tested the resistance near 155 and has since pulled back. The price is now situated at a crucial juncture, hovering above the primary support zone of 130-135 and approaching the main ascending trendline.
Summary of Observations:
The confluence of the horizontal support zone (130-135) and the ascending trendline creates a significant area of interest.
• A hold and bounce from this confluence could signal a continuation of the uptrend, with the 155 and 165 levels as the next potential upside objectives.
• A decisive break below both the 130 level and the ascending trendline could signal a shift in momentum and may lead to a deeper correction, with the 118-120 zone as the next major support to watch.
Disclaimer:
The information provided in this chart is for educational and informational purposes only and should not be considered as investment advice. Trading and investing involve substantial risk and are not suitable for every investor. You should carefully consider your financial situation and consult with a financial advisor before making any investment decisions. The creator of this chart does not guarantee any specific outcome or profit and is not responsible for any losses incurred as a result of using this information. Past performance is not indicative of future results. Use this information at your own risk. This chart has been created for my own improvement in Trading and Investment Analysis. Please do your own analysis before any investments.

ORACLE Can you foresee it at $2000??Oracle (ORCL) is having perhaps the most dominant recovery from Trump's Tariff lows out of the high cap stocks, trading comfortable on new All Time Highs.
This is no surprise to us, as like we've mentioned countless times on our channel, we are currently at the start of the A.I. Bubble and heavy tech giants are expected to see massive gains until 2032, where we've calculated the end of this Bull Cycle and the start of a strong Bear.
As mentioned, this situation is extremely similar to the Dotcom Bubble of the 1990s. Of course Oracle is nearly impossible to repeat the +38637% gains of that Golden Decade after the 1990 Oil Crisis but in Fibonacci price and time terms, it can technically complete a +3411% rise and hit $2000 in the next 7 years.
If you have a long-term investor mindset like us, this is a must stock to buy and hold.
-------------------------------------------------------------------------------
** Please LIKE 👍, FOLLOW ✅, SHARE 🙌 and COMMENT ✍ if you enjoy this idea! Also share your ideas and charts in the comments section below! This is best way to keep it relevant, support us, keep the content here free and allow the idea to reach as many people as possible. **
-------------------------------------------------------------------------------
💸💸💸💸💸💸
👇 👇 👇 👇 👇 👇

AMD new range higherAMD essentially hit my buy zone that I called months ago almost to the T. Now with renewed strength and the market realizing there is share for both NVDA and AMD, the stock rips. I believe it will push up into this zone over the next week weeks and consolidate here. I am not currently in this trade but I did short AMD on the prior pivot.
Sometime in August we likely enter this range and I may start to sell CSP in the demand zones that form.

Target will hit my Targets. They are beloved by the people!Target has been re structuring there entire business after DEI was taken away.
I think they realized that going down that path is not profitable and would bankrupt them quickly if they continued.
They boosted security measures and also strengthened there online store a lot.
Target #1: $116
Target #2: $120

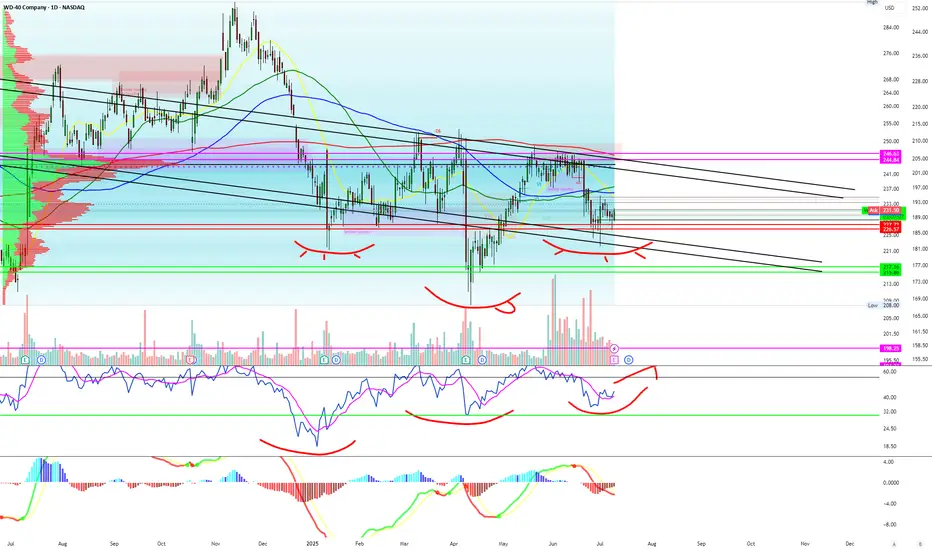
Never thought I'd be bullish WD-40 LMAOAll indicators such as RSI, descending channel pattern and MACD combined with options exposure make me believe earnings will be good in the stock prices eyes.
IWM and small cap stocks are really starting to pop off and nothing is more American then WD-40!!!
Target #1 - $240
Target #2 - $250
Tesla (TSLA) Market UpdateTesla NASDAQ:TSLA shares dropped nearly 7% after Elon Musk dismissed analyst Dan Ives' suggestion to scale back his political activities. Musk also proposed a new pay package, raising concerns among investors about potential distractions from Tesla’s core business.
📊 Upcoming Catalyst:
Tesla is set to report its Q2 earnings on July 23, with investors eagerly awaiting updates on the company’s financial performance and the newly launched robo-taxi service in Austin, Texas.
⚠️ Sentiment:
Recent bearish headlines include:
Concerns over potential Robotaxi issues
The ongoing Trump/Elon Musk political drama
📈 Trading Opportunity (Long Setup):
Despite the negative sentiment, this dip could offer a solid long entry opportunity:
Entry Zone: $275–$270
Take Profit Targets:
TP1: $315
TP2: $335
Stop Loss: Close below $265

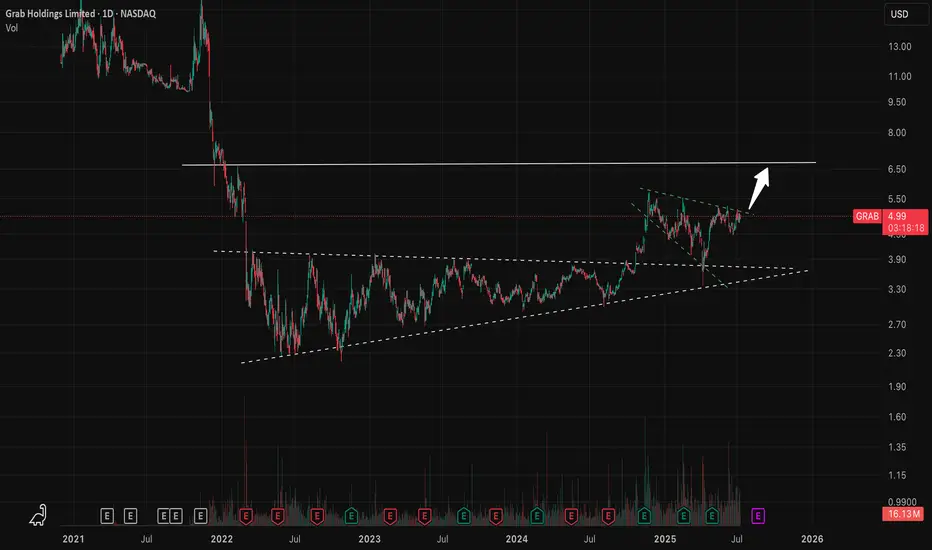
$GRAB possible breakout move $6+- NASDAQ:GRAB consolidating under trendline and looking to breakout.
- NASDAQ:GRAB is growth story of south east asia and deserves a premium. Given they have defended the region from NYSE:UBER but also expanded a indisputable force in the south east asia.
CRWV is crash this weeklast 3 days closed below 21 ema. under 50 on daily RSI. head/shoulders below 145 may breach 140 this week? looks like it. i'm gonna make the play.
148 SL

Base Setup RGTILooks like the base is finally setting up with the recent 7 week base that is much tighter than the previous deep deep base..

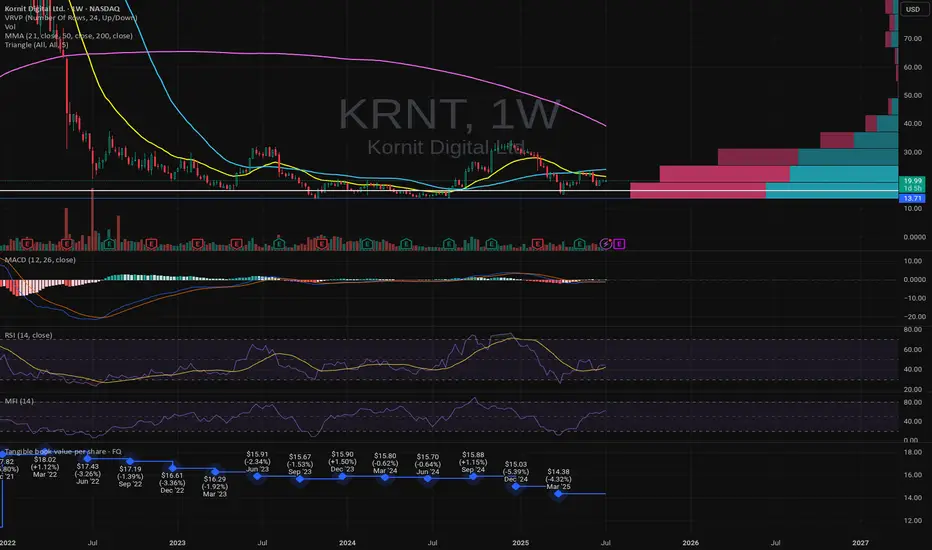
KRNT - longKRNT
Looking like it seems to be creating a good base. Earnings will need to follow suit.
I like it.
don't have it tho.
Cheers
Bark | BARK | Long at $0.84BARK, Inc. NYSE:BARK is a dog-focused company offering subscription-based products like BarkBox and Super Chewer, delivering monthly toys, treats, and pet supplies. It operates in Direct-to-Consumer and Commerce segments, selling through its website, retail partners, and e-commerce platforms. While not overly bullish here, especially given the economic / recession-fear headwinds, I think this is one of those stocks that may have a future "pop" as interest rates are lowered, or news emerges of the company expanding to new retail partners. A few insiders have recently purchased shares (~$75k under $1.00) and others have been awarded options. The book value currently rests near $0.64. It may dip between that price at $0.50 in the near-term. However, that's just been the trajectory of SO many of these SPAC stocks... dip then pop or bust.
Fundamentally, nothing to uproar over and this is a risky investment (Nasdaq delisting may occur). The positive is the debt-to-equity in 0.9x, which is pretty good for a small company. But 2026 is expected to be its worst earnings year. The future may look bright in 2027 and beyond, but can the company last? Time will tell.
Thus, for a swing trade, NYSE:BARK is in a personal buy zone at $0.84 with a risk of further near-term decline between $0.50 and $0.64.
Targets into 2027
$0.95 (+13.1%)
$1.25 (+48.8%)
