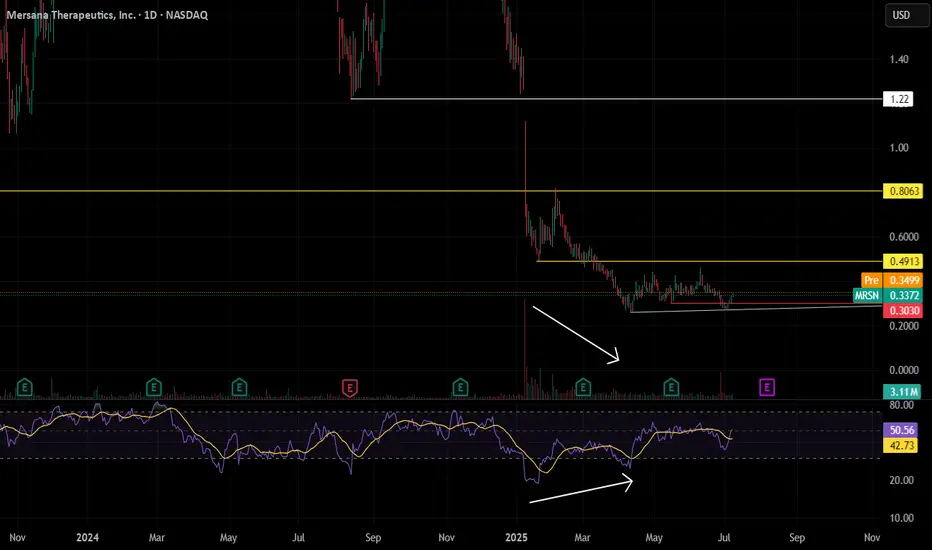
MRSN MRSN is exhibiting a positive divergence followed by a consolidating sideways movement.
The initial target is 0.491, followed by 0.806
This stock has the potential to move rapidly above $1
Importantly, set a stop loss at 0.2999
Royal Gold (RGLD) Poised for Growth with $3.5B Sandstorm Acq.🚀 **Royal Gold (RGLD) Poised for Growth with $3.5B Sandstorm Acquisition!** 🥇
Royal Gold ( NASDAQ:RGLD ) is making waves with its $3.5B all-stock acquisition of Sandstorm Gold ( NYSE:SAND ) and a $196M cash buyout of Horizon Copper, announced July 7, 2025. Here’s why this could be a game-changer for investors! 📈
**🔥 Financial Highlights:**
- **Q2 2025 Performance**: Sold 40,600 GEOs at $3,248/oz gold, $32.91/oz silver, with an impressive 87% gross margin. $11.1B market cap reflects strength. 💰
- **Acquisition Impact**: Sandstorm deal adds 40 producing assets, boosting 2025 GEO production by 26%. Expect revenue & earnings growth post-Q4 2025 close. 🚀
- **Dividend Confidence**: Declared $0.45/share Q3 dividend, signaling robust cash flows. 💸
**📊 Sector Edge & Valuation**:
- **Undervalued?** Compared to Wheaton ($56B) & Franco-Nevada ($44B), Royal Gold’s lower valuation (per RBC Capital) could signal a bargain. Post-deal scale (75% gold revenue) may close the gap. 📉
- **Performance**: Sandstorm’s record Q1 2025 results + Royal Gold’s aggressive expansion outpace peers in growth potential. 🚀
**⚠️ Risks to Watch**:
- 6%–8.5% stock dip post-announcement reflects dilution fears (~19M new shares). 📉
- Commodity price volatility & regulatory approvals (due Q4 2025) pose risks. ⚖️
**🎯 SWOT Snapshot**:
- **Strengths**: Enhanced portfolio, 87% margins, leading North American royalty player.
- **Opportunities**: Analyst optimism (BMO $197 target) & copper exposure via Horizon.
- **Weaknesses**: Short-term dilution concerns.
- **Threats**: Commodity price swings, peer competition.
**💡 Why Buy Now?**
Royal Gold’s stock dip could be a buying opportunity, with analysts like BMO ($197 target) and unusual options activity signaling confidence. If precious metals stay hot ($3,342.80/oz gold futures), RGLD’s diversified portfolio could shine! 🌟
📅 **Deal Close**: Q4 2025, pending approvals.
🔎 **Dive Deeper**: Check Royal Gold’s IR page or Yahoo Finance for details.
What’s your take on NASDAQ:RGLD ’s big move? Bullish or cautious? 🐂🐻 #StockMarket #Gold #Investing

QSI - grinding upQSI is showing an upward trend, accompanied by a gradual increase in volume
The initial target is set at 2.43. If it closes with strong volume, the subsequent targets are 3.79 and then 5.33
My stop loss will be triggered if it closes below the orange trend line, which is around 1.70

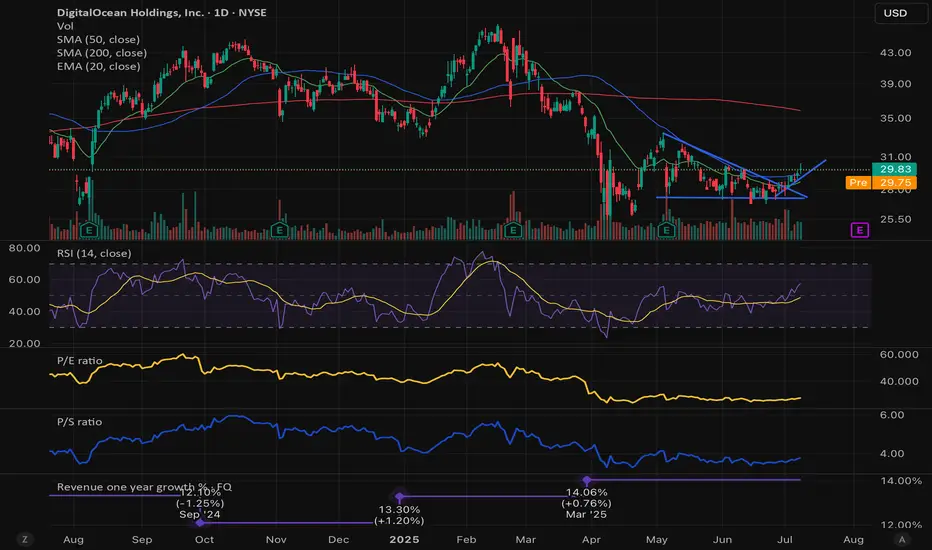
DOCN is taking offGreat value, IMO the safest bet on AI infrastructure. With forward P/E 15X, ARR 2.5X and elevated short interest. Holding
Tempus AI getting some firepowerLooks like we have got support here at $57 area. MACD looking good and overall structure points to further upside. First target $69. If it pushes through then final target $78.

Steal the Breakout: Broadcom Bulls Are In!💎🔓 "Broadcom Break-In: Bullish Vault Raid in Progress!" 🔓💎
🌟Hi! Hola! Ola! Bonjour! Hallo! Marhaba!🌟
Dear Money Makers & Market Robbers 🤑💰✈️,
It’s time for a high-stakes raid on BROADCOM, INC (AVGO) — all based on our secret Thief Trading Strategy™, combining sharp technicals & a sniff of fundamentals.
🕵️♂️ Mission Brief:
Our target is the Bullish Vault – a swing/day trade play with upside momentum. The chart reveals a possible trap at overbought zones where unsuspecting bears get lured in... and we walk out rich! 😏💸
🎯 The Heist Blueprint:
📥 Entry (Buy-In Point):
🚪 “The vault’s open – grab the bullish bags!”
Swipe any bullish setup on the 15m/30m timeframe
Ideal: Buy Limit near recent swing low (support levels)
📳 Set alerts to stay ready – we rob smart, not fast
🛑 Stop-Loss (Escape Plan):
Place SL below recent 30m swing low — approx. 269.00
Adjust by your lot size & number of trades
Don't risk the whole bag – we ain't greedy thieves 😈
📈 Target (Take-Profit Point):
🎯 First Exit Zone: 296.00
💨 Or vanish before the cops (market reversal) arrive
🧲 Scalpers’ Secret:
Only scalp long – don’t fight the bullish flow
Got big capital? Enter early. Small bag? Join the swing crew
Use Trailing SL to guard your stolen gains 🏦🔐
💡 Behind the Heist:
AVGO is showing bullishness thanks to:
📰 Macro Drivers • COT Reports • Institutional Bias
📊 Sentiment Analysis • Index Correlations
💥 Geopolitical Developments – Always stay updated
🔎 Want more intel? Dive into the news, fundamentals, & positioning data that power this trade idea 💣
⚠️ Trade Smart, Thieves:
📛 News events cause chaos – avoid fresh entries during releases
📉 Use trailing stops to secure your loot & dodge slippage
💖 Like the Heist Plan? Hit Boost!
Let’s build the most notorious money-making crew on TradingView! 🚀
Daily gains using the Thief Style™ – not for the faint-hearted.
🔒 Stay sharp, trade like a phantom, and keep stacking that digital cash!
💬 Drop a comment if you’re in the gang – another plan’s coming soon! 🤑🐱👤
📌 Note: This is a general market analysis. Do your own due diligence before risking real capital.
📌 Stay updated — the market changes fast. Adapt or get trapped.

CRC | Long | Strong Cash Flow | (July 2025)CRC | Long | Strong Cash Flow & Carbon Transition Story | (July 2025)
1️⃣ Short Insight Summary:
CRC is showing solid momentum as it combines strong cash flow from oil & gas with an expanding carbon capture strategy. Price action suggests a possible breakout on its second attempt at resistance.
2️⃣ Trade Parameters:
Bias: Long ✅
Entry: Watching current resistance zone closely on the 4-hour chart; money inflows confirmed on daily.
Stop Loss: Around $44 (invisible stop loss level to manage risk).
TP1: $53 💰
TP2: $57 💰
Partial Exits: Letting a portion run towards $63 for extended upside potential.
3️⃣ Key Notes:
We see strong institutional support, recent acquisition synergies from Aera Energy, and potential tailwinds from the Carbon TerraVault (CTV) project. Watch for volume confirmation and the upcoming Q2 earnings report on August 5, which could act as a catalyst. Be cautious of commodity price volatility and regulatory timelines for CCS projects.
4️⃣ Optional Follow-up Note:
Will monitor closely and share updates as the trade develops, especially if earnings significantly shift sentiment.
Please LIKE 👍, FOLLOW ✅, SHARE 🙌 and COMMENT ✍ if you enjoy this idea! Also share your ideas and charts in the comments section below! This is the best way to keep it relevant, support us, keep the content here free and allow the idea to reach as many people as possible.
Disclaimer: This is not a financial advise. Always conduct your own research. This content may include enhancements made using AI.

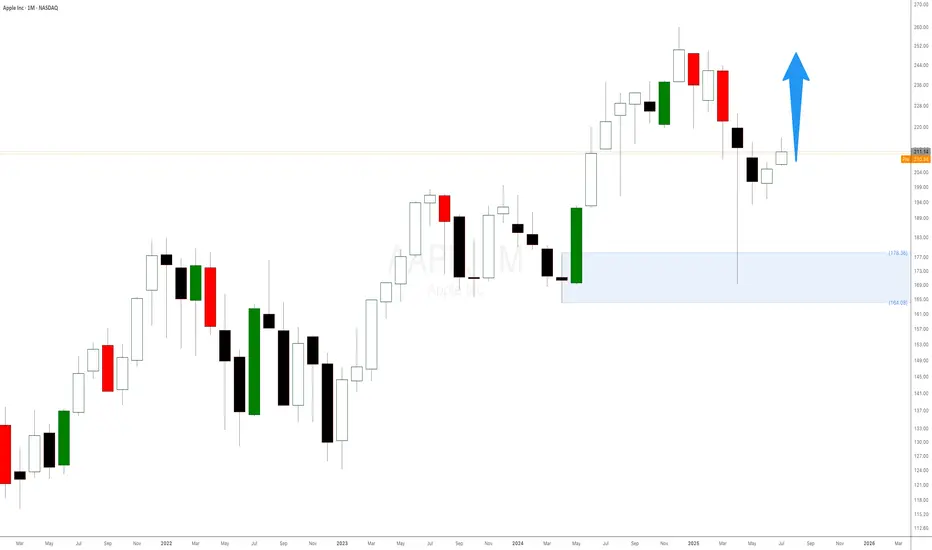
Apple Stock Is Surging! Here’s What Most People MissWhen it comes to trading, we don’t care about the latest news headlines or whether some analyst has upgraded or downgraded Apple stock. We focus on one thing and one thing only: the undeniable forces of supply and demand imbalances on higher timeframes.
Right now, Apple’s monthly chart is a textbook example of how waiting for a strong demand imbalance pays off. That $178 monthly level is no random number. It’s the exact origin of a massive bullish impulse that happened in June 2024 — the kind of move that only happens when smart money and big institutions step in, creating an imbalance that pushes the price away rapidly.
📈 It’s Not About Fundamentals. It’s About Imbalances.
Most retail traders waste time chasing news, earnings, or rumours about iPhone sales. But if you think about it, all those factors are already priced in once a strong imbalance is formed. Institutions don’t wait for tomorrow’s news — they plan their positions weeks or months ahead, and those footprints are visible right on your chart.
The $178 level indicates a significant drop in supply and a surge in demand large enough to propel Apple higher, marked by consecutive large bullish candlesticks. That’s our signal — nothing more, nothing less.
NVIDIA: Sell ideaSell idea on NVIDIA as you can see on the chart if only and only if we have the breakout with force the support line and the vwap indicator by a big red candle follow by a large red volume.

Nvidia Market Capitalisation Reaches $4 TrillionNvidia Market Capitalisation Reaches $4 Trillion
Yesterday, Nvidia’s (NVDA) share price surpassed $162 for the first time in history. As a result, the company’s market capitalisation briefly exceeded $4 trillion during intraday trading (according to CNBC), making Nvidia the first publicly listed company to reach this milestone.
The rise in NVDA’s share price is being driven by both bullish sentiment across the broader equity market—which appears optimistic ahead of the upcoming Q2 earnings season—and evidence of sustained demand for Nvidia’s products, as artificial intelligence technologies continue to gain widespread adoption.
Noteworthy developments include:
→ Nvidia may begin producing a specialised AI chip for the Chinese market this autumn, potentially circumventing current export restrictions;
→ Perplexity, a company backed by Nvidia, is launching an AI-powered browser aimed at competing with Google Chrome.
Technical Analysis of NVDA Chart
In our previous analysis of NVDA’s price action, we:
→ Drew an ascending channel;
→ Highlighted bullish conviction in overcoming the $145–150 resistance zone.
The channel remains valid, with the current price trading near its upper boundary. However, the RSI indicator is showing signs of bearish divergence, suggesting that the stock may be vulnerable to a near-term correction—potentially towards the median line of the existing upward channel.
At the same time, a major shift in the prevailing bullish trend appears unlikely. The $145–150 range may serve as a key support zone for NVDA in the foreseeable future.
This article represents the opinion of the Companies operating under the FXOpen brand only. It is not to be construed as an offer, solicitation, or recommendation with respect to products and services provided by the Companies operating under the FXOpen brand, nor is it to be considered financial advice.

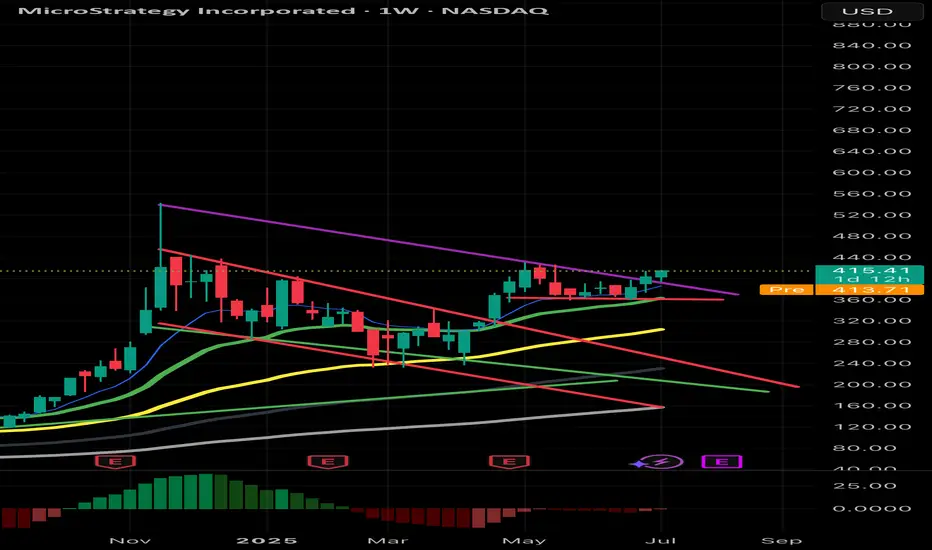
$mstr can’t get better than this setup Just look how beautiful the chart is. Breakout was imminent after waiting for the right time. This shows how effective the falling wedge pattern always gets out as a winner and everyone loves it because all bitcoin and related stocks mainly depend on falling wedge patterns. Trust the process!!
$CLSK Resistance Ready to break?NASDAQ:CLSK is attempting to push above the resistance at $12.4 continuing the path from the recent analysis.
A breakthrough could push it rapidly to the High Volume Node resistance at $18.
Safe trading

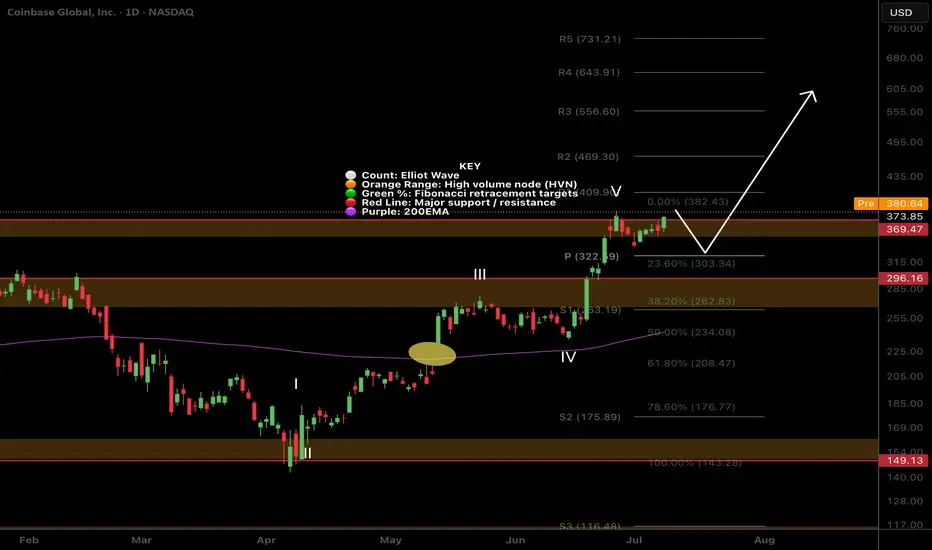
$COIN Price discovery?I was looking for a deeper pullback on NASDAQ:COIN but it appears to be heading into price discovery!
The pivot at $322 was my target but sentiment must be bullish if investors are impatient! Still... i wouldn't count out another sell off as a bear trap on a poke above the swing high.
Safe trading
FivnThe inverse head and shoulders pattern, combined with high volume, activates upon breaking above $30.36, targeting the $40 level.

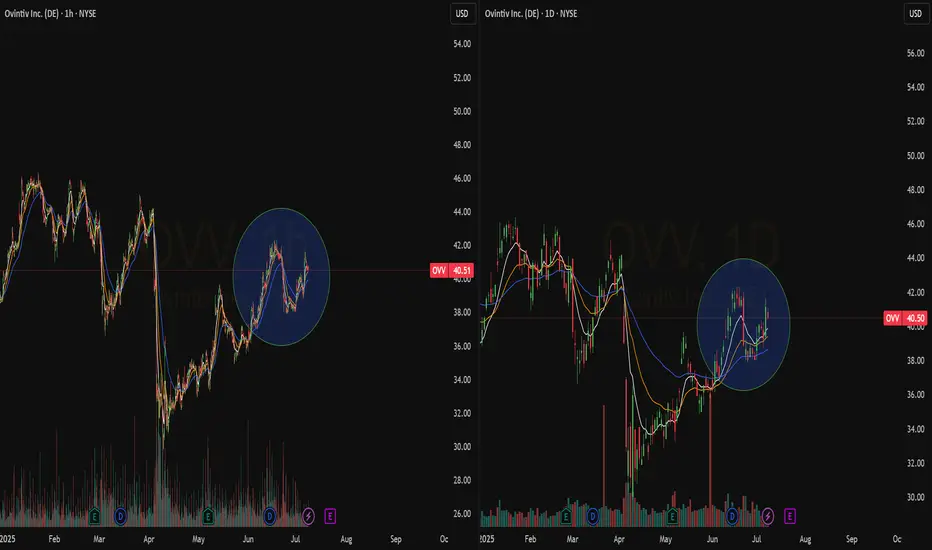
Quick View: $OVV- New bullish crossover in play confirmed by a nice pullback on the daily chart
- Waiting for some volume
$MARA at Resistance!NASDAQ:MARA continues its rally and has come into the High Volume Node resistance target and R2 daily pivot.
Daily 200EMA was tested as support after price smashed through. I expect continuation to the upside $24 target at the R5 daily pivot after some consolidation at this resistance.
Analysis is invalidated way below wave 2 at $13
Safe trading

$MSTR Continues on last weeks path!NASDAQ:MSTR continues to breakout above the channel after a retest as support.
High Volume Node at $440 may proof tough but if price breaks through we could see a strong FOMO induced breakout into price discovery.
Analysis is invalidated below the channel at $358.
Safe Trading

OKLO nice technicals.OKLO after a wonderful cup and handle setup, it has given a breakout and now a pullback to which for me is a great entry position.
Risk aversion.

Quick View: $AAPL- Great Crossover on the Daily chart with the ema9 and 21 that are moving above the ema50
- Consolidation area on the Hourly.

TSLA BUY 253.8Recently, TSLA has maintained a volatile operation. Currently, we can pay attention to the area around 253.8 below, which is a potential buying position for a bullish Gartley pattern. At the same time, this position is within the previous demand area.

SMCI - Bull Flag Breakout SetupSMCI formed a strong bullish impulse followed by a bull flag pattern.
A breakout above the flag structure may signal continuation if confirmed with strong price action.
Trade Plan:
• Entry: On breakout or retest
• Stop Loss: Below flag support
• TP1: Recent high
• TP2: Measured flagpole extension
This setup is worth monitoring for potential bullish continuation.
Disclaimer: This is not financial advice. For educational purposes only.

Using the New 2025 TradingView Screener to find Golden CrossesIn this video, I show you how to use the new TradingView 2025 screener to quickly find stocks forming a golden cross and how to add the 50 and 200 simple moving averages to your charts for clear visual confirmation. A golden cross happens when the 50 moving average crosses up through the 200 moving average. Many traders (both fundamental and technical) watch for this pattern as a sign that a stock (or even whole market) may be shifting from a downtrend to a new uptrend.
Using the TradingView Screener we can quickly find Golden crosses to help filter for potential momentum setups without having to scan hundreds of charts manually. They are not magic signals, but when combined with your own analysis, they can help you spot bigger picture trends that are gaining strength. I walk through step-by-step how to set up your screener to catch these crossovers and add them to your watchlist.
If you want to keep your trading process simple while still catching moves early, this is a practical tool worth adding to your workflow. I also show a few quick tips on how to clean up your filters to reduce the number of stocks you have to go through.
Hope you find this useful. Please like and follow if you do :)

$SGRY | Surgery Partners – Confirmed Breakout NASDAQ:SGRY | Surgery Partners – Confirmed Breakout
NASDAQ:SGRY has broken out of a tight consolidation base after reclaiming key EMAs and building momentum across multiple sessions.
Technical Breakdown
Confirmed breakout above $22.20 base with strong candle close and volume
RSI has pushed above 57 with trend momentum building
EMAs have flipped bullish, with price holding above the ribbon
Low-volume zone above allows room to trend toward next supply shelf
Targets & Structure
First target hit: $23.25 (+3.8%)
Next target: $24.50 (+9.7%) — aligns with previous structure and Fib confluence
Invalidation level: Breakdown back below $22
Strategy Insight
This is a classic breakout continuation pattern from a low-volume zone.
If momentum holds, price has room to push toward $24.50.
A clean backtest to $22.20 could present a lower-risk entry before the next leg up.
