TSLA Caught in Tug-of-War-TA for July 10TSLA Caught in Tug-of-War: Key Gamma & Price Action Setups Unfolding ⚠️
🔍 GEX (Gamma Exposure) Analysis:
Tesla’s options market is highly polarized heading into the week.
* Gamma Walls: Strong Call Wall near $304–$310, showing potential upside magnet if bulls regain control. Above this, the $317.5–$320 zone could trigger a gamma squeeze.
* Put Walls: The $288–$285 zone represents a heavily defended downside, marked by high negative NET GEX and multiple put walls.
* Current GEX Bias: Negative gamma regime persists, increasing potential for volatile moves and sharp directionality.
* IVX is elevated at 61.1, with IVR 17.4, suggesting the options market is pricing in moderate near-term volatility.
📈 Options Trade Ideas:
* Bullish Setup: Consider July 12/July 19 300c–310c debit spread if price confirms reclaim of $300, targeting a gamma squeeze toward $317.5–$320.
* Bearish Setup: If price breaks below $288, buy 285p–275p vertical or 295p straight puts, expecting continuation toward $280 and below.
🕒 1H Price Action Outlook:
Tesla remains stuck in a tight consolidation wedge, showing a battle between supply at $300–304 and demand near $288–290.
* Structure: Market formed a bullish BOS earlier this week but failed to extend higher. The latest CHoCH + rejection from $300 zone suggests sellers are still active.
* Range: Coiling inside a triangle formation with tightening price action. A breakout or breakdown is imminent.
* Demand Zone: The green liquidity block around $284–$288 has held firm so far.
* Trendlines: Price is being compressed between a descending trendline (supply) and ascending trendline (demand), signaling a make-or-break moment.
🎯 Intraday Trade Plan:
* Bullish Case:
* Entry: Above $300 with volume
* Target: $304 → $310 → $317
* Stop: Below $294
* Bearish Case:
* Entry: Breakdown below $288
* Target: $284 → $280
* Stop: Above $295
💭 Final Thoughts:
TSLA is in a pressure cooker. A breakout above $300 opens the door to gamma-driven upside, but continued compression or a loss of $288 support could trigger a fast liquidation. Monitor volume closely — this wedge is near resolution.
This analysis is for educational purposes only and does not constitute financial advice. Always do your own research and manage risk responsibly.

NVDA: Ready for a Gamma Squeeze or Cooling Off? for July 10NVDA: Ready for a Gamma Squeeze or Cooling Off? Here's the Setup You Need 🎯
Options Sentiment (GEX Analysis):
NVDA is trading around $163.35 and sitting just above the Gamma Wall at $162.50, which also marks the highest positive NET GEX zone—a key resistance created by dealer positioning. Above that, the second CALL Wall is stacked near $165, with further resistance layering in toward $170 and $172.50.
Below, there’s a liquidity pocket around $157.50 (HVL zone), and deeper PUT support doesn’t come in until $152.50–$151.00.
* GEX: Bullish leaning (CALLS 2.6% domination, GEX bar fully green)
* IVR: Low at 5.9, and IVx Avg 38 → Options are relatively cheap.
* Sentiment: Leaning bullish with potential for a gamma squeeze if momentum builds above $165.
🟢 Strategy Suggestion:
Consider 160C or 165C weekly calls (with tight spreads) if NVDA holds above $162.50 and breaks through $165 with volume. A gamma squeeze toward $170 is on the table.
Risk-managed PUTs (e.g., 158P) only if price flushes back below $160 support with momentum.
1-Hour Chart Technical Outlook:
NVDA has broken out of the previous range, flipping internal structure bullish. The CHoCH and BOS confirm trend change earlier this week, and the price is now consolidating just under a resistance zone (purple box) near $164.
Support below is layered at:
* $160 (broken resistance, now key support)
* $158.05 (previous structure low)
* $152.00–151.00 (demand zone + GEX support alignment)
Resistance:
* $164.41 (current high)
* $167.50, $170, $172.50 (GEX option walls)
Structure is showing a rising wedge/channel pattern; however, we’re still trending strong with clean higher lows.
🟢 Long Trade Setup (Bullish Continuation):
* Entry: Above $164.50 with breakout confirmation
* Target: $167.50 → $170
* Stop: Below $160 (or tighter below $162.50 based on risk appetite)
🔴 Short Trade Setup (Reversal Scenario):
* Entry: Breakdown below $160 with rejection from $163–$164
* Target: $158 → $152 zone
* Stop: Above $165
My Thoughts:
NVDA is sitting in a key decision zone. As long as it holds above $162.50, bulls have the edge to push this higher into the next GEX walls. Watch for confirmation on $164.50 breakout for continuation. If it fakes out and drops below $160, that would likely trigger a downside flush to $158 or lower.
This analysis is for educational purposes only and does not constitute financial advice. Always do your own research and trade responsibly.

MSTR Heating Up! Options and Intraday Setup Ahead for July/10🔥GEX-Based Options Analysis (Macro Sentiment):
MSTR is showing strong bullish momentum fueled by aggressive options flow. The key GEX levels show:
* Gamma Wall / Max Resistance is at $405–$410, aligning with current price action.
* Positive GEX Flow continues to build up toward $425, where the 3rd CALL Wall sits.
* On the downside, minimal PUT Wall pressure is seen until $390, offering a strong base of support.
💡 Options Setup Ideas:
* Bullish Setup: If MSTR holds above $405–$410 zone, consider a 415C or 420C for 07/12 expiry, targeting a move to $422.50–$425.
* Bearish Reversal Risk: If MSTR breaks back below $400 with volume, risk shifts to downside with $390 PUTs back in play.
IV is still low (IVR 7.4, IVx below average), which supports buying premium over selling.
1H Price Action & Intraday Setup:
On the 1-hour chart, MSTR just broke out of a compression wedge after forming a clean CHoCH and BOS (Change of Character and Break of Structure). Price is now flagging just below the purple supply box, creating a textbook bullish continuation setup.
* Key Levels to Watch:
* Resistance: $414–$416 (if broken, opens room to $422+)
* Support: $404–$408 (recent CHoCH zone and breakout base)
* Deeper Support: $396–$400 (prior structure, invalidation if lost)
📈 Intraday Trade Plan:
* Bullish Scenario:
* Entry: Break and close above $416
* Target: $422.50–$425
* Stop: Below $408
* Pullback Long:
* Entry: Retest of $405 with bullish reaction
* Target: $415+
* Stop: Below $400
* Bearish Reversal (low probability):
* Entry: Breakdown below $400
* Target: $393–$390
* Stop: Above $405
My Thoughts:
MSTR is building strength with both option sentiment and price structure aligning for continuation. It’s one of the cleanest bull flags on the board right now. Keep eyes on the breakout zone at $414–$416 — a push through with volume could trigger a gamma squeeze toward $425.
This analysis is for educational purposes only and not financial advice. Always manage risk before trading.

GOOGL Looks Ready to Reclaim the Channel for July 10GOOGL Looks Ready to Reclaim the Channel – Watch These Key Zones! 📈
🧠 GEX-Based Options Sentiment Insight (20 DTE):
GOOGL shows a strong bullish options bias going into this week, with CALLs comprising 20.3% of flow and a positive Gamma Exposure (GEX) reading. Here's the breakdown:
* Gamma Wall (Resistance): $180–$182.50
* 2nd CALL Wall: $177.50 (69.5%) – key magnet
* Highest Positive NET GEX: $180 – breakout level for upside continuation
* Support Zone: $172.5 (Put Wall -31%)
* PUT Pressure Floor: $170–$167 range (3rd/4th PUT wall cluster)
🔧 Option Strategy Suggestion:
🎯 Bullish setup
* Consider 177.5c or 180c contracts (0DTE or 7/12 expiry) for quick moves if price holds above $175 and breaks $177.50.
* Scalp the range to $179–$180, trail stops near $174.80.
* Aggressive breakout players can aim for $182.50 if volume confirms.
🛑 Bearish hedge
* If price breaks $172.50 with strong volume, consider 170p or 167.5p targeting the lower PUT Wall zone.
* Keep stops tight above $174.96.
📊 1-Hour Chart – Price Action Breakdown
GOOGL recently flipped bullish with a BOS and a solid CHoCH confirmation. Price reclaimed a critical trendline and retested a fair value gap inside the green demand zone.
* Current Price: $176.45
* Key Demand Zone: $172.8–$174.9 (multiple FVG and liquidity sweep confluence)
* CHoCH + BOS combo: Indicates momentum shift
* Supply Zone (Resistance): $177.9–$179.7
* Trendline Breakout Retest Confirmed
🧭 If buyers defend above $174.9–$175, we could see a move toward $179.67 and possibly challenge the $181.96 high. A failure below $173.5 risks a full reversion to the prior range near $170.
🎯 Trading Plan Summary:
* Bullish Scenario:
* Entry: Above $177.50
* Target: $179.67 → $182
* Stop Loss: Below $174.96
* Bearish Scenario:
* Entry: Below $172.50
* Target: $170 → $167.5
* Stop Loss: Above $175.10
This analysis is for educational purposes only and does not constitute financial advice. Always do your own research and manage risk accordingly.

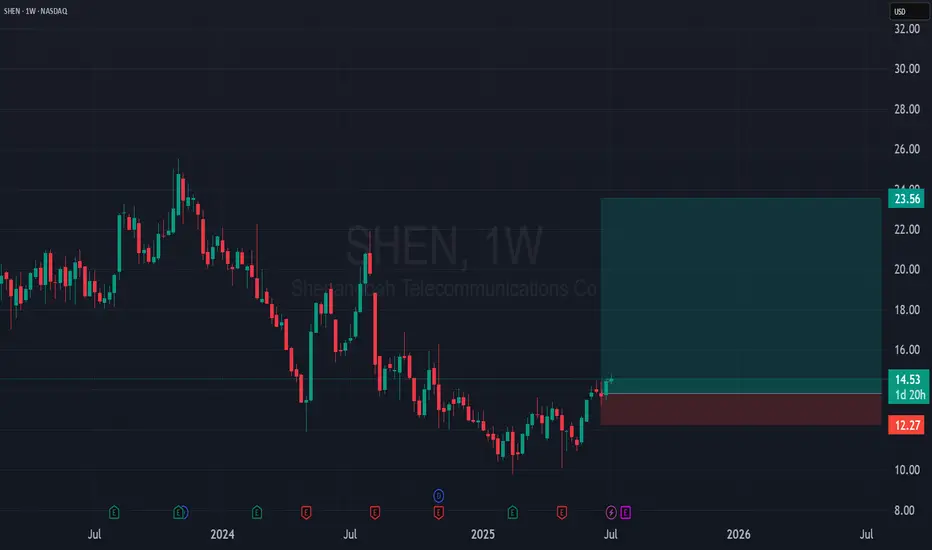
SHEN is bullish for the next few weeks first target 15.50 - 16$SHEN is bullish for the next few weeks
Following my analysis, there is a strong probability that the share will rise, although it is too risky to return to the market before the signal confirming the return of liquidity to the markets.
first target 15.50 - 16$
MSFT Charging Toward Resistance for July 10MSFT Charging Toward Resistance — What the Gamma Map Reveals for This Week’s Trading
🔍 GEX Analysis – Options Sentiment Outlook
MSFT’s current positioning reveals a relatively neutral options sentiment with slight bullish bias:
* GEX at $507.12 marks the highest positive gamma exposure and major resistance. It's also aligned with the 3rd CALL Wall and the Gamma Wall, making this level a magnet and a potential stall zone.
* Beneath price, multiple PUT walls form strong support between $487 and $490, with the final PUT Support down at $485.
* The HVL (High Volume Level) sits at $492.55, which now serves as an intraday support pivot.
* IVR is low at 21.6 and IVx avg is 22.2, showing little fear or demand for expensive protection, suggesting a stable grind rather than explosive moves.
📌 Options Strategy Suggestion:
* Bullish Setup: Use $500–$510 Call Spread (July 12 expiry) targeting the gamma wall at $507+. Entry is favorable as long as MSFT holds above $498.
* Neutral Setup: Consider Iron Condor between $490–$510 if price consolidates below $507.
📉 1H Technical Chart Insights
* MSFT recently confirmed a BOS (Break of Structure) after rejecting from the previous supply zone, now attempting to build a bullish continuation flag.
* A new demand zone has formed around $498–$500, which aligns with the GEX 2nd CALL Wall and short-term trendline support.
* Price is consolidating under the purple supply box, and a clean break over $503.50 could trigger a momentum run toward $507.12.
* Structure still holds a bullish bias as long as MSFT remains above the $496–$498 confluence zone, supported by prior CHoCH, trendline, and OB zones.
🧭 Trading Outlook
* Bullish Scenario: Break and hold above $503.50 could trigger a fast move toward $507–$510. Ideal entry: $502.50–$503. Stop-loss: Below $498. Target: $507.
* Bearish Rejection: If MSFT rejects at $503.50 and breaks below $498, it may revisit the demand zone at $492. Ideal PUT entry: break below $496. Target: $490.
Conclusion:
MSFT is sitting just under heavy gamma resistance with demand stacked below. Traders can prepare for a breakout continuation toward $507+ or a fade from resistance into $498–$492 support zone. Use options spreads or short-term directional plays based on the breakout or rejection setup.
This analysis is for educational purposes only and does not constitute financial advice. Always manage risk and confirm your setups before entering trades.

PLTR Poised for Gamma Squeeze? Here's the Key Setup-July 10📈 GEX Options Sentiment & Trade Strategy
Palantir (PLTR) is pressing into a high-compression zone on the Gamma Exposure (GEX) chart, where multiple call walls cluster between 143 → 146, with the strongest net positive GEX wall at 146, acting as the gamma squeeze ceiling. The 3rd call wall sits at ~145, and momentum is building with IVR 40.6, IVx avg 61.3, and a strong 40.8% bullish call-dollar dominance, signaling sustained call flow.
Crucially, there’s minimal put protection above current price, with most put walls far below at 130, 127, and a weak HVL at 133. This imbalance opens room for a potential gamma push toward 145–146, especially if the 143.17 intraday high breaks with volume.
💡 Options Trade Ideas:
* Bullish Setup:
145C (0DTE or 7/12 expiry) if price confirms over 143.50, targeting the 145–146 zone.
Ideal for a short squeeze continuation with trailing stops.
* Hedge/Defensive PUT:
135P if price rejects sharply at 143.50 and loses 140.5 support—risk-managed fade toward HVL at 134.
🔍 1H Chart Technical Outlook
PLTR is moving inside a rising wedge channel, maintaining a strong bullish market structure with back-to-back CHoCH → BOS confirming bullish intent. Price is consolidating under the supply zone near 143–144, coiled for a breakout attempt. The trendline holds firm, and volume is beginning to expand with each retest.
If price breaks and holds above 143.20, bulls can target 146, and even higher toward the channel resistance near 148.21. However, caution: a false breakout here could trap late bulls, so monitor for retest confirmation before chasing.
Support to watch sits at:
* 139.70 / 139.30 – minor support zone
* 137.40 – EMA + trendline confluence
* 134.52 / 133.00 – critical HVL and invalidation zone
✅ Summary & Trade Plan
* Bias: Bullish with gamma momentum, but nearing exhaustion zone
* Breakout Trigger: Above 143.20 → ride the gamma zone to 145–146
* Key Support: 139.70 / 137.40 (hold = healthy trend)
* Invalidation: Break below 134 = game over for bulls short-term
This analysis is for educational purposes only and does not constitute financial advice. Always do your own research and manage your risk accordingly.

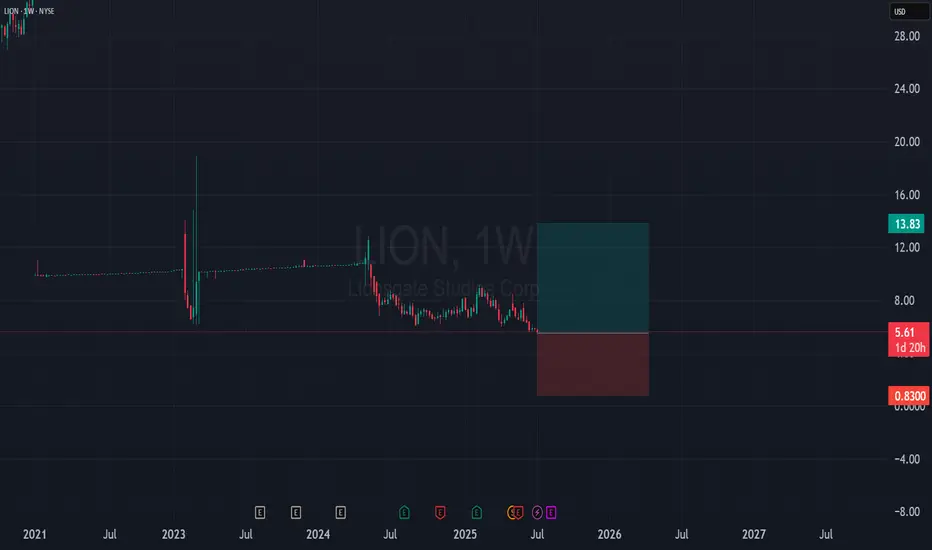
LION is bullish for the next few weeks first target 6.5 – 7.2$LION is bullish for the next few weeks
Following my analysis, there is a strong probability that the share will rise, although it is too risky to return to the market before the signal confirming the return of liquidity to the markets.
first target 6.5 – 7.2$
ASAN is bullish for the next few weeks first target 18–20$ASAN is bullish for the next few weeks
Following my analysis, there is a strong probability that the stock will rise, although it's too risky to return to the market before the signal confirming the return of liquidity to the markets.
first target = 18 – 20$

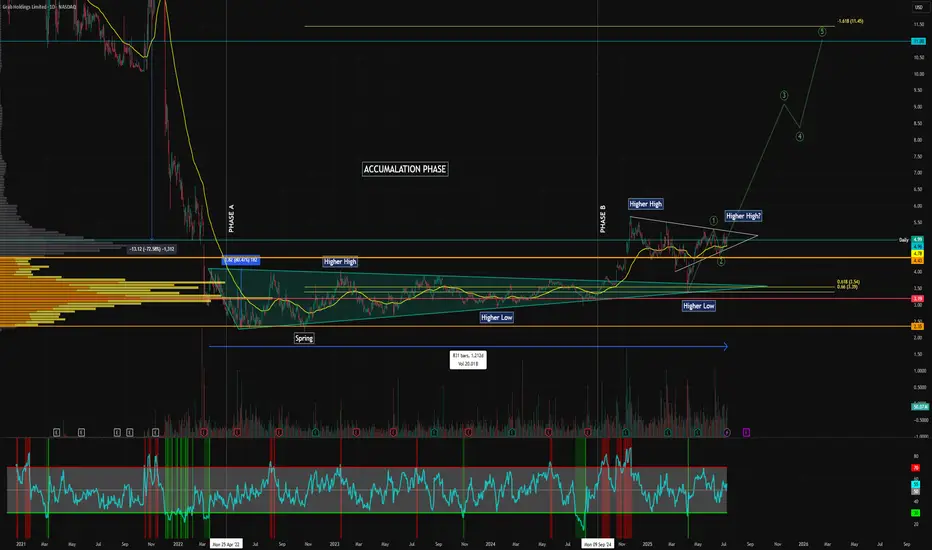
Grab - About to Launch?I like what i'm seeing here on the Grab chart, it's grabbed my attention. It very much reminds me of the way the Robinhood chart looked around $8, before it began an epic return to all time highs. Does Grab have the potential to become a multi bagger? Let's examine the chart..
In Phase A the early IPO investors either took huge losses or became bag holders. This is typical of many charts I have analysed. The stock price dropped almost 90%.
We are now in Phase B, the accumulation phase. 1212 days of sideways action, the stock has not broken out of this range in a long time. But there is positive signs as the previous range is now holding as support.
We broke out of a triangle pattern from the lows and appear to be putting in higher highs and higher lows on the daily time frame. This suggests that interest is returning to this stock and buyers are accumulating. We have broken out of the previous range and back tested the golden pocket as support. Grab will have to hold $5 as support, if that does happen then could be more upside to come. I'd like to see more volume come in and a breakout from this wedge before going long.
Not financial advice, do what's best for you.
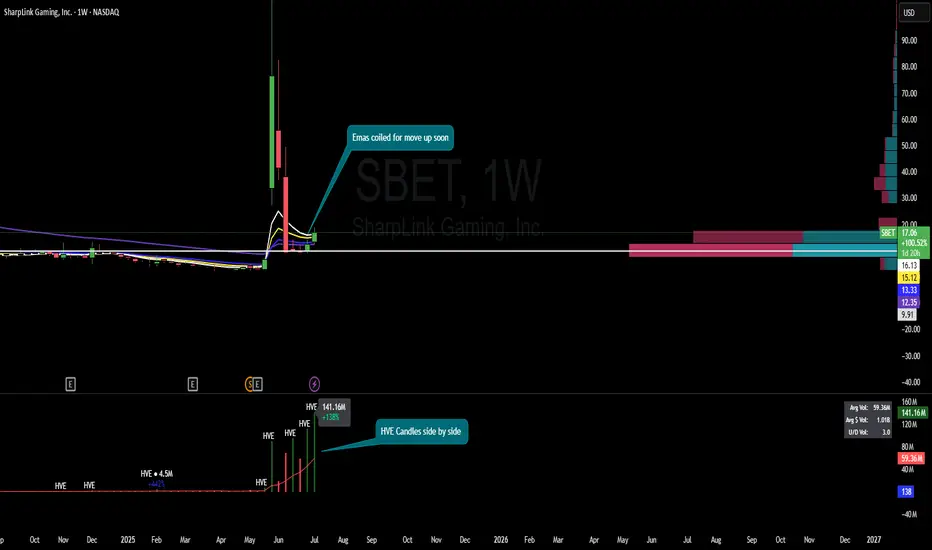
$SBET $40 pt NASDAQ:SBET after initial spiked up it has sold out. But now is in accumulation phase. Weekly tf had HVE candle which shows pure accumulation. Also weekly ema looks coiled for move up. My pt is $40 on 2 weeks horizon.
$RIVN - Long Setup BrewingRivian just broke out of a long-term downtrend and is now retesting that previous resistance as support. Price is coiling inside a falling wedge, sitting right above a key structure zone around $13. This area held strong in the past and could act as a launchpad if momentum steps in.
A breakout above the wedge could send it toward $17 in the short term, and if volume supports the move, there's potential for a much larger run toward $28. Watching for confirmation and strength on the retest — this setup looks like it's getting ready.
Not financial advice. Just sharing the chart.
#RIVN #SwingTrade #BreakoutSetup #TradingView #EVstocks

Important Volatility Period: Around August 21
Hello, traders.
If you "Follow", you can always get the latest information quickly.
Have a nice day today.
-------------------------------------
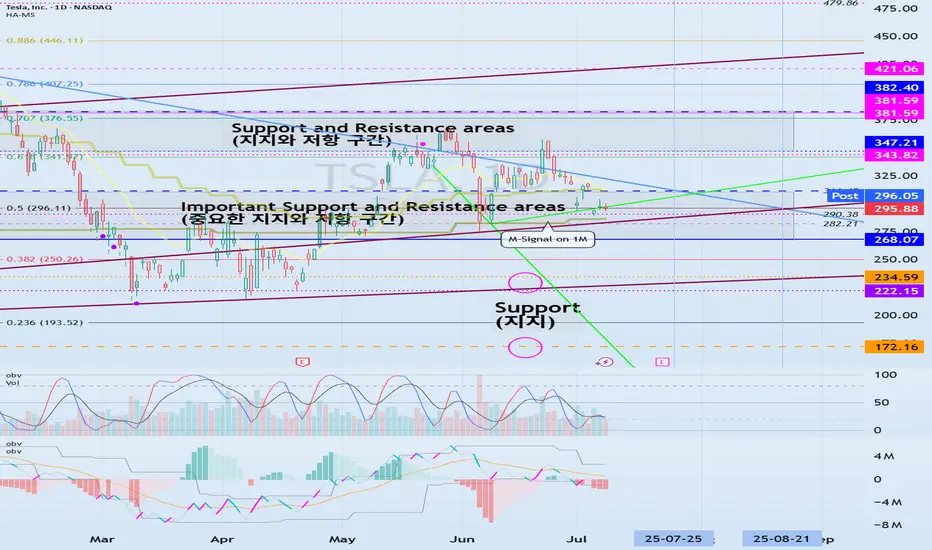
(TSLA 1D chart)
The medium-term trend is maintaining an uptrend.
However, if the price falls below the M-Signal indicator on the 1M chart and maintains, there is a possibility of a downtrend, so caution is required.
The support zone is
1st: 222.15-235.59
2nd: 172.16
Around the 1st and 2nd above.
The 268.07-311.48 zone is an important support and resistance zone.
If the price is maintained above this zone, there is a high possibility that a full-scale upward trend will continue.
However, since a resistance zone is formed in the 347.21-382.40 zone, we need to look at how this zone is broken upward.
-
When it falls to the 172.16-234.59 zone, we need to find a time to buy.
If not, we need to buy when it shows support in the 268.07-311.48 zone.
It would be better to buy at a lower price, but since the investment period will inevitably be longer, I think it is better to buy when an upward trend is detected.
-
The important volatility period is around August 21st, but before that, we need to check the movement around July 25th.
If it falls below 268.07 after August 21st, it could lead to further decline.
If it rises above 311.48 and maintains the price during the movement around July 25th, it could lead to further increase and it seems likely to create a trend after the volatility period around August 21st.
-
Thank you for reading to the end.
I hope you have a successful trade.
--------------------------------------------------


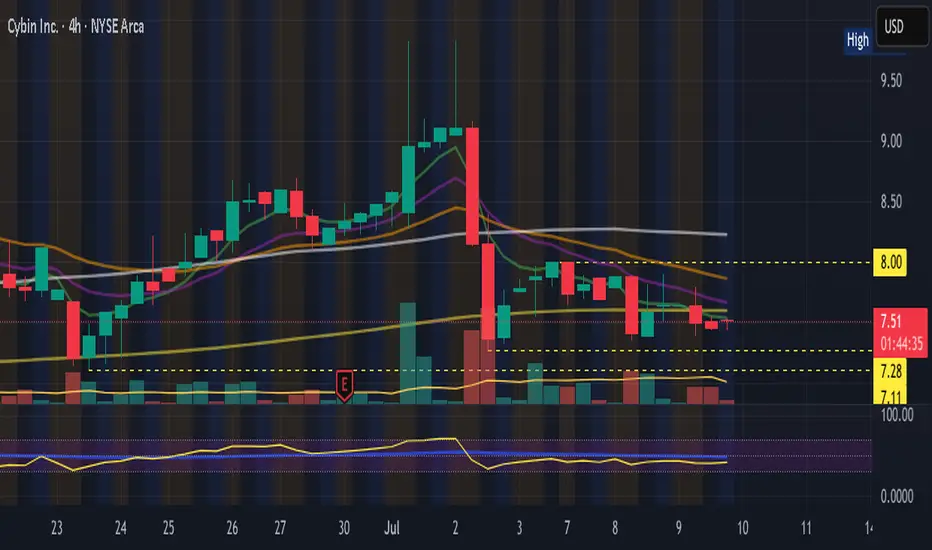
CYBN in sideways channel, bulls need to break above 8.01Nothing changes for me between 7.11 and 8.01. Break below and I will stop out of my swing and be very patient while I reassess, break above 8.01 and we look for a lower high below 9.83. Currently, 4hr EMA12 continues to be resistance on each little bounce attempt.
If you are bullish here, you have decent entry opportunity to play off of 7.11 support with a stop loss below that - you'll certainly be in a much better position with your position than I am with mine on this stock!
CMPS riding 4hr EMAsCMPS continues it's slow grind uptrend riding the 4hr 12EMA which hasn't been lost since reclaiming it a few days after the news dump. The daily chart is a stair-step (a higher low each consecutive candle) since the low of the dump and while notable, for me the guide is when the 4hr chart no longer rides the EMA12 upwards. Bottom to top of the bounce is now 66% and counting, and we know that healthy daily consolidation will come sooner or later.

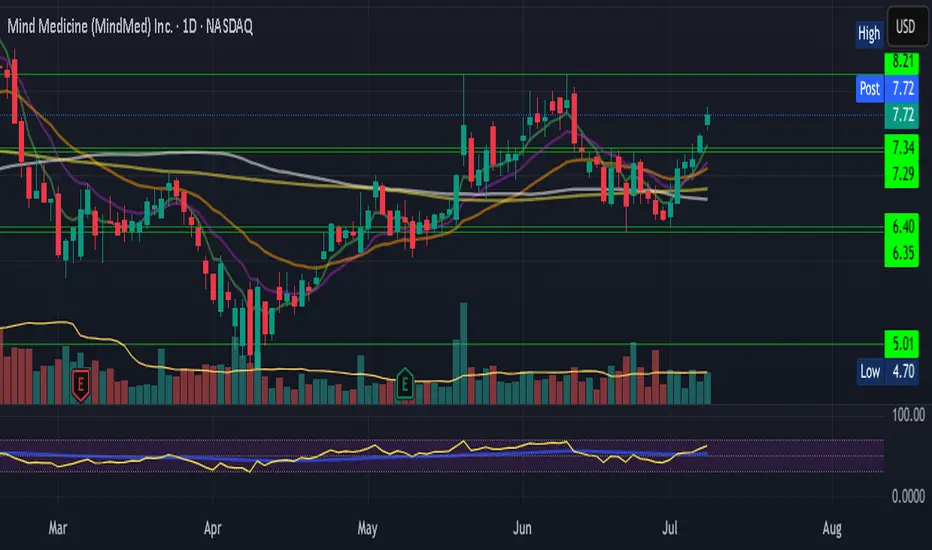
MNMD on the cusp of a lower volume nodeMNMD closed July 8th with the most bullish candle since May 19th, finally giving us a convining break of the daily equilibrium, and resulting in a gap up and run this morning with another solid day up over 3%. Today's high rejected from the top of the current high volume node mentioned in my weekend video (7.80), above this there isn't much resistance until the weekly resistance doubletop at 8.21. Hourly RSI is entering into typical pullback areas over the last 6 months so we will be watching the hourly uptrend for clues on pullbacks if we are seeing healthy hourly consolidation or looking for a daily consolidation.
ATAI consolidating in a 4hr channelATAI has been consolidating sideways on the daily chart for the last 5 days, in a confined channel on the 4hr chart. The channel levels are denoted by yellow dotted lines. This consolidation remains constructive above the last weekly resistance at 2.64, denoted by the solid white line. There is a LOT of volume being traded here (check it out yourself using Volume Profile) which can potentially be a bearish P-shaped volume profile, so bulls want to see a strong push upwards towards $3.00 sooner rather than later. Still, the consolidation remains constructive at this point in time while the market digests the giant gap up and breakout on the back of readout July 1st.

Bank of America Wave Analysis – 9 July 2025
- Bank of America reversed from resistance area
- Likely to fall to support level 45.00
Bank of America recently reversed down from the resistance area located between the long-term resistance level 50.00 (which started the weekly downtrend at the start of 2022) and the upper weekly Bollinger Band.
The downward reversal from this resistance area stopped the previous intermediate impulse wave (3) from the start of 2025.
Given the strength of the resistance level 50.00 and the overbought weekly Stochastic Bank of America can be expected to fall to the next support level 45.00.

MTH (Meritage Homes) – Position Trade Setup📈 Symbol: MTH (Meritage Homes)
📊 Timeframe: Daily Chart
📍 Strategy: Position Trade (Weeks to Months)
🎯 Trade Setup
Entry Zone: $74.00 (Current breakout level / near SMA 20)
Stop-Loss (SL): $65.74 (Below key support & SMA 50)
Take-Profit (TP): $92.70 (ATH Resistance & +25% upside)
Risk-Reward Ratio: 1:2.5
📊 Technical Analysis
✅ Trend: Strong uptrend (Higher highs & higher lows).
✅ Moving Averages: SMA 20 > SMA 50 (Bullish alignment).
✅ RSI (14): ~65 (Healthy momentum, no overbought signal).
✅ MACD: Bullish crossover & histogram expanding.
✅ Volume: Rising on upward moves (Confirms buying interest).
Key Levels:
Support: $70 (SMA 20), $65.74 (Strong Swing Low).
Resistance: $78 (Recent High), $92.70 (All-Time High Target).
💰 Fundamental Backing
Strong Financials: Low debt (Score 10), undervalued P/E & P/S ratios.
Revenue Growth: Steady performance in housing sector.
Institutional Interest: Increasing accumulation.
⚡ Trade Execution Plan
1️⃣ Entry: $74.00 (Break of consolidation).
2️⃣ Stop-Loss: $65.74 (Protects against trend reversal).
3️⃣ Take-Profit: $92.70 (Scale out partials at $78 and $85).
4️⃣ Trailing Stop: Adjust SL to breakeven at $78.
📌 Why MTH?
Strong sector outlook (Housing demand remains high).
Technically & fundamentally aligned for a multi-week rally.
Clear risk management with 1:2.5 RR.
🎯 Verdict: BUY MTH at $74, SL $65.74, TP $92.70.
🔔 Follow for more trade ideas!
👍 Like & Comment if you agree!
#TradingView #Stocks #MTH #PositionTrading #RealEstate #SwingTrading
(Disclaimer: Not financial advice. Do your own research.)

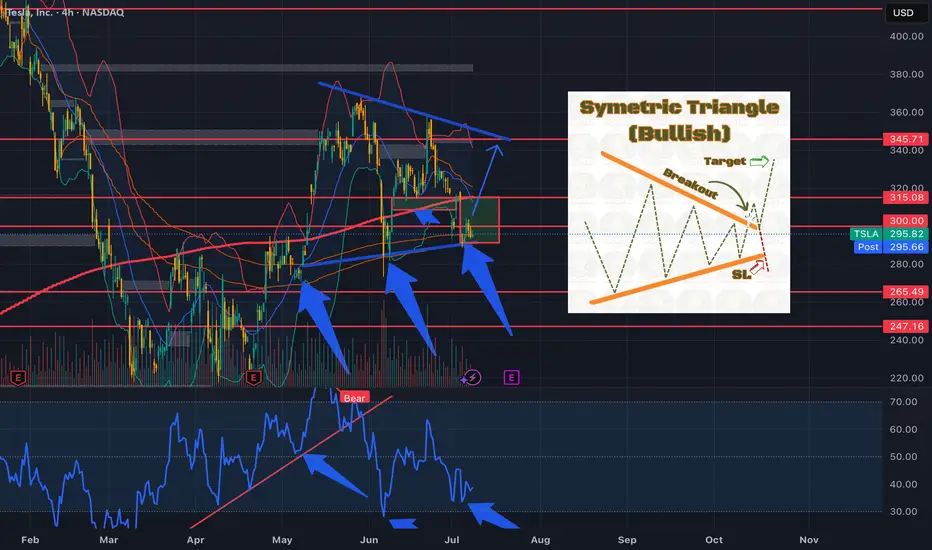
TSLA....Symetric Triangle....Earnings Rally?Could we see the bulls step in and leads us into earnings?
Valuation of the company's patentsThe company has 90 patents to date, each worth about $2 million at current market value, half the typical $5 million value of patents in this industry.
