Airbnb: Downtrend Set to Resume SoonSince our last update, Airbnb has experienced a rebound, which diverted the stock from the anticipated sell-off. However, the price is expected to soon resume its downward trajectory and, as the next key step, break through support at $108.60. This move should complete turquoise wave 3, with all subsequent waves of this downward impulse likely to unfold below this level. Ultimately, the stock is expected to finish the broader correction of the beige wave II.
📈 Over 190 precise analyses, clear entry points, and defined Target Zones - that's what we do.

WYNN SELL!!$97.49 first target. I believe it can see $117 on this stent so its a good place to start a position and add at $113, $115 and $117 if seen

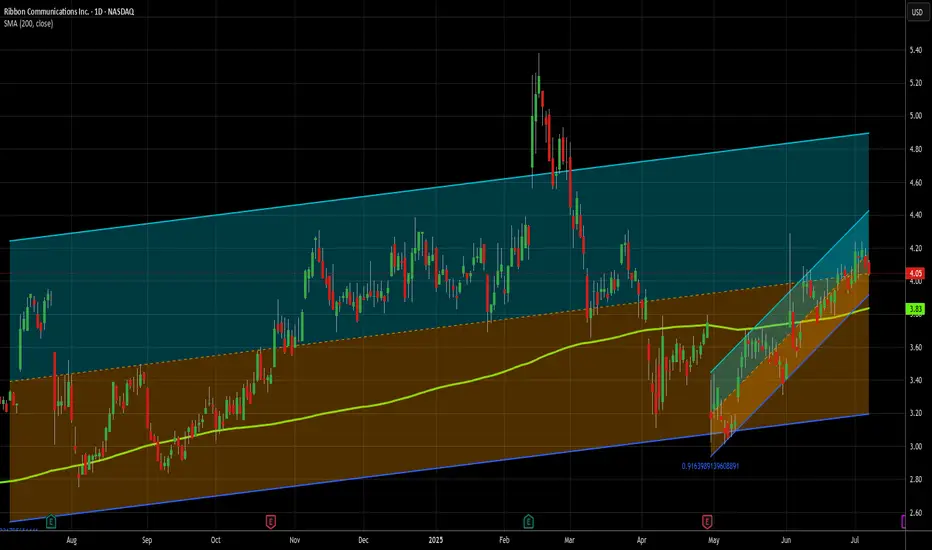
Small cap is the flavor of the day - Long at 4.05I decided to do a small cap stock today. I don't use too many of these as ideas, though I do trade them on my own. I don't usually publish about them because they are inherently more risky than large cap, established stocks. And to be fair, RBBN has a spotty history from a chart perspective.
Go ahead and zoom on out all the way. See that? That's what danger looks like. This stock has lost 80% of its value in the last 10 years, and 50% in the last 4. However, in its defense, it is profitable on a reported earnings basis over the last 12 months, and has held its own for several years now, and that's why I'm not AS nervous as I might otherwise be publishing this.
Additionally, it's solidly above its 200MA and in both a 1 year and 2 month uptrend, so its recent strength is good. I haven't dug down all the way back to its debut, but I suspect I'd have at the very least had a challenge making money on this one over its entire existence. But I am not trading its entire existence today. 75% of the trades in this stock in the last year would have closed in under 2 weeks, so the short term picture is what I'm mostly looking at here, and over the last month or so this has been a very solid stock. Could that change tomorrow? Yup. But I don't have that crystal ball. All I can do is rely on the system that has of late produced excellent results here.
In the last 12 months, there have been 27 buy signals here. 25 closed profitably and 2 are still open and down 18% and 9%, respectively. INCLUDING the losers, however, the median daily return on those trades has been .48% (>10x the market avg) and the average daily return is 1.02% (> 23x the avg daily market return).
Trading is about balancing risks and rewards. This stock is riskier than most, but the rewards are a lot better, too. I don't put all my money into any one trade - that's a TERRIBLE idea. The vast majority of my open trades are relatively safe, large cap stocks. But risky has its place in a portfolio. I made 15% in 2 days recently on QUBT (I posted that trade here) and made almost 18% on NUTX in the last 2 days - just closed that trade today. As a % of my portfolio of trades, ones like that can be small positions, but make a meaningful impact. That's my hope for RBBN here.
Of the 25 winning trades in the last year, over half produced a gain of 4% or more. And the average holding periods of the winners was only 8 days, with 15 of the 25 closing in a week or less. That rapid return also reduces the risk in a stock like this one. Wnen you only stick around for a few days most of the time, it's harder (not impossible) to get caught holding the bag during a drop.
My close will be signal based, and not a particular price target, but the trades I referred to above on RBBN give a good outline. However, the 2 losers have been open since February, so be forewarned that IF you follow me on this one, you might need to buckle your chinstrap. It could get bumpy.
As always - this is intended as "edutainment" and my perspective on what I am or would be doing and why, not a recommendation for you to buy or sell. Act accordingly and invest at your own risk. DYOR and only make investments that make good financial sense for you in your current situation.
SMCI soon above 50 USD! Big bullish move! Youppi!📍 Bullish Trigger Zone: $50 USD
- 🔑 The $50 level acts as a psychological and technical threshold. A breakout above this resistance could signal a bullish reversal.
- 📈 The current price is around $49.11, so it’s very close to the trigger. A daily close above $50 with strong volume would strengthen the buy signal.
- 🧭 Technical indicators (based on TradingView): Moving averages and oscillators are neutral to slightly bullish.
🎯 Sell Zone: $60 to $73 USD
- 🟢 $60: First realistic target for cautious traders. It’s an intermediate resistance zone.
- 🟡 $65: A middle-ground target for those looking to optimize without too much risk.
- 🔴 $73: Ambitious target, marked on your chart with a green arrow. Ideal for more patient investors or those confident in the trend.
🔍 Fundamental Context
- 💬 Analysts are mixed: some maintain targets around $50–60, while others are more conservative.
- 📉 The stock has seen a sharp correction in recent months, but the current rebound could mark a reversal if confirmed by volume.
🧠 Suggested Strategy
| Price Level | Recommended Action | Emoji |
| < $50 | Watch / Wait for confirmation | 👀 |
| $50–60 | Gradual buying / Swing trade | 🛒 |
| $60–65 | Partial profit-taking | 💰 |
| $65–73 | Full exit or trailing stop | 🚀🔚 |
The information and publications are not meant to be, and do not constitute, financial, investment, trading, or other types of advice or recommendations.
Thank you!
Subcribe to TSXGanG! 🧠🎯

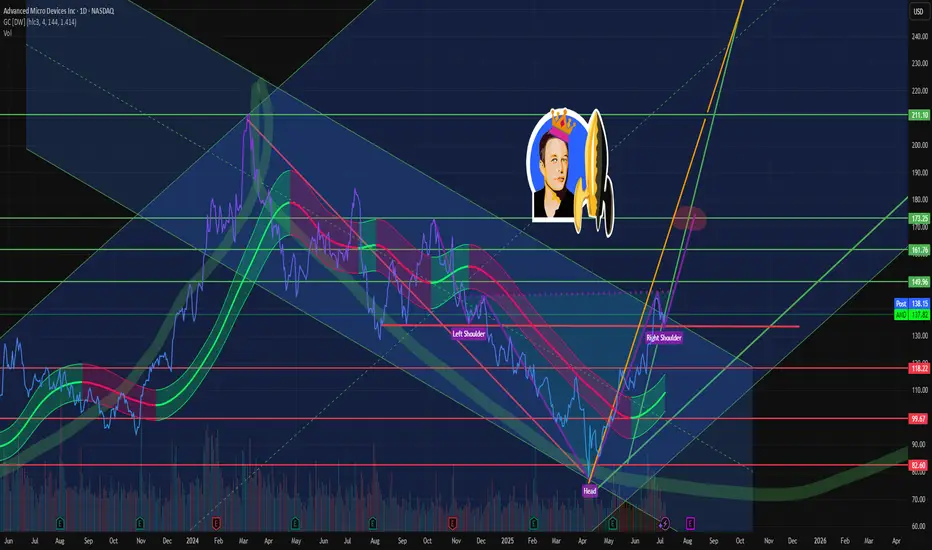
-This zone of 138 USD is really important-AMD📈 AMD Technical Analysis – Bullish Breakout in Sight?
"We are currently testing the parallel channel at $138 for a potentially very bullish confirmation afterward. If confirmed, I would set a target at $170 USD."
🔍 Let’s break it down:
- 🧭 Key Level at $138: AMD is hovering around a critical resistance level within a well-defined parallel channel. This zone is acting as a decision point—either we break out with strength or face a pullback.
- 🧠 Head and Shoulders Pattern: The chart shows a classic inverse head and shoulders formation (Left Shoulder – Head – Right Shoulder), which is typically a bullish reversal signal. If the neckline (around $138) is broken with volume, it could trigger a strong rally.
- 🚀 Bullish Confirmation: A confirmed breakout above $138, especially with strong volume and momentum indicators turning positive, could ignite a powerful uptrend. This would validate the bullish thesis.
- 🎯 Target at $170: If the breakout is confirmed, a price target of $170 is ambitious but realistic. It aligns with the upper bounds of the projected move from the head and shoulders pattern and the channel extension.
- 🛑 Risk Management: As always, keep an eye on false breakouts. A failure to hold above $138 could lead to a retest of lower support levels.
💡 Final Thoughts: AMD is at a technical crossroads. A breakout above $138 could be the spark for a major bullish run toward $170. Keep your eyes on volume, momentum, and confirmation signals. This could be a textbook setup for swing traders and long-term bulls alike. 📊🔥
The information and publications are not meant to be, and do not constitute, financial, investment, trading, or other types of advice or recommendations.
Thank you!
Subcribe TSXGanG! 💡🎯
American Express Wave Analysis – 8 July 2025
- American Express reversed from key resistance level 325.00
- Likely to fall to support level 310.00
American Express recently reversed from the resistance area between the key resistance level 325.00 (which stopped the sharp daily uptrend in January) and the upper daily Bollinger Band.
The downward reversal from this resistance zone created the daily Bearish Engulfing, which stopped the previous minor impulse wave 3.
Given the strength of the resistance level 325.00 and the overbought daily Stochastic, American Express can be expected to fall to the next support level 310.00.

Disney Wave Analysis – 8 July 2025- Disney reversed from multi-month resistance level 123.60
- Likely to fall to support level 114.90
Disney recently reversed from the strong multi-month resistance level 123.60 (which is the upper border of the sideways price range inside which the price has been trading from 2022) standing near the upper weekly Bollinger Band.
The resistance level 123.60 was further strengthened by the 38.2% Fibonacci correction of the sharp weekly downtrend from the start of 2021.
Disney can be expected to fall to the next support level 114.90 (former low of the primary correction 2 from May).

$U (Unity) — Breakout Into Premium Zone 📈 $U (Unity) — Breakout Into Premium Zone 🚀
Timeframe: 1D | Date: July 8, 2025 | Powered by WaverVanir DSS + SMC Framework
Unity ($U) just broke above a multi-month trendline and reclaimed structure with authority. Today's volume-backed candle has propelled price directly into the Premium zone, challenging the $28.28–31.34 range.
🔍 Technical Breakdown
✅ CHoCH + BOS Combo confirmed since late May
📈 Volume Spike (23.7M) → confirms institutional participation
🟥 Premium Zone Target: $31.34 (1.236 Fib)
⚡ Post-market sitting at $29.45 — breaking above trendline resistance
🔵 Equilibrium Zone: $23.50–25.50 (key reload area if pullback)
📍 Major Extension Target: $41.27–42.00 (Fib 2.0+) if continuation sustains
🧠 Macro Context
$U trading at historic lows, high short interest
AI & gaming convergence narrative gaining traction (Unity as infra layer)
Risk appetite rotation into small/mid-cap tech + software infrastructure plays
🧭 Bias: LONG (Momentum-Driven Breakout)
VolanX Signal Score: 79%
Risk Management:
Entry: $28.80–29.50
Stop: Below $26.50
TP1: $31.34
TP2: $39.34
TP3: $41.27
This move could evolve into a mid-term trend reversal, with $U now reclaiming its narrative and structure. Eyes on follow-through above $30. Let price validate.
📛 Not Financial Advice – For Educational Use Only
#Unity #U #BreakoutTrade #SmartMoneyConcepts #Fibonacci #LiquiditySweep #VolanX #WaverVanir #TradingStrategy #SMC #VolumeSpike #TechnicalAnalysis #TradingView

$MAN to the moon! Monthly RSI hit 30; will hit $65-75 in 60 daysNYSE:MAN has repeatedly gone up in huge ways every single time the monthly RSI has crossed below 30. We have now seen back to back months dipping below and now it’s on its way up already!
Check its history and you’ll see that typically within 2-3 months after it breaks the 30RSI it goes up 50-150% in price within just a few months! Some of those times it doubled in just 2 months.
History repeats itself and I don’t want anyone missing this one! $50 strike calls for September/December will pay handsomely. Short term grab $55 July calls for just .10-.15 each as they have earnings the day prior to the contract expiring—lots of volume on that strike also compared to all other strikes/monthly contracts.
I am going “all in” on this trade and will be buying 500 of the December $50c. I expect to more than double my position by the end of September.

7/8/25 - $srfm - Back to algebra for some...7/8/25 :: VROCKSTAR :: NYSE:SRFM
Back to algebra for some...
- welp. as a pretty well-versed trader/investor/speculator and "time spent-er" on NASDAQ:BLDE over the last years (no position currently), i've known chitco "comp" surf as well
- of course V turned over this rock
- and what i saw... was a bagel
- as of my writing this today, it's almost hard to imagine this thing is worth more than NASDAQ:BLDE
- half the revenue, half the margin... half the mgmt credibility
- at $2 you're probably overpaying by $2-ish.
- so if you're looking at this, do yourself a favor, "pass". and you're welcome.
- a lot of our business is the option nobody talks about. "pass"
- do it with conviction.
- enjoy your bagel (or donut), but don't let your PnL become one.
V

MRNA looking strong at cmpModerna remains in a precarious transition phase—from COVID-revenue dependency toward a diversified vaccine portfolio. Technically, momentum favors upside in the short-term, but fundamentals and macro-regulatory factors suggest caution. If its RSV and flu/COVID combo rollouts succeed and regulatory support stabilizes, it could rebound toward analyst targets near 60. Otherwise, expect choppier consolidation or downward pressure.

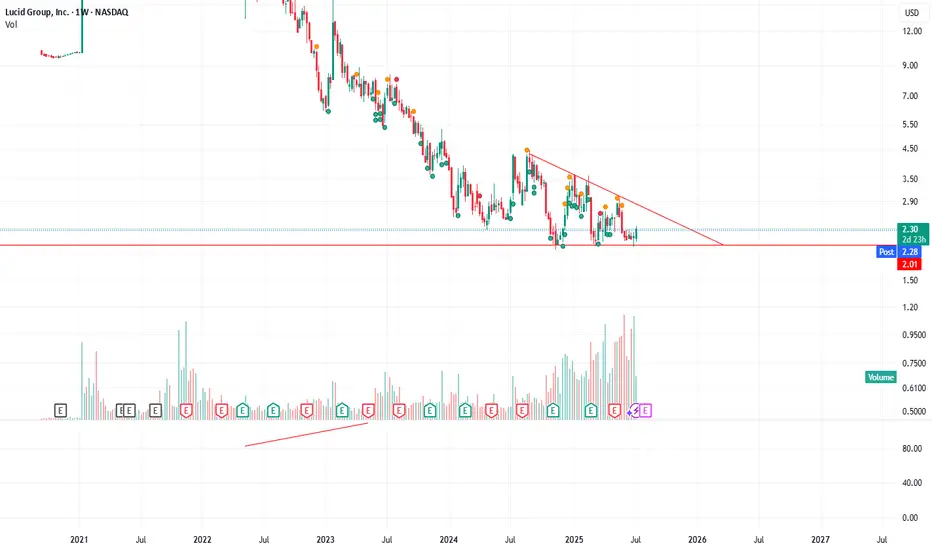
LUCID going to benefit from recent policy changes Lucid is positioned to enjoy a short-term uplift from the policy change due to its EV-only model and lower volume compared to peers. However, its longer-term success depends on execution—scaling manufacturing, launching key new models, and moving toward profitability in a future without subsidies.
AAPL needs to break above 213 to start an upward moveAAPL needs to break above 213 to start an upward move
From our previous analysis, the price increased by almost +8% from 200 to 216.
The resistance zone, which was also our first target, stopped the price near 213.50, but again the bullish volume seems to be high and there is a good chance that AAPL will continue to rise further.
A clear move above 212.5 should push AAPL higher to 224.50; 240 and 257.
You may find more details in the chart!
Thank you and Good Luck!
PS: Please support with a like or comment if you find this analysis useful for your trading day
Previous analysis:

CRM Bullish ThesisPOC @ $273.74
ATH was $369 back in December 2024.
ORCL had new ATH a few days ago, and other AI and Cloud names also.
Cloud Service is robust.
MACD on the 5Day Crossing and Curling
Fib 0.618 @ $271 turned into Support, (this Fibo retracement was taken from last move from May 2024 Low to ATH Dec 2024 $369)
First Target next Huge Resistance @ 0.5 Fib $289.98 Which coincides with AVWAP from ATH
Next Earnings 20 August, which might work as a Catalyst.
What Else? Volatility is High so Beware because as always: Anything can Happen.
My Plan: August 2025 290 Calls

7/7/25 - $tsla - 20% position.7/7/25 :: VROCKSTAR :: NASDAQ:TSLA
20% position.
- that's the message... refer to prior msg "buying all dips"
- u do u
V

Carvana Leading Auto Retail – Outpacing LAD & AN-Financial Performance & Momentum:
Carvana reported a record-breaking adjusted EBITDA of $488M in Q1 2025, up $253M YoY, with an EBITDA margin of 11.5% (+3.8pp YoY). The company's strong operational efficiency positions it as a leader in the auto retail industry, nearly doubling the margins of competitors like Lithia Motors (LAD) and AutoNation (AN).
- Competitive Positioning & Growth Outlook:
Carvana’s EBITDA quality is superior due to lower non-cash expenses, enhancing long-term sustainability. The company expects sequential EBITDA growth in Q2 and targets 13.5% EBITDA margins within 5-10 years.
-Peer Comparison:
- Lithia Motors (LAD): EBITDA margin at 4.4% (up from 4% YoY), facing tariff-related headwinds that could impact pricing and demand.
- AutoNation (AN): SG&A as a percentage of gross profit rose to 67.5% in Q1, expected to stay between 66-67% in FY 2025, pressuring margins further.
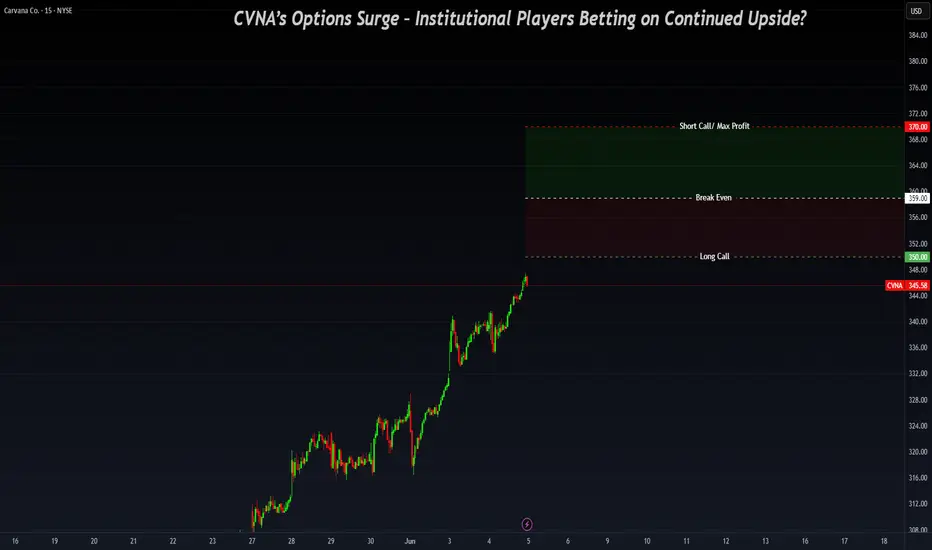
-Options Flow & Institutional Activity - Key Levels: $350/$370
Recent institutional flow activity indicates strong positioning around $350/$370 strikes, potentially signaling a vertical spread in play rather than outright selling:
1️⃣ Momentum Confirmation:
- CVNA has strong upside momentum following its Q1 results, reinforcing a bullish outlook for near-term price action.
- Institutional traders may be accumulating bullish vertical spreads rather than unwinding positions.
Vertical Spread Setup ($350/$370 Strikes)
- Long Call ($350 Strike) → Signals expectations for further upside.
- Short Call ($370 Strike) → Caps max profit while reducing cost.
- Breakeven Price: $359 → CVNA must close above $359 for profitability.
Profit & Risk Zones
- Above $370: Maximum profit achieved.
- Between $359-$370: Partial profit zone (spread remains in play).
- Below $359: Spread loses value, making recovery dependent on extended upside momentum.
7/2/25 - $btcs - Given sbet and bmnr... this?7/2/25 :: VROCKSTAR :: NASDAQ:BTCS
Given sbet and bmnr... this?
- 14,600 eth = 35 mm usd? and mkt cap is like 50... so that's another 1.5 mnav
- it's even smaller, no options... and we see what low float stuff does lately
- add to this the "comps" (quotes b/c this one is substantially smaller) like sbet and bmnr have run (and continue to run today)
- nevermind this has an actual software biz associated w it (and hold your nose if analyst recommendation for growth are adequate for revenue)... but there's something else here
- and their metamask "partnership" whatever that means.
i think this one could run substantially if sbet and bmnr keep up the whacky action (fortunately we're doing well on sbet at the moment)
V

Nvidia - New all time highs!Nvidia - NASDAQ:NVDA - breaks out now:
(click chart above to see the in depth analysis👆🏻)
Within two and a half months, Nvidia rallied more than +70%. Following this recent bullish strength, a retest of the previous highs was totally expected. But this does not seem to be the end at all. There is a much higher chance that we will see new all time highs soon.
Levels to watch: $150
Keep your long term vision🙏🙏
Philip (BasicTrading)

Tesla -> The all time high breakout!🚗Tesla ( NASDAQ:TSLA ) prepares a major breakout:
🔎Analysis summary:
Not long ago Tesla perfectly retested the major support trendline of the ascending triangle pattern. So far we witnessed a nice rejection of about +50%, following the overall uptrend. There is actually a quite high chance that Tesla will eventually create a new all time high breakout.
📝Levels to watch:
$400
🙏🏻#LONGTERMVISION
Philip - Swing Trader

UBER longBroken long term resistance, retested, and once again pushed 20 day Donchian Channel.
Turtles are coming out of their shells taking UBER to the new ATHs.
Long term hold.
