KALV FDA approval rallyKALV received FDA approval this week for a new drug, has $220mln in cash, and just bounced off the daily 21EMA (overlayed on this 4H chart).
Recently rejected off the monthly 100ema two times (overlayed on this 4H chart). Breakout beyond the monthly 100ema and first target is $20. Numerous price target increases, most notably, one at $27 and another increased from $32 to $40.

SMCI: The Monthly Chart says it ALL
Stochastic is way oversold.
MACD is converging.
RSI is converging back up.
Would not be surprised to see this soar back towards the CRT value of $65, then take on new challenges back towards it previous ATH of $122.90 in March, 2024.
Regards,
Terrapins

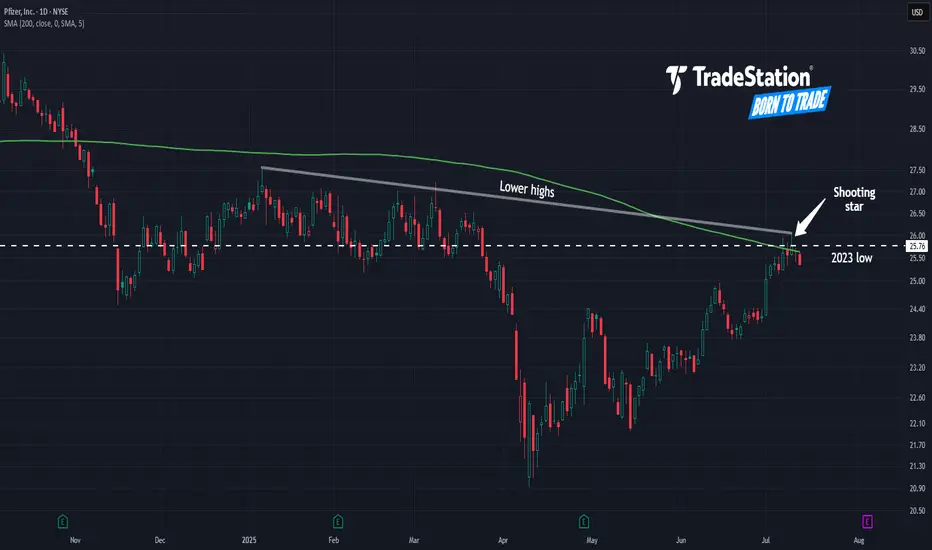
Pfizer May Be StallingPfizer has limped higher since April, but some traders may think the pharmaceutical giant is at risk of stalling.
The first pattern on today’s chart is the series of lower highs since January. PFE potentially just made another lower high at this falling trendline, which may suggest resistance is taking effect.
Second, the peak is occurring near the 200-day simple moving average. That could indicate its long-term trend is pointing lower.
Third is the 2023 low of $25.76. At the time, it was the lowest price in the preceding decade. After spending more than a year on either side of this level, PFE is now stalling in the same area. Has old support finally turned into new resistance?
Fourth, the candles of July 8 and July 10 showed prices trying and failing to cross the same long-term level. Such “shooting star” candlesticks may be short-term reversal patterns.
Finally, PFE is an active underlier in the options market. (It’s averaged more than 90,000 contracts per session in the last month, according to TradeStation data.) That might help traders take positions with calls and puts.
TradeStation has, for decades, advanced the trading industry, providing access to stocks, options and futures. If you're born to trade, we could be for you. See our Overview for more.
Past performance, whether actual or indicated by historical tests of strategies, is no guarantee of future performance or success. There is a possibility that you may sustain a loss equal to or greater than your entire investment regardless of which asset class you trade (equities, options or futures); therefore, you should not invest or risk money that you cannot afford to lose. Online trading is not suitable for all investors. View the document titled Characteristics and Risks of Standardized Options at www.TradeStation.com . Before trading any asset class, customers must read the relevant risk disclosure statements on www.TradeStation.com . System access and trade placement and execution may be delayed or fail due to market volatility and volume, quote delays, system and software errors, Internet traffic, outages and other factors.
Securities and futures trading is offered to self-directed customers by TradeStation Securities, Inc., a broker-dealer registered with the Securities and Exchange Commission and a futures commission merchant licensed with the Commodity Futures Trading Commission). TradeStation Securities is a member of the Financial Industry Regulatory Authority, the National Futures Association, and a number of exchanges.
Options trading is not suitable for all investors. Your TradeStation Securities’ account application to trade options will be considered and approved or disapproved based on all relevant factors, including your trading experience. See www.TradeStation.com . Visit www.TradeStation.com for full details on the costs and fees associated with options.
Margin trading involves risks, and it is important that you fully understand those risks before trading on margin. The Margin Disclosure Statement outlines many of those risks, including that you can lose more funds than you deposit in your margin account; your brokerage firm can force the sale of securities in your account; your brokerage firm can sell your securities without contacting you; and you are not entitled to an extension of time on a margin call. Review the Margin Disclosure Statement at www.TradeStation.com .
TradeStation Securities, Inc. and TradeStation Technologies, Inc. are each wholly owned subsidiaries of TradeStation Group, Inc., both operating, and providing products and services, under the TradeStation brand and trademark. When applying for, or purchasing, accounts, subscriptions, products and services, it is important that you know which company you will be dealing with. Visit www.TradeStation.com for further important information explaining what this means.
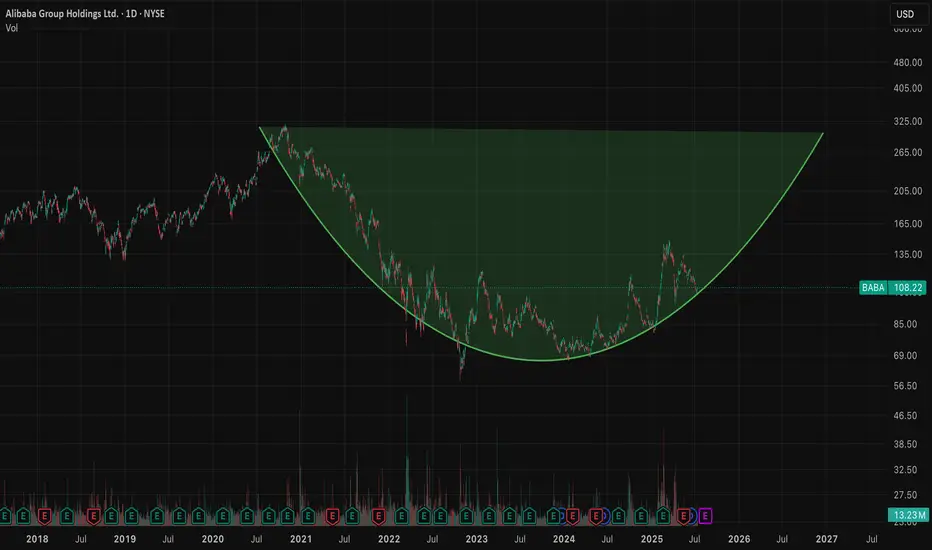
$BABA 160+ before year end looks realistic thanks $NVDA- NASDAQ:NVDA export ban lifted for China will be beneficial for NASDAQ:NVDA for sure but main advantages would be for NYSE:BABA as they can get the shovels from the shop as well so that they can compete in Gold Rush and compete with NASDAQ:GOOGL , NASDAQ:META and other private companies like Open AI and Anthropic.
- There are good universities in China and NYSE:BABA is regional big tech in China which gets great talent. I'm confident that NYSE:BABA would be able to compete with NASDAQ:META & NASDAQ:GOOGL in building LLMs even better with this export ban lift.
- Long NYSE:BABA and short/avoid NASDAQ:META ( overvalued )
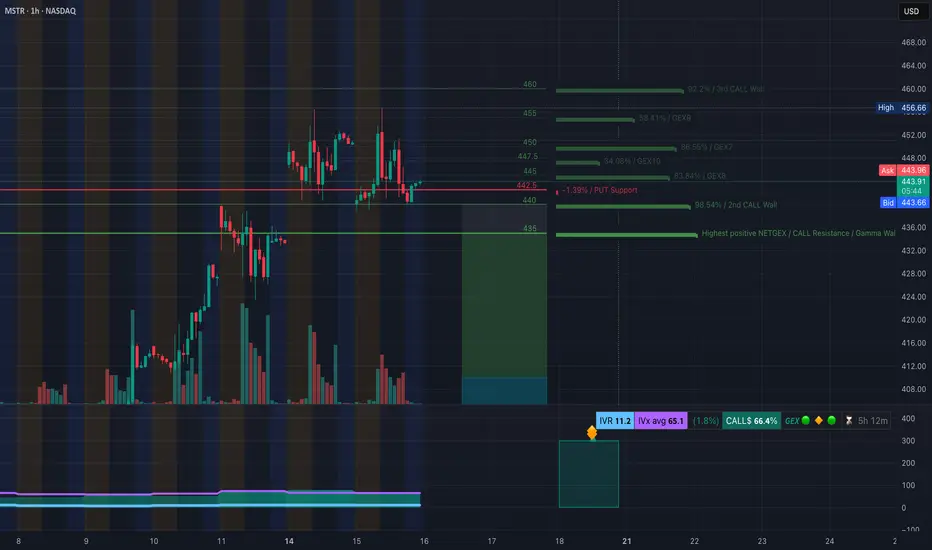
MSTR at Decision Zone! TA for July 16GEX + Price Structure Align for Breakout or Breakdown 🔸
🧠 GEX Levels & Options Sentiment (as of July 15, 2025)
* ⚠️ Key Call Resistance Levels:
• $460 (3rd Call Wall, 92.2%)
• $455 (58.41%)
• $447.5 (GEX10)
• $444.5 (GEX7) – overhead friction
* PUT Support Levels:
• $442.5 (near current price)
• $435 (Gamma Wall: highest positive NET GEX)
* Support Structure: Strong GEX support at $435
* Current IVR: 11.2 (extremely low)
* IVx Avg: 65.1
* Call Flow: 🚀 66.4% Call $ flow — strong bullish bias
* GEX Directional Lean: Bullish-neutral, but decision point is here
💡 Option Strategy Ideas:
* If MSTR holds above $444 → Target $447.5 and $455
• Play: Buy 445c or 450c (weekly expiry)
• Risk: < $442.50 closes
* If MSTR breaks $442 → Watch for slide to $435
• Play: Buy 440p or 435p
• Risk: Tight stop above $444.50 retest
📉 1H Chart Technical Analysis & Trade Plan
* Market Structure:
• Bullish channel still intact, but CHoCH just printed below $443
• Multiple Breaks of Structure (BOS) above $444 and $448.5
• Supply zone between $445–$447 acting as resistance
• Price is testing demand around $440–$442.5 (important junction)
* Trendlines: Price currently bouncing along the lower channel boundary
* Demand Zone: $428–$435 is the major support base
* If CHoCH holds and price fails to reclaim $445 → we could see a deeper retrace into $435
* If bulls reclaim and hold $445 → breakout toward $447.5 → $455 is likely
🔁 Intraday Scenarios for Tuesday (July 16):
* Scalp Long above $445.5
• Target: $447.5, $455
• Stop: below $443
* Scalp Put below $442
• Target: $435
• Stop: Above $444.50
🔚 Final Thoughts:
MSTR is at a make-or-break level, sandwiched between a GEX friction zone and key price structure support. Keep risk tight — this setup can move quickly.
This analysis is for educational purposes only and does not constitute financial advice. Always do your own research and trade responsibly.
APPL, Get Yourself a Good PriceHello This week we are breaking down the MAG7 starting with Apple.
This analysis is an aid to help you:
1 Find good price to add to your long term.
2 Hedge your current position.
3 Make a swing trade (we will touch on options pricing as well).
Currently Apple is 1 of 5 of the MAG 7 that had not gained a new high since Trump and the tariff scares. Many analysts have given their predictions on where Apples fair value lies and these vary. What they will not tell you is where the institutional buyers and sellers are. Not to worry, this is where we come in
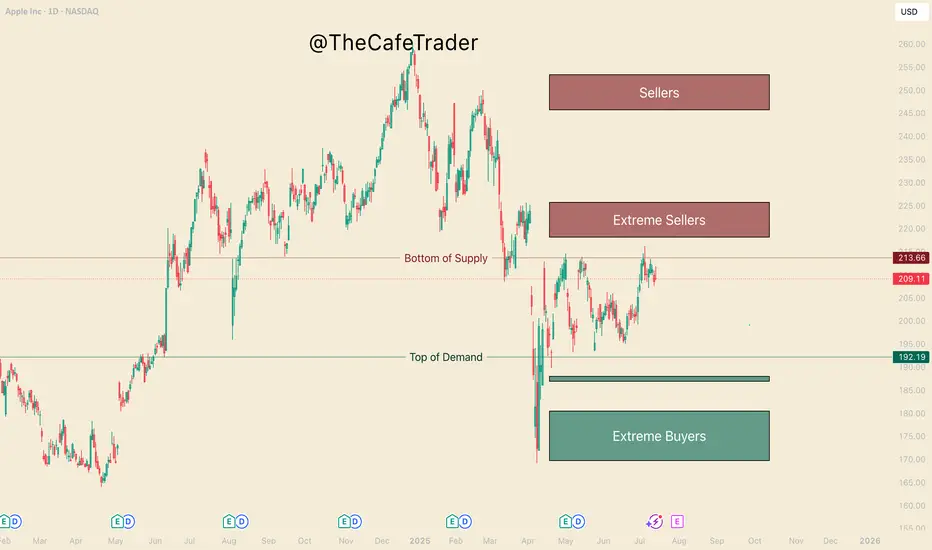
Big Buyers and Big Sellers
On the chart in front of you, take a look at the 3 different buy and sell zones (otherwise known as supply and demand zones). We find these areas in using a system similar to "imbalances" if you are familiar with the footprint chart, or orderflow. If you had no idea what any of that means, not to worry, I've done the work for you.
-The lines represent the fringe of real liquidity . Using this we will be able to help you find how and when you can find a good price for your long term.
- Buyers/Sellers: strong motivated liquidity.
- Extreme Buyers/sellers Extreme demand, this is an area you could consider a steal.
1 How do you find good pricing?
Simply put - Buy with the buyers and sell with the sellers.
If you are wanting to add to your long term here are the prices. Do you want to get in ASAP? or are you willing to wait for what could be a great deal. This is important as the end of the year can greatly depend on not just picking a good stock, but finding a great price.
Buying
Fair - 192
Good - 188-187
GREAT - 180-169
Now if you are in, and maybe you want to hedge the downside (you can do this by shorting the stock, or buying put options (even more in depth you can do spreads).
For now we will just focus on Buying Put options and taking profit for swing traders.
The Burgundy line "bottom of supply" previously rejected this area twice before (May 1st, and May 14th). July 7th marks the 3rd rejection. It's important to note that the last test pushes a new high, this shows a bit of weakness from the sellers.
This weakness suggests we may see the 218-225 Sellers get tested before it comes down. The question is, How strong will the buyers be coming into this zone.
If they are aggressing this area with new REAL buyers, Then we may see this run through all these sellers and continue to run until the 245 area. If we do not find real buyers here, then likely we will reject to the pricing marked previously.
If you are holding APPLE, you can look to hedge with puts at the end of the 220-223. Since you are looking at about 5-7% downside from apple if the sellers are strong here, look to only spend 2-3% of your apple worth on puts. look for maybe 2-3 weeks out if possible.
Secondly if APPL does make a bull run to 245 you can mark this area again to hedge short term puts. look for 8-10%+ downside puts 3-4 weeks out (roughly 3-5% of your apple size)
Hedging can be very useful in wanted to keep your long term and navigate some of the ebbs and flows of the market. Notice that the risk of your puts, 2-3% & 3-5%, is half of the expected reaction from these areas. if you get a big rejection, expect these options to pay well.
NOTE: If you do not understand the implied volatility (IV's) change the price of options, it is recommended that you stay away from options until you have sufficient experience. It's also important to know how to find a good strike price, and how to know if you are getting a good price. I will be breaking down options pricing in a different time.
That's all for Apple, Stay tuned for the rest of the MAG 7!
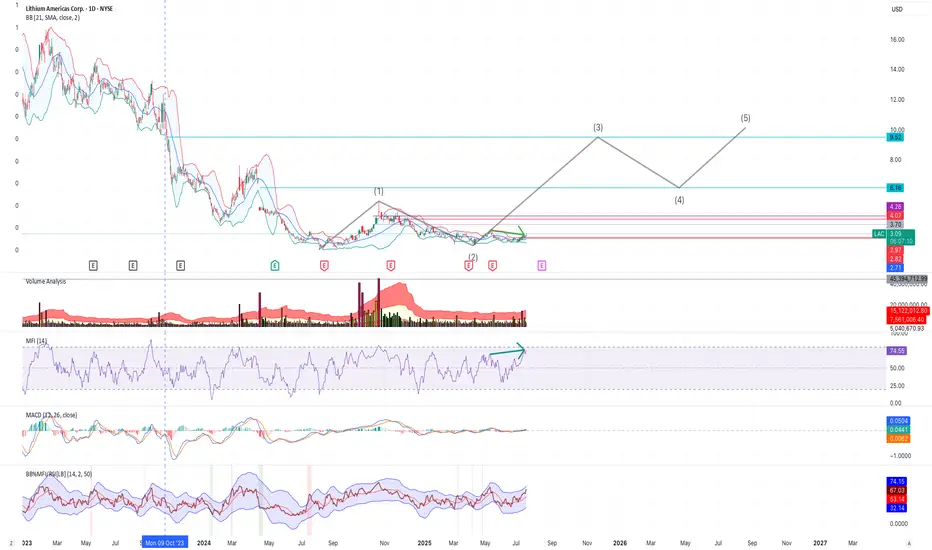
The 3rd Nevada Lithium Elliot WaveI believe LAC may have begun its 3rd elliot wave, with a bottom at $2.33. There also appears to be nice recent strong base support around $2.80. In addition, there appears to be a deviation between price and money flow, as shown with the green arrows - with a potential correction available to push price beyond $3.30 very soon.
I have entered and will watch its daily action and volume with an upside expectation limit around $9-10, then a 4th wave down, etc. Of course, I am not a financial advisor and I have been wrong before and will be wrong again. I trade within this reality and control my risk.
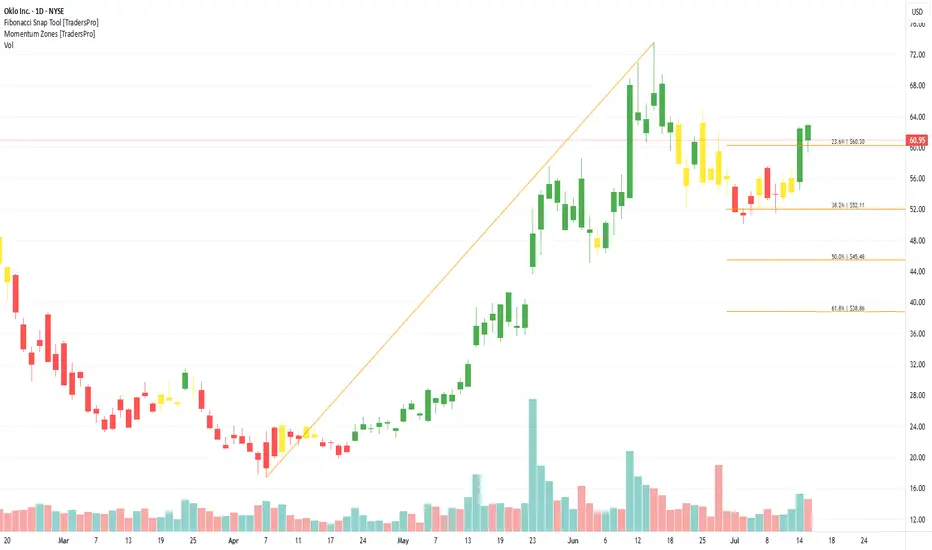
Oklo Inc. (OKLO) Builds the Future of Nuclear EnergyOklo Inc. (OKLO) is a nuclear energy company developing compact, advanced fission power plants designed to deliver clean, reliable energy with minimal waste. Its flagship design, the Aurora powerhouse, aims to provide scalable power solutions for remote locations, data centers, and industrial applications. Oklo’s growth is driven by the global push for zero-carbon energy, innovation in small modular reactors, and rising interest in alternative baseload power sources.
On the chart, a confirmation bar with rising volume signals strong buying momentum. The price has entered the momentum zone by breaking above the .236 Fibonacci level. A trailing stop can be set just below that level using the Fibonacci snap tool to protect gains while staying exposed to further upside.
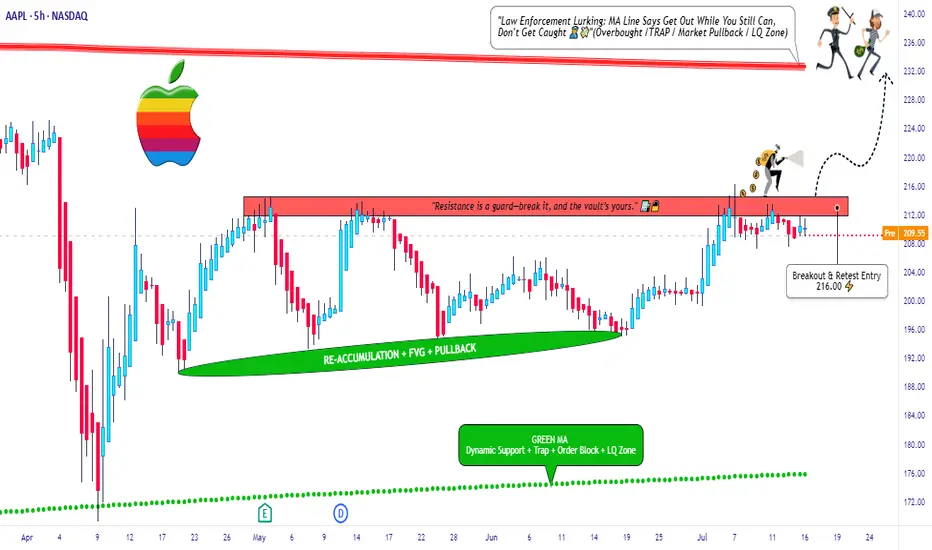
Apple Inc Long Setup – Break, Ride, Exit Like a Pro🕵️♂️💼 “The Apple Heist: Thief Trader's Masterplan for a Clean Escape” 💸🚀
🌟 Hi! Hola! Ola! Bonjour! Hallo! Marhaba! 🌟
Welcome, Money Makers & Market Thieves! 🤑💰💸✈️
This ain’t your average stock analysis — this is a high-level blueprint for the Apple Inc. (AAPL) market heist, built using the Thief Trading Style 🔥📊.
We've scouted the field using a mix of technical patterns, market sentiment, and fundamental fuel, and we’re ready to make our move. The plan is set: go long once the resistance wall cracks, and aim for a clean getaway just before the danger zone hits.
🎯 THE PLAN: INFILTRATE, ESCAPE, PROFIT
Entry Point:
💥 “The vault’s cracking – the breakout begins at 216.00!”
Place Buy Stop orders just above the resistance wall or wait for a pullback to recent swing zones (15M–30M charts work best).
📌 Set your alerts early – you don’t want to miss the opening.
🛑 STOP LOSS - YOUR BACKUP PLAN
🔊 “Listen up, crew: No stop loss until the breakout confirms! Once you’re in, place SL wisely – use the 4H swing low (200.00). Your risk, your rules. Don't get caught slippin’.”
📍 Adjust SL based on lot size, entry volume, and trade size. Protect your stash.
🏁 TARGET ZONE:
🎯 Heist Target = 232.00
(Or bail early if the heat's on – you know the drill.)
⚠️ SCALPERS & SWINGERS
💸 Long side only – don’t fight the wave.
🧲 Scalpers: Get in, grab the cash, trail the stop.
📈 Swing Traders: Hold firm. This setup has legs.
🔎 WHY WE’RE ROBBING THIS CHART:
Apple’s bullish momentum is fueled by:
📌 Strong institutional sentiment
📌 Earnings strength
📌 Index rotation and positioning
📌 COT data & macro tailwinds
Get the full scope: fundamentals, macro outlook, positioning data, sentiment, and intermarket dynamics 🔗📊.
Stay sharp – stay informed.
📰 NEWS ALERTS & POSITION MANAGEMENT
🚨 Avoid new entries during high-impact news releases.
🏃 Use trailing SLs to lock profits and exit clean.
💖 BOOST THE CREW — STRENGTH IN NUMBERS
🚀 Hit that BOOST button if this helped you steal a profitable trade. Your support powers our heist team.
Let’s keep making money the Thief Way – with style, planning, and confidence. 🎉💪🏆
📌 NOTE FROM HQ:
This analysis is for educational purposes. It’s not personalized financial advice. Manage your trades responsibly. Conditions can shift quickly — stay updated and flexible. Stay in the shadows and move smart. 🐱👤
💬 Drop a comment, hit like, share with your gang – the market's a vault, and we’re the codebreakers.
See you on the next heist, Thief Fam. 🤑🔥🕶️💼
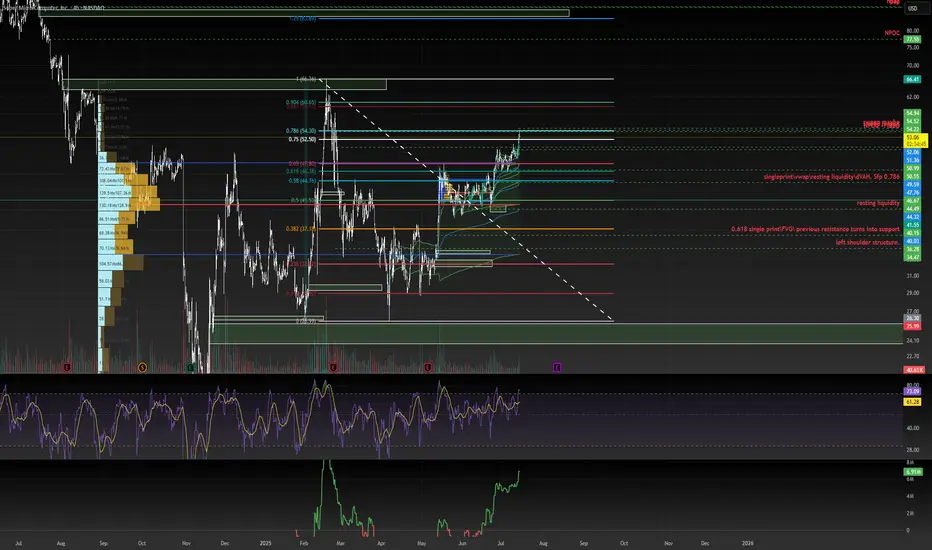
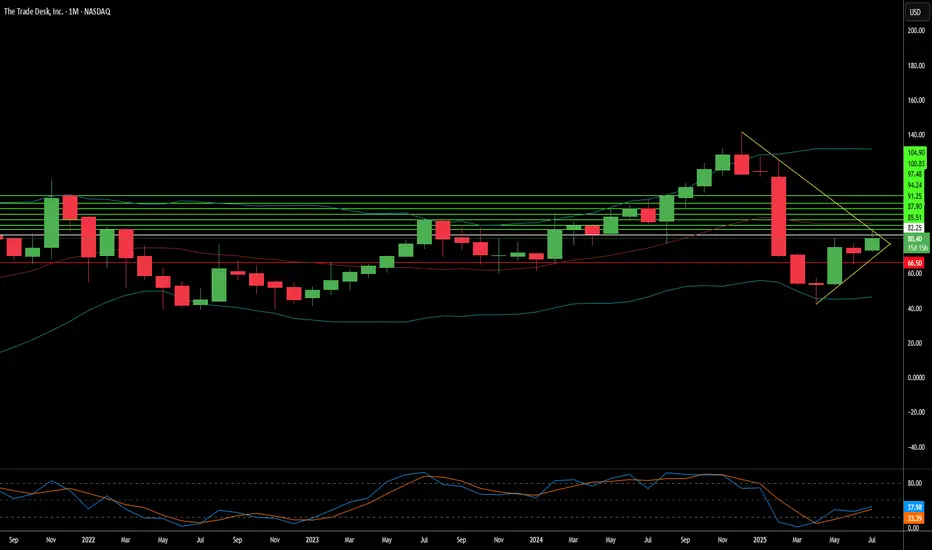
NeoWave Structure: Flat–X–Triangle Combination - break outThis chart illustrates a possible NeoWave-style corrective combination: a Flat–X–Triangle structure, likely completed and followed by a breakout.
W Wave: A well-structured Flat correction (labeled A–B–C) with a clean internal 5-wave impulse in C. Balanced time and volume across subcomponents suggest structural completion.
X Wave: A simple, proportionally shallow X connector, in line with NeoWave time and price minimums.
Y Wave: A textbook contracting triangle (labeled a–b–c–d–e), with near-perfect Fibonacci relationships between legs:
• Wave b retraces approximately 61.8% of wave a
• Wave d retraces approximately 78.6% of wave c
• Time symmetry is preserved
• Volume compresses into the apex, a classic triangle behavior
Breakout Observed:
• Price has moved above triangle resistance
• Volume increased at breakout
• MACD shows positive crossover and rising momentum
Interpretation:
This may mark the end of a prolonged corrective structure and the beginning of a new impulsive sequence. Triangle projection targets suggest the $77–80 area as a minimum, with higher Fibonacci extensions possible (e.g., 1.618 or 2.618 of prior moves) if this evolves into a 3rd wave.
Technical Approach:
This analysis follows NeoWave principles (Glenn Neely), emphasizing structural clarity, wave proportion, time-price balance, and breakout behavior.

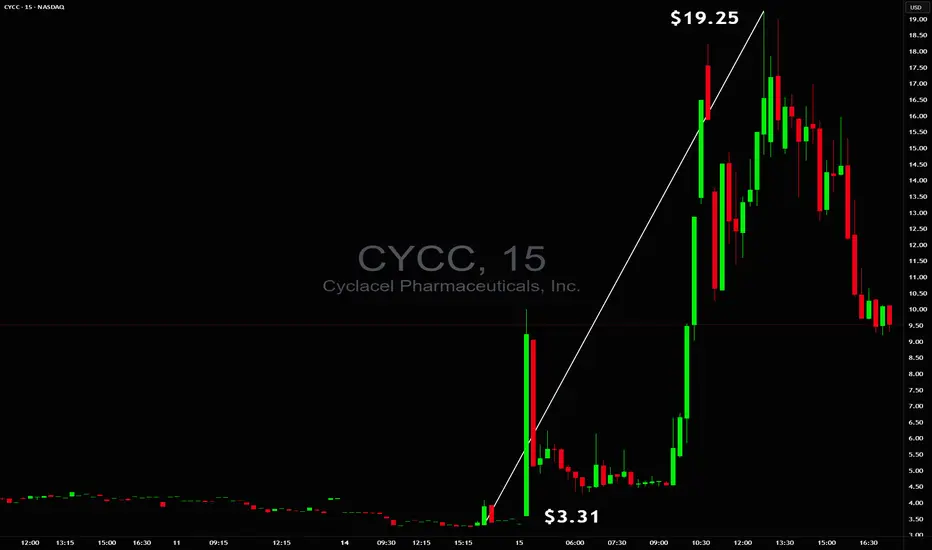
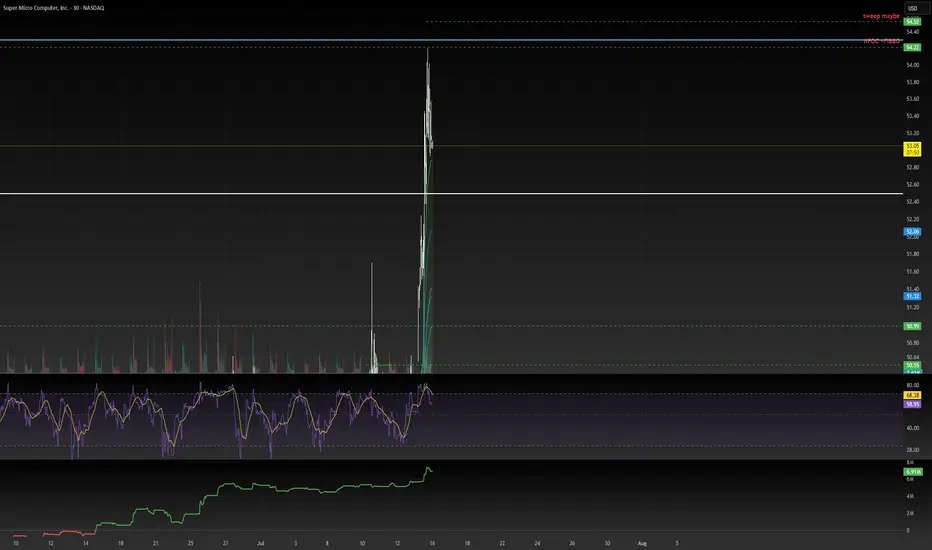
$3.31 to $19.25 in minutes$3.31 to $19.25 in minutes 🚀 but without a safe trade setup ❌ NASDAQ:CYCC
Too unstable to trade early while end of day there was a chance for power squeeze but even on 60M+ volume, tiny float and huge borrow fee they were able to reverse it so safe stop had to be respected ✔️
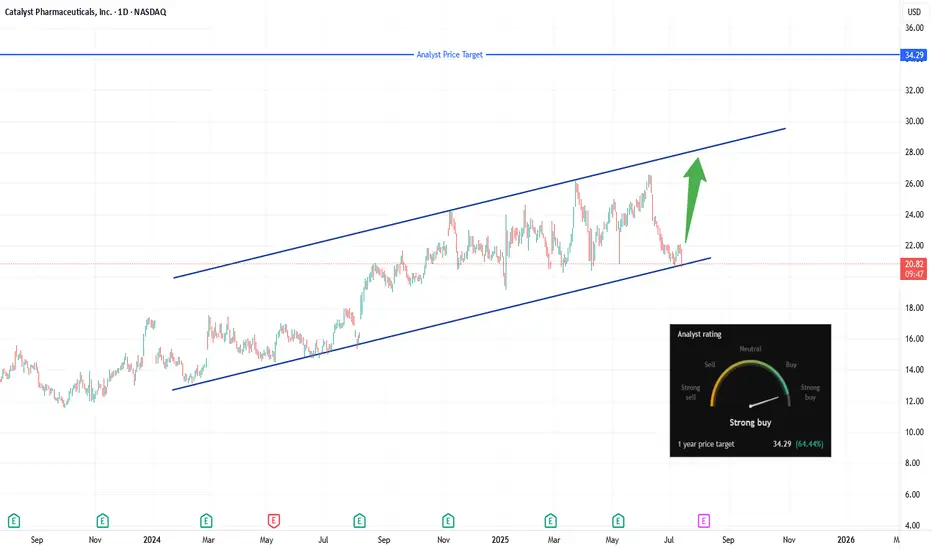
CPRX breakout watch: Eyes on $22.10, channel support intactCatalyst Pharmaceuticals (NASDAQ: CPRX) remains poised at the lower trendline of a well-defined ascending channel, trading in the $20.60–$21.00 area. The setup to monitor now is a daily close above $22.10, which would signal a real breakout through the $21.82–$22.11 resistance zone. A decisive push above that level opens the door for a test of the channel’s upper boundary near $27–$28.
💡 Trade Plan:
Trigger: Go long on a confirmed daily close above $22.10
Targets:
First: Mid-channel resistance around $24.50
Stretch: Upper-channel target of $27–$28
Stop‑Loss: Place below the channel base, ideally under $20.50 to manage risk
Why It Works:
Clear structure: Ascending channel with multiple supports provides clarity on entries and exits .
Momentum catalyst: Breaching the $21.8–$22.1 zone suggests fresh upside momentum.
Reward setup: A small stop near channel support offers a favorable risk/reward targeting channel top.
TL;DR:
Watching for a breakout above $22.10—that’s your entry trigger. Aim for $24.50, then $27–$28, with a stop under $20.50 if support fails.
AMC | Long-Term Setup BrewingAMC has been a battlefield stock for retail traders, and while the meme frenzy has calmed, the chart shows signs of a long-term consolidation that may lead to a breakout.
We’re not chasing hype we’re playing levels. The current zone offers asymmetric risk/reward for patient swing or position traders looking for a reversion move back toward key psychological and technical levels.
🔍 Entry Zones:
✅ Market Price: ~$2.99 (initial momentum position)
🧲 Pullback #1: $2.75 (former pivot + fib level)
🧨 Pullback #2: $2.50 (key support floor and high-risk/reward entry)
🎯 Profit Targets (Swing/Position):
🎯 TP1: $3.30 – reclaim of early resistance
🎯 TP2: $4.00 – volume spike zone
🎯 TP3: $5.00+ – potential sentiment surge / short squeeze zone
📢 Disclaimer: This is not financial advice. Always manage your own risk and do your own due diligence.

Tesla earnings setup favours upsideTesla is scheduled to report its second-quarter results on Wednesday 23 July, after the New York close of trading. The company is forecast to report revenue of $22.8bn, representing a 10.5% year-on-year decline, with earnings expected to decrease 19% to $0.34 per share. Gross profit margins are also anticipated to contract by 2.3 percentage points to 16.4%, down from 18.7% last year.
Tesla does not provide traditional guidance but instead offers a business outlook. In its first-quarter release, the company noted difficulties in assessing the impact of shifting global trade policies and stated it would revisit its 2025 guidance during the second-quarter update. Consequently, investors will undoubtedly be focused on any insights regarding 2025 delivery forecasts, especially given the weak performance in the first half of 2025.
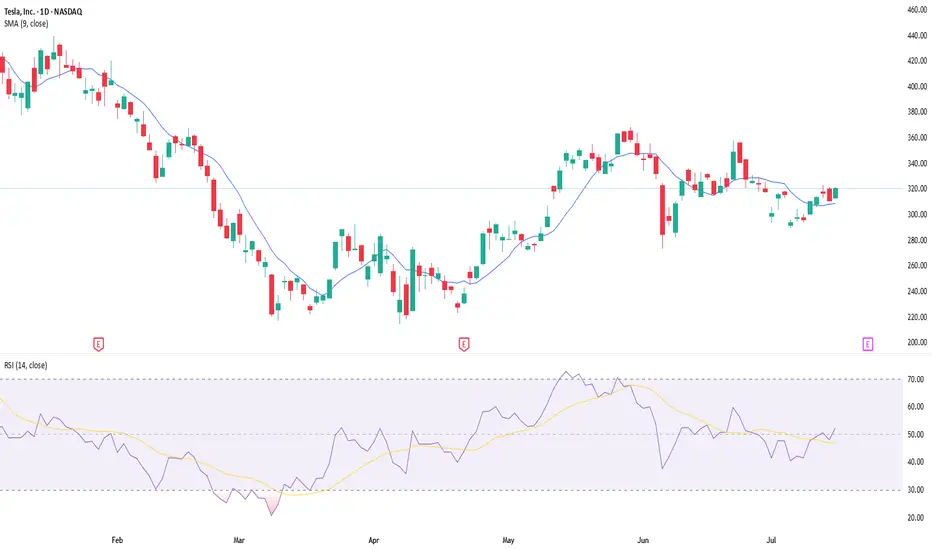
Given the current uncertainty, the market is pricing in a 7.5% rise or fall in the shares following the earnings release. Options positioning is relatively neutral, with only a slight bullish bias. However, there is significant support for the stock between $280 and $300, marked by substantial put gamma levels. Conversely, resistance from call gamma exists between $325 and $330. This setup suggests that it could be easier for the stock to rise rather than fall following the results.
The technical chart clearly illustrates this scenario, highlighting strong support around $290 that dates back to March. More recently, the shares have encountered resistance around the $330 mark. If Tesla can successfully break above this resistance, the stock could move towards approximately $360, while downside seems limited to around $290 to $300.
Written by Michael J. Kramer, founder of Mott Capital Management.
Disclaimer: CMC Markets is an execution-only service provider. The material (whether or not it states any opinions) is for general information purposes only and does not take into account your personal circumstances or objectives. Nothing in this material is (or should be considered to be) financial, investment or other advice on which reliance should be placed.
No opinion given in the material constitutes a recommendation by CMC Markets or the author that any particular investment, security, transaction, or investment strategy is suitable for any specific person. The material has not been prepared in accordance with legal requirements designed to promote the independence of investment research. Although we are not specifically prevented from dealing before providing this material, we do not seek to take advantage of the material prior to its dissemination.
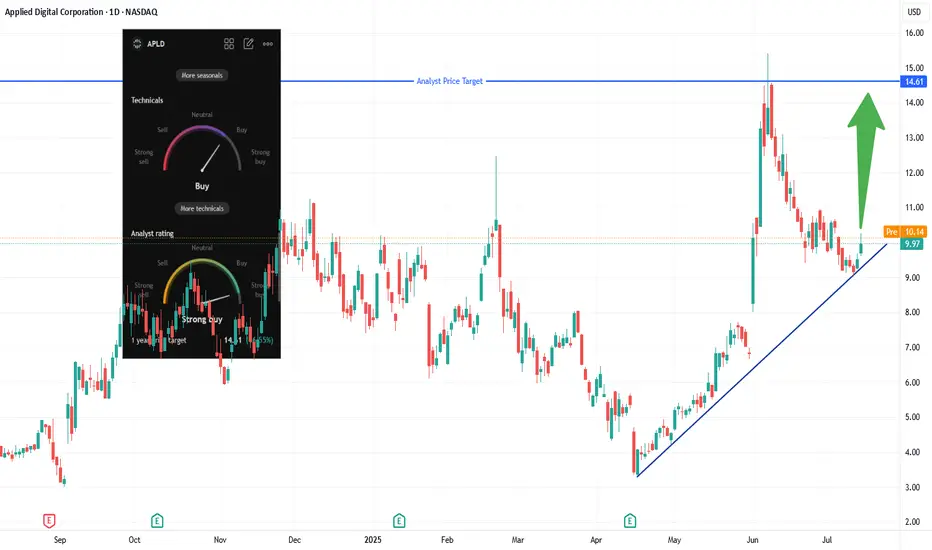
APLD Long: Trendline Bounce + CoreWeave AI Lease🎯 Trade Setup Overview
Entry: Market at Open
Stop‑Loss: Below the trendline at ~$9.00
Primary Target: $14.60–$15.50 (analyst zone + historical highs)
Reward/Risk: ~50–60% upside vs ~7–10% downside = solid R:R ~5:1
📈 Technical Rationale
The stock recently bounced off a long‑term ascending trendline, confirming it as key support. A breakout above ~$10.40 would challenge the analyst consensus target zone ($14–15), projecting a favorable conviction trade.
The setup aligns with classic trend‑continuation patterns—lower risk entry at support with clear upside objective.
🤖 Fundamental/Bull Catalysts
Landmark CoreWeave Lease: APLD signed two 15-year leases (250 MW, + optional 150 MW) with Nvidia-backed CoreWeave, expected to generate ~$7 billion in revenue over the term.
Strong Sector Tailwinds: AI infrastructure is surging. CoreWeave is investing billions in new data centers (e.g., 100 MW→300 MW in Pennsylvania). APLD rides this wave as a data-center REIT pivot.
Analyst & Options Sentiment: Analysts target $12.70–13.40; unusual options flow shows heavy interest in calls up to $15 strikes.
📊 Volume & Momentum Metrics
The recent bounce was accompanied by increased volume—a signal of institutional demand and trend continuation.
Technical indicators confirm bullish momentum building.
📝 Trade Plan
Initiate long position around $10.00.
Place stop-loss just under trendline (~$9.00) to limit downside.
Scale out partial at $14.60 (analyst target) and consider holding a tranche toward $15.40 (historic high).
🛠 Risk Considerations
Trend support could fail—if trend breaks below $9.00, cut losses quickly.
Broader tech pullback or AI sector rotation could pressure price—always trail stops accordingly.
The Trade Desk: Why the Sudden Surge?The Trade Desk (TTD) recently experienced a significant stock surge. This rise stems from both immediate market catalysts and robust underlying business fundamentals. A primary driver was its inclusion in the prestigious S&P 500 index, replacing Ansys Inc. This move, effective July 18, immediately triggered mandated buying from index funds and ETFs. Such inclusion validates TTD's market importance and enhances its visibility and liquidity. This artificial demand floor, coupled with TTD's $37 billion market capitalization, underscores its growing influence within the financial landscape.
Beyond index inclusion, TTD benefits from a significant structural shift in advertising. Programmatic advertising is rapidly replacing traditional media buying, expected to account for nearly 90% of digital display ad spending by 2025. This growth is driven by advertisers' need for transparent ROI, publishers avoiding "walled gardens" through platforms like TTD's OpenPath, and AI-driven innovation. TTD's AI platform, Kokai, greatly lowers acquisition costs and enhances reach, resulting in over 95% client retention. Strategic partnerships in high-growth areas like Connected TV (CTV) further reinforce TTD's leadership.
Financially, The Trade Desk demonstrates remarkable resilience and growth. Its Q2 2025 revenue growth of 17% outpaces the broader programmatic market. Adjusted EBITDA margins hit 38%, reflecting strong operational efficiency. While TTD trades at a premium valuation - over 13x 2025 sales targets-its high profitability, substantial cash flow, and historical investor returns support this. Despite intense competition and regulatory scrutiny, TTD's consistent market share gains and strategic positioning in an expanding digital ad market make it a compelling long-term investment.
NVDA Update: Breakout Fading or Wedge Still in Play?In my last post, I highlighted the rising wedge pattern forming at the top of NVDA’s strong rally. Price briefly pushed above the upper wedge resistance and tagged $172.40, but today’s session printed a bearish close at $170.70 — just above the breakout level, but with no real follow-through.
Volume came in higher, but price action failed to extend the breakout, suggesting this could be a stall or even a false breakout in progress. RSI remains overbought, and momentum may be slowing despite the recent push.
If price slips back below $168, we could see the original wedge breakdown scenario come back into play. Watch for support around:
🔹 $151.31–148.67
🔹 Below that: $125 zone
For bulls, continuation above $172.40 with strong volume would invalidate this pattern and confirm breakout strength. Until then, caution is warranted.

AMZN at a Crossroad! TA for July 16Options & Intraday Trading Setups to Watch This Week 🔍
🧠 GEX Analysis & Options Sentiment (Tanuki)
* GEX Sentiment: Mildly Bullish
* CALLs Volume: 10.6% → Neutral-to-Weak Bullish
* IV Rank (IVR): 26.3 → Low implied volatility rank
* IVx Avg: 33.9 → Neutral options environment
Gamma Walls / Levels to Note:
* Resistance (Call Walls):
* $230 = Highest positive NETGEX / Resistance
* $232.5 = GEX8 (18.57%)
* $235 = 3rd Call Wall
* Support (Put Walls):
* $222.5 = Strongest GEX Put Support
* $220 = GEX6 (13.48%)
* $217.5–$212.5 = Additional soft Put Walls
→ Suggested Option Plays Based on GEX:
* Bullish Scenario (above 226.5):
* Buy $230C expiring this or next week. Target resistance at $230–$232.
* Avoid heavy premium; use spreads for low IV.
* Bearish Scenario (breaks 222.5):
* Buy $220P if price loses $223 with volume confirmation.
* Add $217.5P runner if 220 breaks.
📉 1-Hour Chart Technical Setup (SMC, CHoCH, BOS)
* Market Structure:
* Still in Uptrend but showing early weakness.
* Recent CHoCH formed at 225.80 area, BOS confirmed below intraday trendline.
* Key Price Zones:
* Support Zone: 222.5–219.7 (Demand + GEX Put wall)
* Resistance Zone: 226.6–230.0 (CHoCH supply + GEX CALL wall)
* Trendline Watch: Bullish channel tested, rising diagonal support still holds.
* Breakdown Risk: Below 223 could flip structure to bearish short-term.
📊 Trading Plan Based on Price Action:
If Bullish:
* Entry above 226.6 (hold above BOS + reclaim trendline).
* Target: 230 → 232.5
* Stop-loss: Below 225.3
If Bearish:
* Entry below 223.3 with candle close.
* Target: 220 → 219.7
* Stop-loss: Above 225.5
Scalpers: Watch for liquidity sweeps at 225–226 for fast rejection or reclaim setups.
Swing traders: Wait for clean direction post-break of 230 or 222.5.
🧭 Final Thoughts:
AMZN is consolidating under gamma resistance at $230 while sitting on soft structure. Options are pricing in a neutral bias, but a breakout could cause a gamma squeeze above $230. Watch the CHoCH and BOS areas closely this week. Stay reactive — let price lead.
Disclaimer: This analysis is for educational purposes only and does not constitute financial advice. Always do your own research and manage risk responsibly.

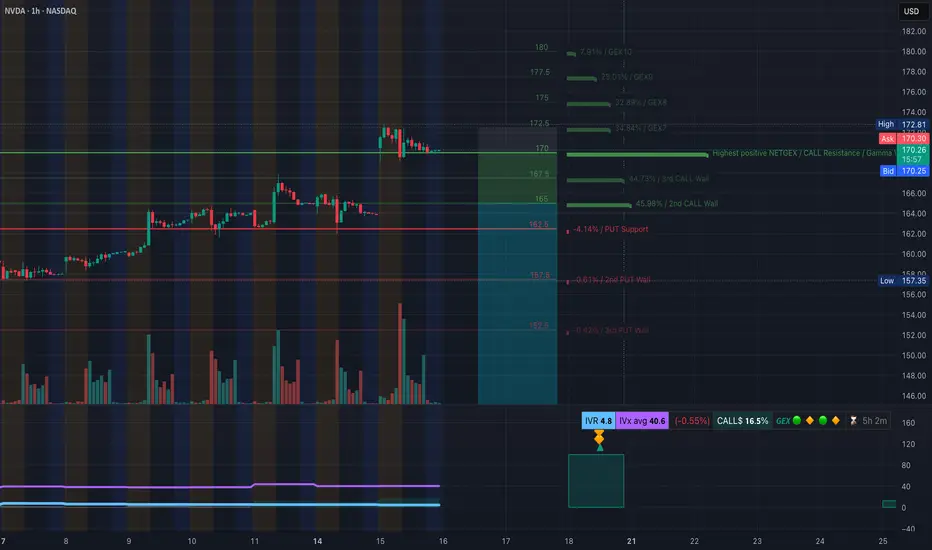
NVDA Bulls in Control Above $170? TA for July16Options Flow and Technical Setup🔥
🧠 GEX & Options Flow Analysis
* GEX Map Summary:
* Highest Call Wall & Gamma Resistance: $172.50
* Major GEX Clusters: $175–$178 → Layered GEX zones, strong positive sentiment
* PUT Support: $162.5 — This is the highest negative NetGEX zone and key downside defense
* IVR: 4.8 (Low)
* IVx: 40.6 (Decaying vol environment)
* Options Skew: 16.5% CALL-dominant bias — Traders leaning bullish.
🧩 Options Trading Suggestions:
* Bullish Play (Preferred Bias):
* Above $170, bulls can look for a push into $172.5 → $175 range.
* Suggested Strategy:
* Buy: $172.5 or $175 CALL (0DTE or 7/19 expiry)
* Condition: NVDA must hold above $170.00 on pullbacks
* Risk: Use $167.5 as a mental stop
* Target: $175–$178 possible gamma magnet if volume kicks in
* Bearish Hedge (if 170 fails):
* Below $167.5, NVDA could revisit $165 or $162.5 PUT wall
* Put Entry Idea: $165 PUT (7/19)
* Only if price shows CHoCH + BOS confirmation
🧠 1H Chart + SMC Price Action Breakdown
* Market Structure: BOS continuation → price consolidating below BOS high
* Current Box: NVDA trapped in a tight SMC range between $167.89–$172.81
* CHoCH Zone: None yet. We’re in a healthy bull flag consolidation pattern
🔍 Trading Scenarios:
* Bullish Setup:
* Wait for breakout above $172.5
* If price closes above and retests → long to $175, $178
* Alternatively, accumulate calls if price bounces from $170 with strength
* Bearish Setup:
* Watch $167.89 → a CHoCH and BOS below this opens $165, $162.5
* Be cautious: this is a bullish structure unless macro news hits
✅ Final Thoughts:
NVDA remains one of the strongest charts on the board. The consolidation under $172.5 is healthy, and GEX flow shows bullish momentum building. As long as $170 holds, this setup favors long trades, especially toward $175–$178.
Disclaimer: This analysis is for educational purposes only and not financial advice. Always do your own due diligence and manage risk properly.
Got filled at the bugattiMy hedge short is filled
continuation of my other chart
IF this is good the target it the!!....
key levels will be longed if data aligns.

Quick View: $CRCLOn the hourly chart there is a huge compression area with decreasing volume. It should be bullish, but is hard to say as data are so few.
Ready to catch the action higher.
