CRNC on WatchLooking to buy a pullback around $9.65 or if it goes lower, $9.16.
Why:
High relative volume on the daily
Relative strength compared to SPY
MACD turning bullish on the daily chart

SANM Breakout Setup – Trendline Holding 🚀
📝 Description:
SANM is showing strong bullish structure with consistent higher lows and a trendline acting as dynamic support. Price is now pressing against a key resistance zone around $93.60–$94.00 and looks ready for a breakout continuation.
📍 Entry: $93.69
🎯 Target: $95.29
🛑 Stop Loss: $93.00
⚖️ R:R: Clean 2:1+ risk-reward setup
🕒 Timeframe: 30-min chart
📊 Strategy: Trend continuation / Breakout confirmation
Watching closely for volume and momentum above resistance.
#SANM #BreakoutSetup #TradingViewIdeas #TechnicalAnalysis #ProfittoPath #LongTrade

WMB Breakout from Ascending Triangle 🚀
📝 Description:
WMB is showing strong bullish momentum after forming a clean ascending triangle. Price broke above horizontal resistance near $61.10 with higher lows intact. This move could signal trend continuation.
📍 Entry: $61.12
🎯 Target: $61.97
🛑 Stop Loss: $60.80
📊 Setup Type: Breakout / Trend Continuation
⚖️ Risk-Reward: 2:1+
Watching for follow-through above the breakout zone with potential volume confirmation.
#WMB #BreakoutTrade #AscendingTriangle #LongSetup #PriceAction #TradingView #ProfittoPath

A 10x on APLD ? Applied Digital has confirmed a multi-year symmetrical triangle breakout on the weekly chart, marked by immense volume and a clean breakout above long-term downtrend resistance. The base of the triangle spans several years, with consistent higher lows forming a solid support line.
🔺 Breakout Volume: Massive volume surge confirms strong institutional or speculative buying interest.
🟠 Heavy Resistance: $28.60 identified as the next major challenge before a full trend expansion.
🧠 Measured Move Target: Triangle projection suggests potential upside toward $140.00 , a 3,000%+ move from the breakout zone.
🟨 Support Zones: $11.00 (area of demand) and $4.50 (triangle confirmation level) now act as strong support.
APLD is showing early-stage parabolic potential after confirming a multi-year consolidation breakout. With strong volume, bullish structure, and long-term accumulation patterns, it now targets a multi-bagger move.
A pullback to $11.00 would offer a high-conviction re-entry zone.

Ride UBER to $300.00 The chart of Uber Technologies Inc. (UBER) showcases a multi-year bullish setup following a prolonged accumulation phase and key breakout signals:
Consolidation: The stock entered a horizontal consolidation phase above previous resistance, now acting as strong support ($60–$80), confirmed by multiple bounce points (green arrows).
Measured Move Projection: The current breakout from consolidation implies a 34% immediate upside target to $110.36, followed by a long-term target of $316.90, mirroring the prior major impulse.
Volume Profile: Volume spikes during uptrends and stable participation during consolidation suggest institutional accumulation.
🔑 Key Technical Levels
Support Zones: $80.00 (major), $60.00 (breakdown risk),
Short-Term Target: $110.36
Long-Term Extension Target: $316.90 (288% move)

CLSK / 2hAs expected, NASDAQ:CLSK has retraced up today, but also unfolding a flat correction of a larger degree in wave (x), which could have remained in progress and at a very late stage now.
Wave Analysis >> After completion of the retracement up in wave c, it's anticipated the following decline of 24% will develop a three-wave sequence abc as wave (y) to conclude the entire correction in wave ii(circled).
The retracing down target >> 7.93
Trend Analysis >> After the conclusion of the entire correction in the Minute degree wave ii(circled), the trend will turn upward to an impulsive third wave in the same degree.
#CryptoStocks #CLSK #BTCMining #Bitcoin #BTC

MP - MaterialsFinding stocks in a bull trend is always nice. Even better than a bullish trend is a pull back to the 100 day EMA and possibly the 200 day EMA at $20.14. The market maybe dropping hard but, not every stock is dropping. This one pulled back to provide a better entry for a possible new run. RSI is oversold at 39.14.

SRAD Breakout SetupLets see if this can push out of this range or not
SL 22.8
TP1 25.9
TP2 26.74
TP3 28

$ASTS Short PositionOvervaluation confirmed by RSI indicator.
Massive Doji, signaling pressure and resistance from sellers.
Entry Point: $45.94 (Last daily candle close price)
Stop/Loss: $52.25
Target Profit Price: $35.50
Disclaimer: Charting is strictly for personal analysis, and should not be used for financial advice.

WULF / 2hAs illustrated on the NASDAQ:WULF 2h-frame above, considering the internal structure of the ongoing wave (c) would suggest now respecting an expanded diagonal as the ending formation of the entire correction in wave b(circled) as an alternative.
So after the completion of retracing up in the 4th subdivision, A final decline of 20% is expected to follow to conclude the entire correction in wave b(circled) in an expanded flat formation.
The next retracement target >> 3.20
Trend Analysis >> The trend will turn upward very soon! to a Minute degree impulsive wave c(circled) after completion of correcting down in the same degree wave b(circled).
#CryptoStocks #WULF #BTCMining #Bitcoin #BTC

MARA - Trade Both Sides To WinMARA
Similar to Bitcoin , MARA bounced from a 1:1 extension:
And so a 3 wave correction completed in symmetry.
So on MARA chart , from April lows we have;
- A weak 1:0.618 (GW) 3 wave upside bounce (blue line).
- A shallow and descending 1:1 3 wave correction (yellow line).
- And a 0.5 retracement bounce.
The bounce is weaker than Bitcoin and overall the chart looks weak also considering the 1:0.618 extension ~ weak because the third wave is shorter and a sign of waning momentum.
If Bitcoin will at some point move on up then there is a possibility that this 3 wave correction is a connecting and momentum shifting Pattern Separation from the bearish 1:0.618 wave up, into a more bullish future wave up.
But overall the chart looks weak to my eyes.
I am going to somewhat play both sides here because Bitcoin is printing upside liquidity sweeping action.
This signals some sort of downside in the pipeline.
...
In this area I do not yet have too much idea whether the Bitcoin bounce has real impetus or it is an unstable short squeeze that would lead to impulsive downside.
But I do think that some downside is coming; either a pull back or the dominant trend continuing down.
And so this is my opportunity to take the short term signal to get in early on a MARA short.
...
If MARA is weak compared to Bitcoin and Bitcoin grinds higher, there is a reasonable chance that MARA will start falling.
But another significant consideration is that Nasdaq made a new ATH today ~ MARA is part of the Nasdaq index.
Since Nasdaq has tapped into higher liquidity above previous ATH, there is a reasonable chance that Nasdaq will not be making much more significant Y axis discovery to the upside.
And so; similar to the relationship with Bitcoin; if Nasdaq grinds higher and MARA is weak comparing to Nasdaq, then MARA may start falling away.
With both Bitcoin and Nasdaq potentially in some sort of distributive (topping) territory and a potential MARA having a weak relationship with both, in the most bearish scenario MARA may capitulate down and down from here.
And in the more bullish scenario I may make a small loss or perhaps breakeven.
So I bought a few short positions here 👍.
This analysis is shared for educational purposes only and does not constitute financial advice. Please conduct your own research before making any trading decisions.

price touche AOV we can see price is in 50 % of the range looking for confirmation candle closure are we respecting or disrespect this AOV

RIOT / 2hAccording to the NASDAQ:RIOT 's prior analysis, Minor degree wave B is retracing upward, as I'd outlined at the end of the second paragraph in the note on the chart.
Wave Analysis >> The leading diagonal in Minor degree wave A, is correcting up now in the same degree wave B which would develop in a three-wave sequence like a flat formation or zigzag.
Trend Analysis >> The trend would remain correcting downward in the Intermediate degree wave (2), which will take a few weeks to develop.
The retracing down targets >> 8.76 >> 8.20 >> 7.93 >> 7.67
#CryptoStocks #RIOT #BTCMining #Bitcoin #BTC

CNM to outperform distributors This looks like a great trade, I'm already in, sorry for the late post.

$BBAI need to get over 4.5neutral right now, lean bull
need to get over 4.5 to confirm buyers in control before longing

Ebay Wave Analysis – 24 June 2025
- Ebay reversed from long-term resistance level 80.00
- Likely to fall to support level 71.15
Ebay recently reversed down from the resistance area between the major long-term resistance level 80.00 (which started the weekly downtrend in 2021) and the upper weekly Bollinger Band.
The downward reversal from this resistance area created the weekly Japanese candlesticks reversal pattern Shooting Star.
Given the strength of the resistance level 80.00 and the overbought weekly Stochastic, Ebay can be expected to fall to the next support level 71.15 (former resistance from the start of 2025).

Bullish Gann chart $CLSKNASDAQ:CLSK will be pusing much higher ones it brakes the arc First target around $30.

$AAPL Long Setup – Range Breakout Potential with Tight RiskApple ( NASDAQ:AAPL ) is finally showing signs of strength after a prolonged sideways range. Price is attempting to break above the Ichimoku Cloud on the daily chart while MACD is starting to curve upward—indicating a potential shift in momentum. After holding the $190–$200 zone as support for months, this move above $200 could trigger a short-term breakout toward the $220–$226 levels.
The current setup has a clean structure with a 4.27 risk/reward ratio:
Entry: $200.30
Stop: $195.07 (below recent range lows)
Target: $222.61 (prior high + pivot cluster)
If this move holds, it could mark the start of a trend reversal in Apple following months of chop. Solid setup for a 2–4 week swing trade or as part of a core position rebuild.
Let me know if you're playing this one or waiting for confirmation above $208.

HIMS – Long Setup | Potential 60% MoveHims & Hers (HIMS) just gave us a textbook Ichimoku breakout and is holding strong above the cloud after a healthy pullback.
Technical Breakdown:
Price above Kumo Cloud: Bullish structure intact.
Support held at $54.62 – key base above cloud and Tenkan-sen.
MACD is curling back after a corrective wave, showing early signs of momentum returning.
Risk/Reward: 8.59 – Extremely favorable.
Target: $93.58 (60.22% upside)
Stop: $51.78 (7.01% downside)
Rationale:
HIMS continues to ride bullish sentiment in the healthcare and telemedicine sectors. This chart has a clean continuation setup with institutional buy zones likely around $54-$55. Risk is tightly controlled, and upside potential is significant.

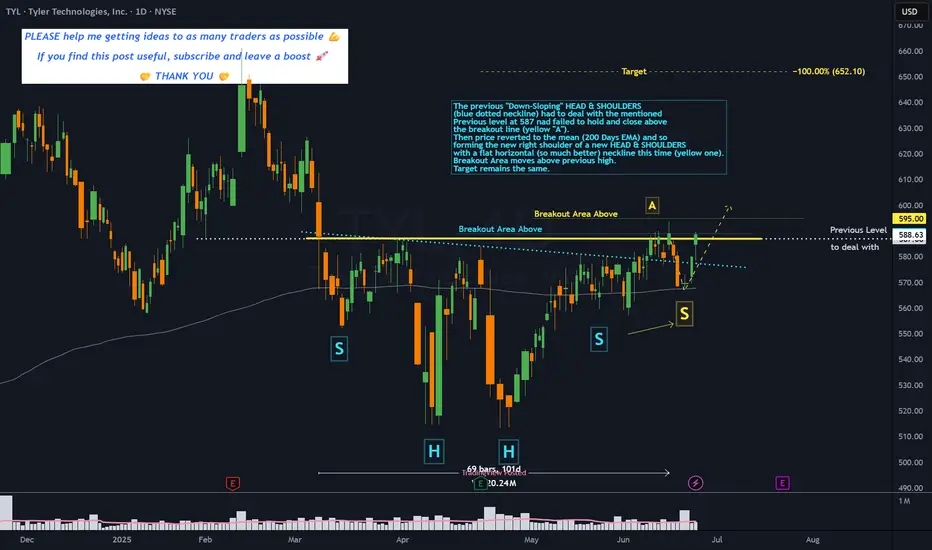
TYL - 3 months HEAD & SHOULDERS══════════════════════════════
Since 2014, my markets approach is to spot
trading opportunities based solely on the
development of
CLASSICAL CHART PATTERNS
🤝Let’s learn and grow together 🤝
══════════════════════════════
Hello Traders ✌
After a careful consideration I came to the conclusion that:
- it is crucial to be quick in alerting you with all the opportunities I spot and often I don't post a good pattern because I don't have the opportunity to write down a proper didactical comment;
- since my parameters to identify a Classical Pattern and its scenario are very well defined, many of my comments were and would be redundant;
- the information that I think is important is very simple and can easily be understood just by looking at charts;
For these reasons and hoping to give you a better help, I decided to write comments only when something very specific or interesting shows up, otherwise all the information is shown on the chart.
Thank you all for your support
🔎🔎🔎 ALWAYS REMEMBER
"A pattern IS NOT a Pattern until the breakout is completed. Before that moment it is just a bunch of colorful candlesticks on a chart of your watchlist"
═════════════════════════════
⚠ DISCLAIMER ⚠
Breakout Area, Target, Levels, each line drawn on this chart and any other content represent just The Art Of Charting’s personal opinion and it is posted purely for educational purposes. Therefore it must not be taken as a direct or indirect investing recommendations or advices. Entry Point, Initial Stop Loss and Targets depend on your personal and unique Trading Plan Tactics and Money Management rules, Any action taken upon these information is at your own risk.
═════════════════════════════
Circle Collapse - Will COIN follow? Circle stock has been on a wild ride lately
After a meteoric rise of over 700% since its IPO on June 5, it's now facing some turbulence:
- Today, the stock dropped nearly 16%, partly due to Cathie Wood’s ARK Invest selling $110 million worth of shares.
- Analysts are also sounding caution. Compass Point initiated coverage with a $205 price target—below its current trading price—citing rising competition in the stable coin space.
- Despite the dip, some still see long-term potential. A recent Forbes analysis explored whether Circle could hit $500 per share, driven by growth in USDC reserves and infrastructure revenue.

$VKTX Gann VKTX has a beautiful symmetry. Ones it breaks the next arc, it will gravitate to the next one!

Microsoft Wave Analysis – 24 June 2025- Microsoft broke the resistance area
- Likely to rise to the resistance level 500.00
Microsoft recently broke through the resistance area between the resistance levels 468.15 (a former multi-month high from the middle of 2024) and 455.85 (which reversed wave B in December).
The breakout of this resistance area accelerated the active minor impulse wave 5 – which belongs to the intermediate impulse wave (3) from April.
Given the clear daily uptrend, Microsoft can be expected to rise to the next round resistance level 500.00 (target for the completion of the active impulse wave 5).
