TESLA Reached The Support! Buy!
Hello,Traders!
TESLA gaped down on
Monday but the move was
Held up by a massive support
Area ending around 272$ and
As the support is strong we
Will be expecting a rebound and
A move up from the level
Buy!
Comment and subscribe to help us grow!
Check out other forecasts below too!
Disclosure: I am part of Trade Nation's Influencer program and receive a monthly fee for using their TradingView charts in my analysis.

UBER · Daily — “Channel-Break” Idea Toward $110 → $125Why I Like the Setup
Secular Up-Channel: Since mid-2023 price has respected a textbook rising channel (~$30 tall).
Fresh Breakout Attempt: UBER is now pressing the upper rail near $100. A daily close above it would signal a new expansion phase.
Measured-Move Math: Projecting the channel’s height from the breakout pivot (~$80) gives Target-1 ≈ $110-113; the 127 % fib expansion points to Target-2 ≈ $124-128.
Volume Profile Tailwind: The histogram thins sharply once price is north of $100, meaning little “stored” supply until $112; a larger node re-appears near $120, my second profit zone.

SOFI 4-Hour — “Measured-Move” Breakout Toward $20.8 → $22Structure: Price broke out of a year-long falling-wedge and then punched through an ascending trend-line confluence at ≈ $17.00–$17.50.
Impulse Leg (Yellow): The vertical rally that followed is ≈ $3.75 tall. Projecting that height from the breakout pivot ($17.00) gives 100 % extension = $20.78.
Target Zone (Violet Box): $20.8 – $22.0 aligns with
100 % measured-move projection
Prior all-time swing high (~$20.5, Jan-2024)
A thin volume-profile “air pocket” between $19 and $22 (little resistance until the upper edge).
Next Level Up: 127.2 % fib extension sits at $24.15—that becomes the stretch target only if $22 is cleared decisively.

Toast with ButterToast posted an earnings gap up on May 9. Rallying to new highs, shares pulled back to form a flat base. Funds have been adding the stock to their holdings over the past seven quarters, according to MarketSurge data.

NVIDIA (NVDA)-Trade PlanNVDA, After an explosive run powered by GenAI infrastructure and bullish earnings, the chart is setting up for either a bullish continuation or a healthy pullback.
With volatility tightening and volume compressing, this is a great moment to prepare for either breakout or breakdown scenarios.
🎯 Trade Plan – Tiered Long Setup
📌 Entry Zones (Tiered Buying):
🔹 $150
🔸 $140
🔻 $120
📈 Profit Targets:
TP1: $160
TP2: $175
TP3: $200+ – Long-term continuation play if AI macro momentum persists
📌 DISCLAIMER: This idea is for educational purposes only. Always use proper risk management and assess your own strategy

TSLA: Triangle PatternResearching the market through structural lens, particularly the topology of trapped liquidity buildup and compression of volatility, that leads to a proportionally heavier move once a breakout occurs.
Raw compression area derived from waves of higher degrees (2nd, 3rd)
The longer price consolidates within boundaries of a triangular formation, the more significant the breakout tends to be.

AXP Breakout Trade – Triangle Pattern Alert!🚨 🚨
American Express (AXP) has bounced perfectly off trendline support and is now breaking out of a descending triangle. Price action shows buyer strength stepping in near $320.22 with a clean breakout retest at $322.63.
📌 Trade Details:
🔹 Entry: $322.63 (breakout candle)
🔹 Stop Loss: $320.22 (below support)
🔹 Target: $332.22 (previous resistance zone)
🔹 Chart Pattern: Symmetrical Triangle Breakout
Breakout backed by bullish structure and strong recovery from higher lows. Watching for follow-through with increased volume.
💡 Risk smart — follow your plan!
—
📊 Shared by: ProfittoPath
#AXP #AmericanExpress #TriangleBreakout #SwingTrade #TechnicalAnalysis #TradingView #ProfittoPath #StockSetup #BreakoutStock

LMND Long Trade Setup – Breakout Alert!🚨 🚨
Lemonade Inc. (LMND) has just broken above a key descending trendline on the 30-minute chart — signaling potential bullish momentum ahead. After days of consolidation, buyers stepped in right at the lower support zone, confirming a strong base.
📌 Trade Details:
🔹 Entry: $42.99 (above resistance)
🔹 Stop Loss: $42.06 (below recent support)
🔹 Target: $44.38 (previous supply zone)
🔹 Risk/Reward: Solid R:R setup with breakout confirmation ✅
This setup aligns with a clean technical breakout — I’ll be watching for volume surge and price to hold above $43.
💡 Always manage risk and follow your trading plan!
—
📊 Shared by: ProfittoPath
#LMND #BreakoutTrade #StockSetup #TechnicalAnalysis #TradingView #ProfittoPath #SwingTrade #BullishSetup #StockMarket

$AAPL Long Setup – Range Breakout Potential with Tight RiskApple ( NASDAQ:AAPL ) is finally showing signs of strength after a prolonged sideways range. Price is attempting to break above the Ichimoku Cloud on the daily chart while MACD is starting to curve upward—indicating a potential shift in momentum. After holding the $190–$200 zone as support for months, this move above $200 could trigger a short-term breakout toward the $220–$226 levels.
The current setup has a clean structure with a 4.27 risk/reward ratio:
Entry: $200.30
Stop: $195.07 (below recent range lows)
Target: $222.61 (prior high + pivot cluster)
If this move holds, it could mark the start of a trend reversal in Apple following months of chop. Solid setup for a 2–4 week swing trade or as part of a core position rebuild.
Let me know if you're playing this one or waiting for confirmation above $208.

BLDR UPDATEAfter breaking through resistance, its taking a bit of a break. However, finally got the the 20DMA to break above the 50DMA and also starting to form a mini bull flag on the daily. For now, the WVAP will be watched for support at $124 as it bounced nicely off that today. Any break below the WVAP and/or falling wedge line would invalidate the setup. Would love to see the next leg up test previous S/R flip area around 135/137.

NVDA at a Make-or-Break Zone – Trade Setups Ahead 🔍 Options GEX Insights (Gamma Exposure):
* GEX Map Observation:
* NVDA is currently trading near 158, slightly under the major Gamma Wall at 160.98.
* This level marks the highest positive net GEX – strong resistance due to heavy call positioning.
* Above that, additional call walls stack at 162.5 → 165 → 167.5, creating a squeeze zone if price breaks out.
* Below, support levels sit at 155 (2nd PUT wall) and 152.5 (3rd PUT wall).
* Volatility & Options Sentiment:
* IVR: 8.8, IVx: 40.8 – low implied volatility rank = cheap options.
* Put Positioning: Only 1.4% = call-heavy environment, skewed bullish.
* Positive GEX (+) across expiries shows dealers will hedge upward if we move beyond 161.
🟢 Bullish Scenario (Breakout/Squeeze Setup):
* Break over 160.98 could ignite a gamma squeeze toward 165–167.5 range.
* Ideal for low delta CALL verticals or debit spreads targeting the 165 zone.
* Weekly options are cheap due to low IV.
🔴 Bearish Rejection Scenario:
* If price stays pinned under 160 and loses 155, dealers start to de-hedge – momentum toward 152/150.
* Consider put spreads or a cautious fade if it breaks structure.
📌 GEX Summary Suggestion:
If NVDA stays under 160, price may remain pinned or retrace. But above 161 opens the gamma doors to 165+. Cheap IV = opportunity.
📊 1-Hour Price Action Technicals:
* Market Structure:
* Previous BOS toward the upside has stalled inside a consolidation box under 160.
* Multiple CHoCH zones form below current price, hinting at exhaustion.
* Price is stuck within a wedge, coiling beneath resistance = compression phase.
* Support & Resistance Zones:
* Resistance: 159.34 → 160.98 (Gamma Wall and price supply).
* Support: 155.34, then 151.10.
* Bullish OB remains untested around 151 area if price flushes.
* Volume & Trend:
* Volume declining during chop = balance phase.
* RSI & MACD show slight bearish divergence, favoring caution near top of range.
⚙️ Trade Thoughts:
* Scalp Setup:
* Above 160.98 = scalp long toward 162.5/165, tight stop at 159.3.
* Below 155 = scalp short toward 152 zone.
* Swing Setup:
* Long only on strong breakout close above 161 with volume.
* Short swing possible under 155 if CHoCH confirms trend flip.
Conclusion:
NVDA sits at the pivot point of either breaking out toward 165+ or rejecting and retracing toward 152. GEX and price both hint at a coiled move ahead. Stay nimble, follow the volume.
Disclaimer: This analysis is for educational purposes only and does not constitute financial advice. Trade at your own risk.

AMZN Coiled at Key Gamma Level! Trade Setup Inside📊 GEX (Options Sentiment) Analysis – AMZN
* Current Price: $223.20
* Gamma Wall (Call Resistance): $225 – Highest Net GEX, significant resistance zone.
* CALL Walls: Stack from $225 → $230 → $232.5 → $235
→ Suggests upside resistance builds fast; option sellers may try to cap the rally here.
* PUT Wall Support: Cluster at $215 → $212.5 → $210
* GEX Sentiment:
* GEX: ✅ (Green)
* IVR: 32.2 | IVx Avg: 35.6
* CALLs Positioning: Low (5.9%), moderate skew
* Interpretation:
Price pinned near $225 likely due to gamma forces. Any close above could trigger a quick gamma chase toward $230–232+. But failure = fast fade back to $215 support.
📌 Options Strategy Suggestion:
* Bullish Setup: Wait for break/close > $225. Consider vertical debit spreads (e.g., 225c/230c) for limited risk.
* Bearish Rejection: If AMZN gets stuffed at $225 again, short-term PUT spreads toward $215 are viable (e.g., 222p/215p).
🕐 1-Hour Price Action + SMC Intraday Trade Plan
* Structure:
* BOS → CHoCH → Sideways in tight range between $223–224.50
* AMZN is consolidating inside a tight breaker block zone under $225.
* Uptrend channel still valid with higher lows holding.
* Support: $221.88 → $218.75
* Resistance: $224.66 → $227.12
* Bias: Neutral to mildly bullish unless $221 fails.
🔍 Intraday Trade Scenarios
1. Breakout Play (Bullish):
* Trigger: 1H candle closes above $224.66 with volume
* Entry: $225.10
* Target: $227.10 → $230
* Stop: $222.80
2. Fade Play (Bearish):
* Trigger: Break below $221.88 with CHoCH
* Entry: $221.60
* Target: $218.75 → $217.00
* Stop: $223.40
Watch the box: AMZN is stuck in a decision zone. Don't chase. Let it break first.
Final Thoughts:
AMZN is coiled tightly beneath its Gamma Wall. A clean break could trigger aggressive movement either way, so position sizing and stop discipline are critical. Avoid overtrading inside the box.
Disclaimer: This analysis is for educational purposes only and does not constitute financial advice. Trade responsibly and manage your risk.

GOOGL – Sitting on the Edge! What’s Next After This Break? 📊 GEX Analysis – Options Sentiment Insight:
* Call Resistance Wall: Strongest resistance at 180–182.5 area (High GEX%, Gamma Wall, 2nd & 3rd CALL Wall). A breakout above this may trigger a gamma squeeze.
* Support Zone: HVL @ 174.39 — aligned with PUT support and GEX10 (-6.92%) at 167.5, forming a key downside guardrail.
* Gamma Exposure (GEX): Green double-dot 🟢🟢 = supportive for bullish bias but nearing exhaustion.
* IVR/IVx: IVR 40, IVx avg 37.2 — Neutral to slightly bullish. Options aren't overly expensive, risk-reward still good for directional plays.
* Call Participation: 16.4% CALLS = Moderate bullish activity but not extreme greed.
🔥 Options Strategy Idea:
* Bullish case: If price holds above 174–175, consider 7/12 or 7/19 180C debit spread (e.g., Buy 175C / Sell 180C).
* Bearish case: Break below 173.5 and you can play PUT debit spread down to 170 or 167.5.
📉 1-Hour Chart Analysis (Intraday/Swing):
* Structure: Bearish CHoCH confirmed. Price has pulled back after rejecting from red OB zone (~179.5–180).
* Current Action: Price hovering below trendline and sitting above demand zone (173.5–174.4). Break and close below this could lead to continuation down toward 170.5 / 167.5.
* Bias:
* Bearish under 177.06.
* Neutral chop zone between 174–176.6.
* Bullish recovery only above 177.5–179.5 reclaim.
🎯 Scenarios & Trade Setups:
* Scalp BUY Setup:
* Entry: Hold above 175
* Target: 177 / 179.5
* Stop: Below 173.5
* Scalp SELL Setup:
* Entry: Break and retest below 173.5
* Target: 171 → 167.5
* Stop: Back above 175
📌 Thoughts & Suggestions:
* GOOGL’s options positioning suggests a potential bounce, but the bearish CHoCH and rejection at resistance urges caution.
* If bulls reclaim 177.5, we may see a push to test the heavy CALL walls at 180–182.5.
* Trade defensively inside chop zone, don’t force full directional plays unless you see clean BOS or demand failure.
Disclaimer: This analysis is for educational purposes only and does not constitute financial advice. Always do your own research and trade responsibly.

NFLX Options Setup – GEX Levels to Watch🎯GEX (Gamma Exposure) Insights
* Call Resistance Zone sits between 1310–1340, with 70.83% GEX Call Wall at 1310 and multiple smaller GEX walls stacked above (1320, 1330, 1340).
* Put Support Zone rests at 1270–1240, where Highest Negative GEX is clustered (1270 being the HVL level).
* IVR is elevated at 38.7, and IVX avg at 45.1 — this is a decent environment for premium selling if range persists but be cautious near breakout zones.
* Call Flow Dominant (23.7%) suggests bulls are still present but cautious.
📌 Suggested Option Trade (Short-Term):
* Bullish Scenario: Buy 1290c or 1300c for this week (if breakout >1300 confirms). Use 1270 as your stop zone. Target 1320–1340.
* Bearish Scenario: Buy 1270p if price fails below 1280. Target 1250–1240 zone. Consider debit spreads due to elevated IV.
NFLX 1-Hour Chart Setup (Smart Money Concepts) 📉📈
Structure:
* Price currently consolidating inside a liquidity zone near 1280–1290, between recent CHoCH and BOS.
* Price has reacted bullishly after BOS from 1270s, but has not yet broken above 1310 supply zone (previous CHoCH level).
* A wedge is forming — indicating squeeze/expansion soon.
Scenarios:
🔼 Upside Breakout:
* Trigger = Break and retest above 1300 with volume
* Entry = 1302
* Target = 1320 → 1340
* Stop = 1287
🔽 Downside Breakdown:
* Trigger = Clean break below 1279
* Entry = 1275
* Target = 1250–1240
* Stop = 1292
Volume: Low on the recent consolidation, signaling potential energy buildup.
My Thoughts:
NFLX is coiling in a tight range between key PUT support (1270) and CALL resistance (1310). GEX suggests explosive potential if either zone breaks, so don’t trade inside the chop. Let price commit. Watch the wedge breakout + volume spike. This could be a strong options play for the week.
Disclaimer:
This analysis is for educational purposes only. Always do your own research and manage your risk accordingly.

MSFT at Decision Point: Options GEX & Smart Money Clues🧠 Options GEX Analysis – Bullish Bias Above 497.5
* Gamma Wall / Resistance at 500–502.5
There is clear call resistance at 500.79, aligning with heavy GEX levels at 502.5 and 507.5, with the 2nd Call Wall peaking at 74.58%. This sets a magnetic zone IF MSFT pushes above 498.
* Below 490 = Risky Territory
The HVL support zone (07/11) sits at 490. A breakdown below this may open up weakness toward 485 (2nd PUT Wall at -28.77%) and even 480 where heavy PUT support lies at -38.11%.
* Implied Volatility & Sentiment
* IVR: 25.4, IVx avg: 23.9 → Moderate volatility
* PUTs: 4.9% bias, GEX: Bullish (🟢🟢🟢)
This leans bullish short-term, but caution is advised on a break under 490.
📉 1-Hour Chart Insights – Price Action + SMC
* Structure:
BOS and CHoCH confirmed. Price pushed above structure but is now consolidating below 500, suggesting indecision.
* Fair Value Gap + Order Block Retest
The recent CHoCH is forming near 500, and price is reacting to the purple SMC zone. Price is holding above the bullish OB and BOS zone around 480–488. This is key demand.
* Trend:
As long as price stays above the SMC bullish OB and GEX support at 490, a potential continuation toward 502.5–507.5 remains valid.
📌 Game Plan / Suggestions
Bullish Setup:
* Entry: Above 498–500 breakout
* Target: 502.5, 507.5
* Stop: Under 490 or conservative at 488
Bearish Setup:
* Entry: Below 488 break
* Target: 485, then 480 PUT zone
* Stop: Above 492
Watch the opening range – if MSFT gaps above 498 with momentum, bulls could dominate. But failure at 500 means this could fade back into the OB zone.
🎯 Final Thoughts
This is a make-or-break zone for MSFT — smart money has positioned resistance at 500+ while GEX still supports upside bias above 490. Stay nimble.
Disclaimer: This analysis is for educational purposes only and does not constitute financial advice. Always do your own research and manage risk.

AAPL Options Sentiment (GEX) – Gamma Exposure Analysis* Gamma Wall / Call Resistance is forming between 213.55 – 216.23, aligning with major GEX levels (GEX7/8) and 2nd/3rd Call Walls. That area is a potential profit-taking zone or rejection spot for bulls if tested again.
* High Volume Level (HVL) at 202.5 is marked with strong support (from the green tag), meaning sellers must break below that level with force for a bearish continuation.
* Below that, we have layered PUT support walls at 200 and 195, reinforcing 198–202 as a major demand zone.
* Current IVR: 27.6, IVx avg: 31.4 — fairly low, suggesting neutral-to-slightly-bearish premium pricing.
* PUTs 3% weighted dominance also implies defensive positioning, but not aggressively bearish.
🔍 Options Insight:
If price stays under 213 and fails to reclaim 212.55–213.55 zone, the bias is toward a grind back toward 205–202.5.
Watch for volatility around July 11 expiration — if 202.5 fails, 200 strike puts may surge.
📈 Potential Options Trade Setup:
* Bearish setup (if rejection confirmed below 213):
* Entry: Near 212.5
* Target: 202.5
* PUT: July 12 or 19 $205P or $202.5P
* Bullish recovery scenario:
* Entry: Above 213.55 with strength
* Target: 216+
* CALL: July 12 $215C for short-term squeeze play
AAPL 1-Hour Chart – Price Action & Structure
* Break of Structure (BOS) occurred above 212.55 but was not sustained.
* Price is now pulling back from the mid-supply zone (purple box) and is attempting to hold above 209 support.
* Trendline support broken, and now retesting from below — suggesting a weakening trend unless 213 is reclaimed quickly.
* Major support at 199.26 aligns with a previous CHoCH zone, forming a clean demand zone.
* Volume is fading slightly on this decline, but there’s no strong absorption yet.
🧠 Intraday Bias Suggestion:
If AAPL can't reclaim 212.5–213 on bounce, the market may pull toward the HVL zone (205–202.5).
However, if we get a reclaim of 213.5 with volume, the trendline flip becomes bullish again — target 215–216.
Summary Recommendations
* For Options Traders:
* Favor PUT debit spreads or single directional PUTs if price stays below 212.5.
* Avoid naked CALLs until a break above 213.5 confirms strength.
* IV is low — good time to buy premium, not sell it.
* For Stock Traders (Intraday or Swing):
* Consider shorting pops into 213 with stop above 215.
* Look for long entries near 202.5–200 with tight stops if structure holds.
This analysis is for educational purposes only and does not constitute financial advice. Always do your own research and manage risk carefully.

GEX-Based Options Sentiment GEX-Based Options Sentiment (as of July 7)
* Current Price: $138.69
* Highest Gamma Resistance (Call Wall): $139 → heavy OI + positive NetGEX → magnet + possible rejection
* Next Call Walls:
* $142 (GEX7, 51%)
* $144–146 stacked (GEX8–10) — breakout potential zone if $139 clears
* Put Wall + Support Stack:
* $131 (HVL for 7/11 expiry)
* $128, $127 → deep support zones
* Net GEX Bias: Mildly bullish short-term
* IVR / IVX:
* IVR = 38.5 (low)
* IVX = 64.7 avg
* Flow Tilt: 40.4% CALLs → Balanced, but leaning risk-on
📌 Option Trade Thoughts:
If PLTR clears and holds above $139, expect potential squeeze toward $142–$144 zone. Good setup for short-dated directional calls (0DTE or 2DTE) targeting $140–$142 with tight stops.
Below $135.5–134 = breakdown back into the lower GEX zone → bearish PUT play to $131–128.
Options Suggestion:
• Bullish Scenario: 140C or 142C (0DTE/2DTE) if $139 flips support
• Bearish Scenario: 134P or 132P if price fails to reclaim $139 and breaks $135.5
Keep risk small — IV is relatively low so premiums still reasonable.
📉 1-Hour Price Action and SMC Outlook
* Structure: PLTR in a rising channel with clean higher lows
* CHoCH → BOS confirmed: Valid short-term bullish structure
* Current Zone: Consolidating under resistance ($139), forming ascending pennant inside channel
* Support Levels:
* $135.62 → prior CHoCH and EMA confluence
* $134.36 and $132.20 as deeper pullback supports
* Volume: Rising on pushes, fading on retrace → healthy structure
🎯 Trade Setup Ideas:
Bullish:
* Entry: $139 breakout with volume
* Target: $142 → $144
* Stop: Below $135.5
Bearish:
* Entry: Rejection at $139 and break back below $135.5
* Target: $132.2 → $130
* Stop: Above $139.50
📈 Watch for confirmation of breakout or rejection from this wedge. Patience is key.
🧠 My Take:
PLTR is at a decision point — either breakout and trend to mid-$140s, or fakeout and retrace to reload lower. GEX stack shows resistance is thick but not extreme. Smart Money Concepts (CHoCH + BOS + channel structure) suggest bullish bias is intact — but we need confirmation over $139.
Disclaimer:
This analysis is for educational purposes only and does not constitute financial advice. Always manage your risk and do your own research before trading.

TSLA Options GEX Outlook: Bearish Pressure with Limited Support The GEX (Gamma Exposure) chart signals heavy PUT-dominant sentiment:
* Highest Negative NetGEX / PUT Support is stacked tightly around 295, with major Put Walls between 290 and 275.
* GEX clusters:
* -98.4% at $285
* -74.9% at $280
* -46% at $270
* On the upside, CALL resistance begins around 310–320, with GEX cooling off at 330.
🔍 Interpretation:
* Market makers are likely to hedge against upward price moves, increasing resistance near 310–320.
* Downside movement toward 285–280 could accelerate gamma momentum, causing a potential drop toward 270.
📉 Options Setup Suggestion:
* If price rejects at $297–300, buying PUTS (1–2 DTE) with target at 285 could benefit from GEX tailwinds.
* Avoid CALLs unless price breaks above 310 with volume.
TSLA 1-Hour Chart Technicals: Compression & Reaction Zone at Key Structure
The 1H chart shows:
* A recent Change of Character (ChoCH) and Break of Structure (BOS) near 290–295, indicating an attempt to reverse short-term bearish trend.
* Price is consolidating within a small demand zone (green box) and trying to retest the 295–297 region.
* However, TSLA remains under a macro downtrend with the descending channel intact.
🎯 Key Zones:
* Resistance: $297 → $305 → $310
* Support: $288.77 (LTF BOS) → $285 → $280
* Volume shows weak bullish momentum so far, not strong enough to push through resistance decisively.
⚠️ Trade Setup Ideas:
* PUT Scenario: If price fails to reclaim 297, consider entering near 296–297 with stop above 300. Target: 288 → 285.
* CALL Scenario (Risky): Only consider Calls above close + hold over 300, aiming for 310 with tight stop below 297.
🧠 Final Thoughts:
* Bias: Bearish to Neutral until price shows strong reclaim above 300.
* GEX setup favors PUT plays, especially on weakness below 295.
* If shorting, watch for reaction at 285 — this is the last solid gamma level before an air pocket to 270.
* Stay nimble, use stops, and respect trendline pressure overhead.
Disclaimer: This analysis is for educational purposes only and does not constitute financial advice. Always do your own research and manage your risk before trading.

NKE is a SELL here!Short term overbought, longer term nasty chart and tariff issues courtesy #donthecon because after all boys and girls "trade wars are easy to win" He hasn't won yet as he's been preoccupied ending the Ukraine war "day 1" and counting all the money Mexico sent to pay for the wall

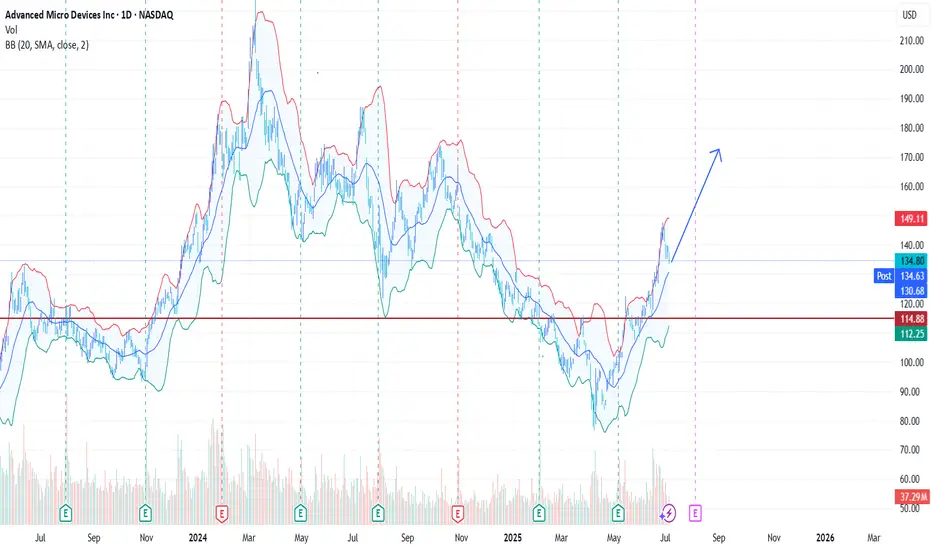
AMD - the up rally continuesWe`va had again tariffs trouble bringing the stock and the market down, which does not change our main direction up. Stock is in a new cycle and continues to build up momentum. There is not much to say here
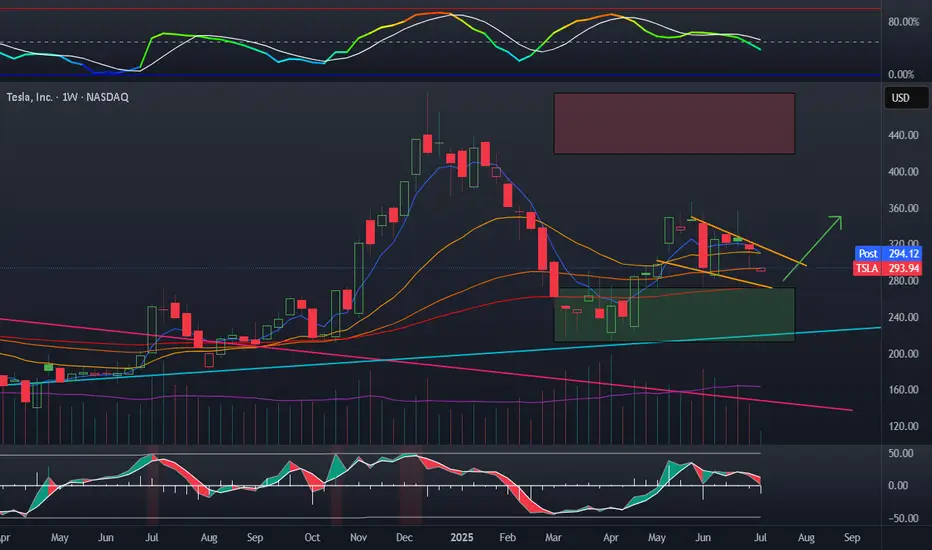
TSLA consolidation before expansionTesla despite being effected once again by fud is ready to pop. Average volume is up, a bear flag has played out, and oscillators reset. This 55 EMA on the weekly is a nice DCA zone. A bounce here or around 270 is likely. I think we see another try at 350 in coming weeks.
My plan:
Averaging down on TSLL, in CSP, already captured a few rounds of covered calls
Star Bulk Carriers Corp. (SBLK) - Macro TimeframeThis is the main idea for SBLK. I’m confident we’re in the early stages of a major impulsive move to the upside. Taking both financial and Elliott Wave perspectives into account, this scenario fits the overall context the best. I expect the price to break above the 2022 high in the near future. The red line marks a clear invalidation point for this outlook.

DemandThe asset is in an untouched demand zone that was formed around the first week of May. Will the bulls regain momentum and overcome 12.77 10 EMA? Or will the bears drag price down below 12.50 region? Also the 12.53 region on the day chart is a key level, so if it breaks below the bears have an upper hand and possible CHoC to the downside on daily.
