Bear Flag Completed?This pattern in stock trading is called a bear flag, right?
Here's why:
Prior Downtrend (Flagpole): You can see a significant downward move leading into the pattern, which forms the "flagpole."
Consolidation/Correction (Flag): After the sharp drop, the price enters a period of consolidation within a defined, upward-sloping channel (or sometimes a rectangle). This forms the "flag" portion. It's a temporary counter-trend move where the bears take a breather.
Breakdown (Continuation of Downtrend): The price then breaks out of the lower boundary of the flag pattern, continuing the prior downtrend with renewed momentum.
Bear flags are considered continuation patterns, meaning they suggest that the preceding trend (in this case, a downtrend) is likely to continue after the pattern completes.
Is there a chance a reversal will follow the completed flag?

$CLOV - Bullish Divergence 30MClover has had strong downtrend movement on no news. Bullish divergence is forming on the 30M. If divergence confirms possible test of 50 SMA and consolidation before we see the next the next trend. Retail trader discovery of Counter Part Health's partnerships with Humana through subdomains could put a potential bottom and reverse the trend prior to earning. But will retail be enough to reverse course? Institutions want to see $2.20, $1.91

ToastyI'm really liking this chart and believe in the fundamentals. I believe we are seeing a pullback and have outlines 3 areas of support below. At least the first should be tested before another uptrend. I'd love it to get lower for selfish reasons and if it got to the 3rd green horizontal i'd buy some longer dated call options. FCF / EPS / Net margin all trending in the right direction.

UPST Classic BUMBUM ReversalNASDAQ:UPST Classic Bumbum is a new term and I will probably file copyrights to it 😃
UPST has attempted to breakout of a cup and handle twice on the weekly chart and failed.
The second attempt is extended and recently broke upward from the handle.
The Bumbum simultaneously formed a saucer formation in the process which is a bullish reversal trend.
With increasing volume and momentum and favorable market conditions I expect this to to easily scale the immediate resistance of $59, then to $85. At $85 there is probably a pullback to the $70is range before any catalyst could push it beyond $85 to the $120 range.
With the fundamentals of the company aligning favorably, this is a long term buy.

Outbreak RetracedA 9 months bottom building was followed by a stormy rise and almost tripled prices.
This rise was to fast and could not digested by the market, i.e. it was followed by an also fast retracement down.
Now the market may be in an equilibrium and we can have a closer look to the long term picture.
Since 2014 the stock has lost over 97 % of its value. From a respectable stock it has turned into a penny stock.
This may open chances for buyers. Of course Idon't see an upward correction of the 11 year long loss but even if we only can test the November 2024 level and reach the Ichimoku cloud this would be a gain of far over 100 %. By the way this would also be the previous bottom of 2022 and a natural resistance.

Illuminia.NYSE a Smilly Face Bigger Picture.Illuminia.NYSE has printed a Smiley face pattern as a Rounding Bottom trend.
This simple Trend is Positive sign, and often results in further upside.
I use the Trend Cloud Indicator to show potential entry and exit positions, and while it is a lagging indicator, does offer one a profit scenario in about 90% of my experience.
One needs to see the bigger picture of the Trend to avoid the noise and chose entry and exit positions so that we can maximise the Delta (Difference.)
As allways if you are unshure please consult with your own personal investment Advisor before making any Trades or Investments as most are 12 months or more views.
Should you appreciate my comments and chart studies - please smash that like button. It's just a click away.
Regards Graham
Happy Trade Investing.

Nike - This is the bottom!💉Nike ( NYSE:NKE ) creates the bottom now:
🔎Analysis summary:
More than four years ago, Nike created its previous all time high. We have been witnessing a downtrend ever since and a correction of about -70%. But with the recent retest of an important horizontal structure and bullish confirmation, Nike is about to create a potential bottom.
📝Levels to watch:
$65, $80
🙏🏻#LONGTERMVISION
Philip - Swing Trader

Update on the markets 7/7/2025SPY is at support after a down day, I expect a bit of a bounce overnight, but maybe not. USOIL is looking better, as Well as GOld. NG not really going anywhere yet. BTC still looks like it will drop.


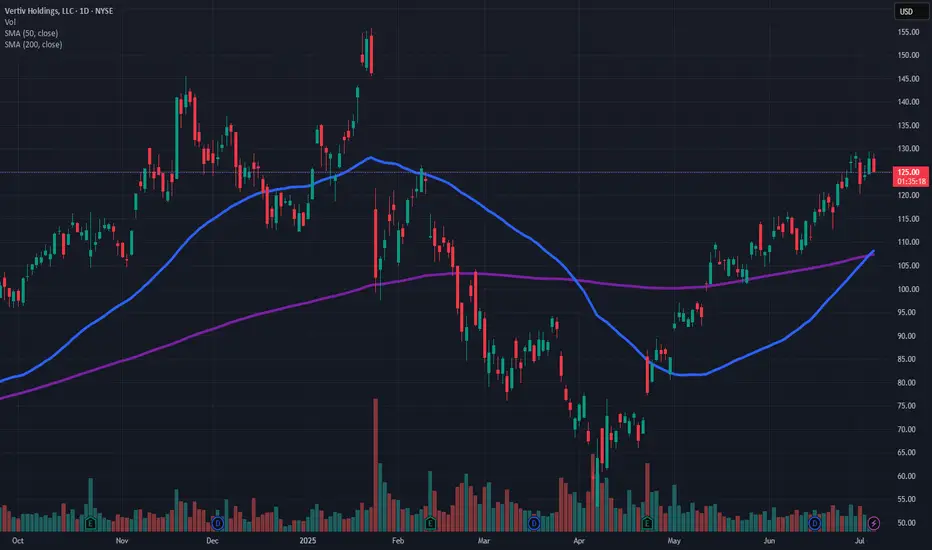
The Picks and Shovels of The AI Boom1. Six-Month Price Trend
Long-term uptrend: Over the past 6 months, VRT has climbed from ~ $54 to a recent high around $155—deep into a clear bullish channel
Pullbacks vs higher lows: Corrections have consistently bounced off rising trend-lines and key moving averages (50 & 200-day), reinforcing the uptrend .
🛡️ 2. Key Support & Resistance Levels
Support: Near the 50‑day SMA (~$108–$110)—previous pullbacks found strong buying interest here.
Fibonacci retracement zone: Around $117–$117.5 (61.8% from the 52-week high) also has historical support .
Resistance:
Around $155–$156, the recent 52-week high marks the first major hurdle.
Interim resistance around $128–$130, aligning with various pivot point R‑levels and the 6-month consolidation top .
📊 3. Momentum Indicators
Financhill & ChartMill: RSI ~66.6–69.7, moving toward overbought but not extreme
Barchart shorter: 62–64—still in bullish-neutral range
MACD
Positive MACD reading: Values range from ~0.11 to +5.7, indicating bullish crossover momentum
Histogram and signal remain supportive of upward momentum.
Stochastics & ADX
Stochastics: Hovering in the 80s (overbought) but often remains elevated during strong uptrends
ADX ~28–29: Indicates a strong trending stock
⚖️ 4. Overall Technical View
Moving averages: 8, 20, 50, 100, 200‑day (both SMA & EMA) are all positively sloped with price above each—bullish alignment across all timeframes
MACD & RSI: Bullish, with MACD above signal line and RSI in bullish territory (though nearing overbought).
Chart patterns: Active long positions, cup‑and‑handle formations, and break above 50 & 200‑day EMAs suggest continuation setups.
✅ 5. Conclusion
VRT is firmly in a bullish technical regime:
Uptrend confirmed by price structure and moving averages.
Momentum indicators (MACD, RSI, ADX) support continued upside.
Key levels to watch: Support near $117–$110, Resistance around $130 and $155.
Recommendation: The setup favours bullish continuation. That said, RSI nearing overbought (~70) suggests caution—look for short-term consolidation or mild pullbacks before new entries.
Final stance: Bullish, with an eye on consolidation phases for optimal timing.
🧭 6. Watch Points
Break above $155 on strong volume = next leg higher.
Drop below 50‑day SMA (~$108) with weakness could signal deeper retracement.
RSI sustaining above 70 may lead to short-term kicker higher—or signal an overextension pause.


CVNA Monthly resistance hit. CVNA has been a rocket ship. this would be the 3rd time it is hitting the level.

Amazon I Strong Bullish Outlook Welcome back! Let me know your thoughts in the comments!
** Amazon Analysis - Listen to video!
We recommend that you keep this pair on your watchlist and enter when the entry criteria of your strategy is met.
Please support this idea with a LIKE and COMMENT if you find it useful and Click "Follow" on our profile if you'd like these trade ideas delivered straight to your email in the future.
Thanks for your continued support!Welcome back! Let me know your thoughts in the comments!

Uber’s Path to $95+Uber Technologies (UBER) is positioning itself for long-term growth by expanding beyond its core ride-hailing and delivery businesses into advertising, travel, service partnerships, and autonomous vehicle (AV) technology. These strategic moves aim to diversify revenue streams and enhance operational efficiency.
Key Growth Drivers:
- Strong Core Business Performance – Uber continues to benefit from robust demand in both ride-hailing and delivery, generating significant economic profit.
- Artificial Intelligence Integration – AI plays a crucial role in optimizing pricing, reducing wait times, personalizing user experiences, and preventing fraud.
- Autonomous Vehicle Expansion – Uber is increasingly leveraging AV technology to reduce driver-related costs and scale its services.
- Strategic Investments – The company is using its strong cash flow to fund innovation, product development, acquisitions, and minority investments, driving long-term value.
- Capital-Efficient Growth – Uber’s ability to expand its service platform with minimal capital investment is expected to accelerate revenue growth and shareholder value creation.
Price Target & Options Flow:
Tigress Financial has raised Uber’s price target from $103 to $110, maintaining a Buy rating. Additionally, option flow on Uber is showing strong bullish activity, suggesting institutional interest. Given this momentum, Uber could potentially surpass $95 before August, especially if AV advancements and AI-driven efficiencies continue to strengthen its financial outlook

AFRM eyes on $50.66: Semi-Major Genesis fib for High Support AFRM has been showing considerable strength.
Hit a Geneiss fib above and fell back to sister fib.
Strong Bull trend would hold this fib into new highs.
$50.66 is the immediate floor to hold
$49.17 is a minor fib for a speed brake.
$47.60 is Bulls' Last Stand to hold uptrend.
=============================================
.

Stock Analysis Using Dr. Elder's Three Screens MethodAccording to Mr. Elder's method, I start my analysis with the senior chart, for me it's the Weekly. I look through the list of stocks looking for stocks with a price divergence to the MACD indicator. This is my "first Elder screen"
After that, I switch to the daily chart and look at the selected stocks on this time frame. This is my "second Elder screen"
And I do the same procedure with the selected charts on the hourly chart
On the Hourly chart, I see a great divergence of the price to the indicators.
pending order under the candle marked with an arrow, stop above it, take profit about 1:5

How Sell Side Institutions Move Price: BuybacksThere are Buy Side Institutions, aka Dark Pools, and there are Sell Side Institutions, the Money Center Banks and Giant Financial Services companies. These two groups dominate the market activity and move price in entirely different ways and for entirely different reasons.
Sell Side Institutions are short-term TRADERS. They are not allowed, nor do they wish, to hold stocks for the long term. The Sell Side trades stocks and has the most experienced, most talented, and most sophisticated floor traders in the world.
Buy Side Dark Pools have floor traders as well but they are strictly long-term investment companies managing the 401ks, pension funds, ETF long-term investments on behalf of the Middle Class of America and, in some instances, other nations.
Sell Side Institutions may buy a stock and hold for a few weeks or months but strictly for the short-term profits.
The Sell Side are also the Banks of Record who do the BUYBACKS on behalf of the Corporation which has made the decision by the Corporation's Board of Directors to do a buyback program, which tend to last many months or longer. Corporations do not have stock traders on staff. So the Bank of Record does the actual buying of the shares of stock.
The reasons for doing a Buyback:
To lower the outstanding shares which can create some momentum runs during high buying demand from retail groups and other investors.
Buybacks are intended to move price UPWARD in runs. The price range is established by the corporation. The runs are created by the Bank of Record.
Buybacks also increase dividend yields for long term investors, including pension fund investors.
NASDAQ:AAPL has a mega buyback that was approved in May but has just started now.
Buybacks can be a great strategy for trading stocks this year as many corporations will be doing buybacks due to the reduction of their taxes and more benefits to corporations.
Now is the time to start watching for buyback runs.

TESLA PRICE ACTION 7 JULY 2025I have clearly explained the price action for Tesla. I have tried my best to explain why you should not be aggressive here.
I have also discussed the stops
NOTE:DO NOT BUY CALLS

ZIMV Medical's bashed down +100% Long Term opportunity?Medical Stocks have been bashed of late.
All Medicals remain highly speculative, but can provided huge upside for the risky Investor or Trader.
Studying the PA (Price Action) and the Trend Curve can offer one entry positions.
Support and resistance Zones show a potential nice 100% upside.
As always if you are unsure, please consult with your own personal investment Advisor before making any Trades or Investments as most are 12 months or more views.
Should you apreciate my comments and chart studies - please smash that like button. It's just a click away.
Regards Graham

BAH Gaining Momentum With New DOD ContractsBAH recently fell after missing earning expectations, though the results were quite decent. It is currently sitting at 57% of 52 Weeks high. Seems oversold. Its AI products are going to contribute significantly to future revenues. Recently on June 16th, it won a DoD contract worth $96.07 million. Plus, the SMA (10) is finally crossing above SMA (50).
First target (A) seems to be $115 ish. If it breaks that resistance, 2nd target (B) seems to be about $122+.
NFA, just sharing my learning. :)

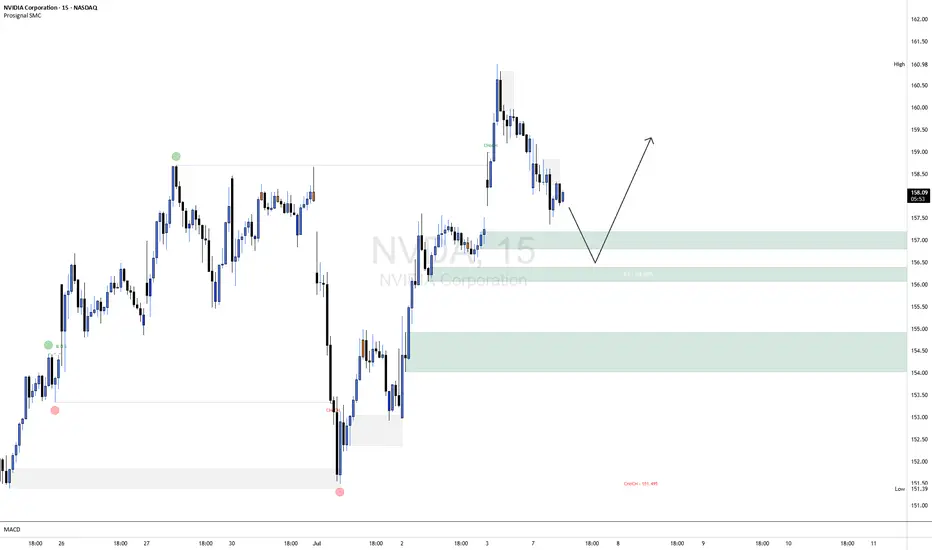
NVDA ShortNVDA is currently exhibiting short-term bearish order flow on the 15-minute chart, with price making lower highs and lower lows following a clear CHoCH (Change of Character) to the downside. The current leg suggests continued weakness as price retraces toward the highlighted bullish order block around the 156.20–157.00 range, aligning closely with the 50% equilibrium level of the last bullish impulse.
This area represents a high-probability demand zone where we anticipate a potential bullish reaction. A confirmation entry (e.g., bullish BOS or lower timeframe CHoCH within the OB) will be required to validate a long setup from this zone. Should confirmation present itself, upside targets can be trailed back toward recent highs near 159.00–160.00.
Risk Management Note:
Always wait for confirmation before entering against the prevailing short-term trend. Use a well-defined stop-loss below the order block and calculate your position size based on your overall risk tolerance (typically 0.5–1% of account equity per trade). Avoid overleveraging, and remember that patience and discipline are key to capital preservation.
3 Reasons the Meta (META) Double Top Is a Buy Signal3 Reasons the Meta (META) Double Top Is a Buy Signal – Rocket Booster Strategy Explained
Meta Platforms Inc. (META) recently printed what looks like a double top pattern on the 4-hour chart.
Many traders are expecting a reversal. But from my perspective, this setup could actually be a trap for early short-sellers. Here's why.
The overall trend remains bullish. Price is still trading above the 50 EMA and the 200 EMA, which confirms that the long-term and
short-term momentum is still upward. When a double top appears in a strong uptrend but fails to break the neckline, it often
becomes a fakeout. Instead of reversing, the price consolidates, shakes out weak hands, and then breaks higher. This is where my
strategy comes in.
I call it the Rocket Booster Strategy. It works like this:
1. First, the price must be above both the 50 EMA and 200 EMA. This confirms we’re in an active uptrend.
2. Then, if a bearish pattern like a double top appears but the neckline does not break, that’s a sign of a trap.
3. We wait for price to bounce near the neckline or break above the recent top. That’s the ignition point – the rocket is ready to fire.
In this Meta setup, if price holds above the neckline or quickly reclaims the recent high, it becomes a strong buying opportunity.
The pattern fakeout acts like fuel, giving bulls the momentum to push price even higher.
This is a high-probability setup because many traders get caught
in the trap, expecting a sell-off, and their stop-losses become buy fuel for the next rally.
Trade idea:
Entry: near neckline bounce or breakout above second top
Stop loss: below the neckline or under the 50 EMA
Target: new highs and above
Final thoughts:
Don’t fall for surface-level patterns. In strong uptrends, failed double tops are often just launchpads. The Rocket Booster
Strategy helps us spot the fakeout and ride the breakout.
How 3 Simple Conditions Turn a Double Top Into a Buy Signal
Most traders see a double top and expect a reversal. But in strong uptrends, this pattern can fail — and when it does, it often sets up
a high-probability buying opportunity. Traders who use the Rocket Booster Strategy understand how to spot these traps and trade them in the direction of the trend.
Here’s how the strategy works — and why some double tops become launchpads, not ceilings.
1. Price Above Both 50 EMA and 200 EMA
When price remains above the 50 EMA and 200 EMA, it confirms strong bullish momentum in both the short and long term. In
these conditions, many reversal patterns like the double top often fail. Instead of selling off, price consolidates and continues higher.
Traders using this strategy only look for buy setups when both EMAs are pointing up and price stays above them.
2. Bear Trap Setup
A double top often attracts sellers. These traders place their stop-losses just above the highs. If price fails to break the neckline and
instead rallies above the top, those stop-losses are triggered, creating a surge in buy orders. This becomes a trap — not a
reversal — and the breakout can be fast and aggressive. The Rocket Booster Strategy takes advantage of this liquidity burst.
3. Entry After Confirmation, Not Assumption
Instead of shorting the pattern, traders using the Rocket Booster Strategy wait for one of two bullish confirmations:
A bounce off the neckline without breaking below it
A breakout above the second top after the trap is set
At that point, the trend is considered intact, and momentum is ready to continue. The "rocket" is refueled, and the strategy shifts
into entry mode.
Trade Setup Example:
Entry: Near neckline bounce or breakout above second top
Stop Loss: Below neckline or under the 50 EMA
Target: New highs and above the pattern top
Final Thoughts
In strong trends, failed double tops are not warning signs — they’re opportunities. The Rocket Booster Strategy filters out weak signals by requiring clear alignment:
price above both EMAs, pattern failure, and bullish confirmation. When these conditions align, a pattern that looks bearish on the surface becomes a fuel source for the next breakout.
Disclaimer: This article is for educational purposes only and not financial advice. Always do your own research.
