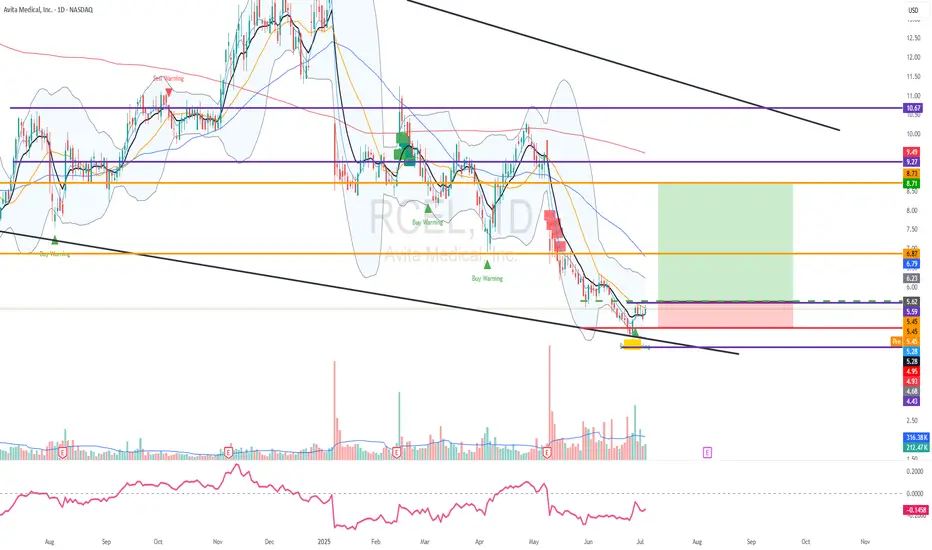
RCEL - Long-term falling wedge - Long setupWe've got smart money divergence on the smart money divergence scan on the 27th of June. If you look at the weekly chart, you'll see that there is a falling wedge pattern. And longer-term support that dates back eight years, and yes, that is still relevant. This is a speculative setup. Acorn likes this setup because of the long-term support. It has got some longer-term momentum potential. In the short term
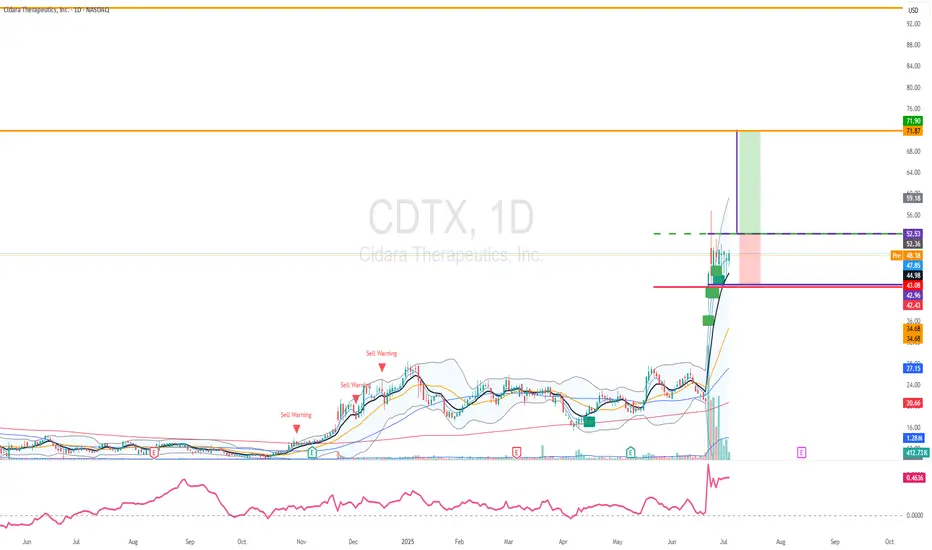
CDTX - Multi-day Smart Surge - Long setupCDTX is the next one. CDTX smart surge on the weekly for two weeks in a row! Smart surge on the daily five days in a row. This had some major smart surge back then when it started in April. This had some major buying, RA Capital Management purchased 100 million dollars worth, roughly, on June 26th, as reported. So we are looking for a break.
$EIX - Edison: Wild Fires, Double Bottom - A Trend Reversal? The decline from $88.77 looks to have completed its five-wave sequence.
Primary wave 4 (black) unfolded as a triangle, and the decline to $47.73 could be all of primary wave 5.
Primary waves 3 and 5, if the decline is complete, have created a double bottom reversal pattern.
$47.73 is the key invalidation level for the bullish outlook.

OLMA - Smart Surge + weekly divergence - Long setupOLMA - This is from the Smart Surge scan on Friday, the 27th of June. It was also from our smart money divergent scan on Friday, the 13th of June, where you can see it potentially bottomed there. And originally, I was also on a smart money divergent scan when it bottomed in April.

Boeing: Potential Pullback Ahead, But Long-Term Growth IntactCurrent Price: $215.92
Direction: LONG
Targets:
- T1 = $222.00
- T2 = $227.00
Stop Levels:
- S1 = $209.00
- S2 = $193.00
**Wisdom of Professional Traders:**
This analysis synthesizes insights from thousands of professional traders and market experts, leveraging collective intelligence to identify high-probability trade setups. The wisdom of crowds principle suggests that aggregated market perspectives from experienced professionals often outperform individual forecasts, reducing cognitive biases and highlighting consensus opportunities in Boeing.
**Key Insights:**
Boeing is riding bullish momentum within the industrials sector, buoyed by global aerospace recovery post-pandemic. While the company’s fundamentals are strong, technical indicators suggest near-term overbought conditions, potentially signaling a pullback. Geopolitical risks, including trade tensions, may create volatility, but the recent U.S.-Vietnam trade deal could open new markets and drive future growth.
Investors should monitor resistance levels between $222 and $227 carefully, as breaking above these points could indicate further upside potential. Continued demand for defense aircraft and increasing global airline orders bolster Boeing’s medium to long-term prospects, making it a compelling equity in its sector.
**Recent Performance:**
Recent price movements indicate robust upside momentum in Boeing, fueled by sector-wide strength in industrials and rising demand for aerospace products. RSI and MACD have moved into cautionary territory, suggesting near-term consolidation or retracement. However, supportive factors like industrial recovery and increased government procurement have kept Boeing trending upward. The company’s stock remains closely tied to macroeconomic recovery themes, such as higher consumer airline bookings and renewed defense contracts.
**Expert Analysis:**
While overbought signals are emerging, experts widely agree on the bullish potential of Boeing’s stock in a medium to long-term timeframe. Resistance levels near $222 and $227 are critical—as they represent key inflection points for market sentiment. At the same time, some analysts have flagged short-term risks around geopolitical tensions affecting aerospace trade. A break above $227 could lead to further buying pressure, while staying above $209 ensures robust downside support.
**News Impact:**
The recent U.S.-Vietnam trade deal aligns Boeing with strategic expansion in Southeast Asia, potentially unlocking new long-term growth avenues. Despite broader geopolitical trade risks, analysts believe Boeing could leverage these relationships to drive international aerospace orders. Additionally, the industrial recovery and stronger-than-anticipated defense procurements have underscored positive near-term sentiment, providing substantial tailwinds. Investors are advised to consider this while navigating short-term fluctuations and long-term opportunities.
**Trading Recommendation:**
Given Boeing’s current trajectory and resistance levels, traders should consider taking LONG positions while monitoring stop-loss levels ($209 and $193) to manage downside risks. Breaking resistance near $222 and $227 would confirm bullish continuation. With strong fundamentals, promising international expansion opportunities, and sector-wide momentum, Boeing remains an attractive trade for medium to long-term gains. Risk management is paramount given near-term volatility concerns, but the overall outlook remains positive for growth-oriented investors.

Apple: Next Week’s Long Trade Opportunity with Upside PotentialCurrent Price: $213.55
Direction: LONG
Targets:
- T1 = $225
- T2 = $240
Stop Levels:
- S1 = $210
- S2 = $200
**Wisdom of Professional Traders:**
This analysis synthesizes insights from thousands of professional traders and market experts, leveraging collective intelligence to identify high-probability trade setups. The wisdom of crowds principle suggests that aggregated market perspectives from experienced professionals often outperform individual forecasts, reducing cognitive biases and highlighting consensus opportunities in Apple.
**Key Insights:**
Apple continues to lead the technology sector with sustained bullish momentum. Strong seasonal trends averaging 13.4% gains during July and August further underscore its upside potential. AI-driven product developments and its role in mega-cap leadership positions it for ongoing strength, though near-term overextension risks persist.
**Recent Performance:**
Apple gained 6% last week, spotlighting its dominance among mega-cap stocks as a leader of the broader tech rally. While the "Magnificent 7" stocks, including Nvidia and Tesla, showed mixed signals, Apple has preserved relative strength and upward momentum.
**Expert Analysis:**
Portfolio managers have expressed confidence in Apple as part of the "big three" tech stocks, favoring its innovation and operational strategies despite valuation concerns. The mixed sentiment, with mentions of potential put activity, suggests cautious optimism, but its breakout above $213 highlights stronger short-term opportunities.
**News Impact:**
Apple’s AI initiatives, such as outsourcing Siri's development, contribute positively to market sentiment. Additionally, anticipation of earnings season strength in late July adds weight to bullish strategies. As mega-cap stocks maintain leadership, Apple’s pivot into AI-driven innovation reinforces its critical role in technological advancement.
**Trading Recommendation:**
Based on robust performance trends, seasonal advantages, and a supportive macro backdrop, a LONG position on Apple offers strong upside potential with defined risk parameters.

Caterpillar's Bullish Momentum Points to Extended GainsCurrent Price: $397.86
Direction: LONG
Targets:
- T1 = $407.80
- T2 = $415.75
Stop Levels:
- S1 = $390.50
- S2 = $384.00
**Wisdom of Professional Traders:**
This analysis synthesizes insights from thousands of professional traders and market experts, leveraging collective intelligence to identify high-probability trade setups. The wisdom of crowds principle suggests that aggregated market perspectives from experienced professionals often outperform individual forecasts, reducing cognitive biases and highlighting consensus opportunities in Caterpillar.
**Key Insights:**
Caterpillar continues to benefit from strong tailwinds in global infrastructure investments, particularly in developed nations seeking economic revitalization through construction and public works projects. The company's focus on innovating within heavy machinery, including more environmentally sustainable equipment, enhances its long-term appeal and positions it well against industry competitors. Additionally, technical signals show that the asset remains steadily above key support levels, reinforcing the bullish outlook.
**Recent Performance:**
Caterpillar has demonstrated consistent resilience, outperforming broader market indices in recent weeks. The stock price has increased by approximately 6% in the last month, driven by robust quarterly earnings and positive forward guidance. This indicates healthy investor sentiment and confidence in Caterpillar's ability to navigate current market conditions, including inflationary pressures and energy price fluctuations.
**Expert Analysis:**
Industry analysts continue to assign high price targets for Caterpillar, citing its leadership in the heavy equipment and machinery sector as a significant competitive advantage. The diversification of its product line and its ability to capture market share in emerging markets bolsters its projected growth. Caterpillar's commitment to innovation in both machinery and operational efficiency has attracted long-term investors, solidifying the stock as a popular pick for capital appreciation.
**News Impact:**
Recent announcements regarding Caterpillar's expansion efforts into emerging markets and increased government contracts for infrastructure-related equipment have ignited optimism among investors. Additionally, favorable macroeconomic developments, such as global spending on infrastructure projects, have acted as a tailwind, further amplifying expectations of continued strong performance.
**Trading Recommendation:**
Given its resilience, favorable macroeconomic setup, and technical strength, Caterpillar offers an attractive opportunity for long positions. Investors should consider the outlined targets and stops for entry points, keeping in mind the ongoing positive sentiment and bullish factors driving the asset forward. This trade setup provides a high-probability scenario to capture extended gains in the heavy machinery sector.

Costco: Strong Membership Model Suggests Bullish Upside Current Price: $987.02
Direction: LONG
Targets:
- T1 = $1,016.00
- T2 = $1,032.00
Stop Levels:
- S1 = $957.00
- S2 = $940.00
**Wisdom of Professional Traders:**
This analysis synthesizes insights from thousands of professional traders and market experts, leveraging collective intelligence to identify high-probability trade setups. The wisdom of crowds principle suggests that aggregated market perspectives from experienced professionals often outperform individual forecasts, reducing cognitive biases and highlighting consensus opportunities in Costco.
**Key Insights:**
Costco's membership-driven model continues to thrive in a challenging economic climate, characterized by inflationary pressures and uncertain economic outlooks. Consumers are increasingly drawn to the value and cost-saving advantages offered through bulk purchases and exclusive benefits. This positions Costco as a defensive retail stock, appealing to investors seeking stability in turbulent markets. Furthermore, its strong customer loyalty and ability to generate predictable revenue streams make it attractive during periods when discretionary spending tightens.
Costco is also leveraging technology, particularly trends like AI, to streamline operations and improve supply chain efficiency. This strategic use of innovative tools ensures competitive pricing, mitigates potential supply issues, and enhances profit margins. Traders should keep a watchful eye on how these advancements influence quarterly results and broader investor sentiment.
**Recent Performance:**
Costco has been trading near historical highs, delivering resilience even amid broader economic challenges. At $987.02, the stock exhibits strong momentum, supported by favorable financial metrics such as consistent revenue growth and a growing membership base. This performance reflects the company's robust fundamentals and its ability to thrive despite macroeconomic headwinds.
**Expert Analysis:**
Industry analysts are largely bullish on Costco due to its distinct positioning in the retail sector. Unlike many peers, Costco benefits from a focus on essential goods and services, making it less vulnerable to sudden changes in spending patterns. Experts are optimistic about its pricing power, scale advantages, and ability to expand margins through operational innovation, which together enhance its growth trajectory. While some external risks such as rising interest rates and energy costs persist, Costco's defensive characteristics provide substantial protection against volatility in the broader market.
**News Impact:**
Recent economic data points to tightening discretionary spending, which works in Costco's favor given its focus on essential goods. Inflationary conditions further amplify the appeal of the company's bulk purchasing model, while its ability to control operational costs protects margins even in less favorable environments. Meanwhile, ongoing global supply chain concerns and trade tariffs could create modest headwinds, but Costco's scale and efficiency offset these risks to a significant extent.
**Trading Recommendation:**
Costco's strong fundamentals and consistent growth make it an attractive candidate for a long position. The stock demonstrates stable demand and earnings resilience, even in challenging economic environments, backed by its membership model and operational innovations. The outlined price targets offer an excellent risk-reward ratio, with upside expected from continued execution success and strategic initiatives. Investors seeking defensive growth should consider entering long positions at current levels.

GOOGLE Count changed, Bullish outlook.I have adjusted NASDAQ:GOOG NASDAQ:GOOGL Elliot wave count with a wave 1 completing a leading diagonal backed up by a deep wave 2 correction into High Volume Node support (HVN). We potentially have another 1-2 with fast drop and recovery to the S1 daily pivot which would make long term outlook extra bullish by extending target.
Wave 3 is underway with a target of the all time hime high HVN for wave 5. The next resistance HVN is $191.
Price above the daily pivot and is continuing upwards after testing as support.
Analysis is invalidated below $162 swing low.
Safe trading

TSLA: short as short can...below 200 certainly worth considering a reentry, but currently not sure if it will stop at 200 of 150.

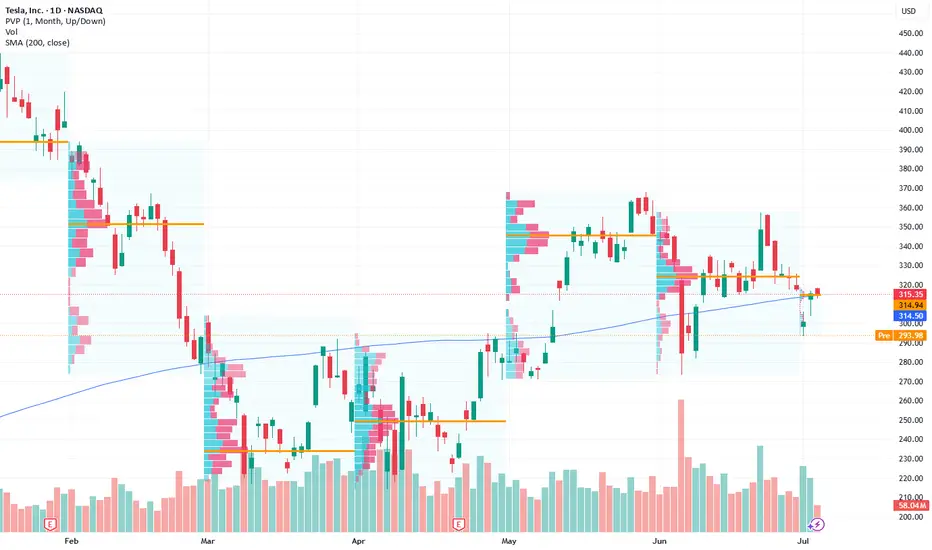
Tesla: Ticking Higher on Consolidation Breakout Potential
Current Price: $315.35
Direction: LONG
Targets:
- T1 = $322
- T2 = $330
Stop Levels:
- S1 = $310
- S2 = $305
**Wisdom of Professional Traders:**
This analysis synthesizes insights from thousands of professional traders and market experts, leveraging collective intelligence to identify high-probability trade setups. The wisdom of crowds principle suggests that aggregated market perspectives from experienced professionals often outperform individual forecasts, reducing cognitive biases and highlighting consensus opportunities in Tesla.
**Key Insights:**
Tesla’s stock has been consolidating within a narrow range of $305–$320, reflecting investors' cautious optimism ahead of potential catalysts. Technical resistance at $322 is acting as a key breakout point that could open the path to higher price levels. The bullish sentiment is fueled by improving production efficiencies, ongoing expansion in international markets, and Elon Musk’s ambition to transform Tesla into a broader technology conglomerate. However, concerns surrounding increasing competition in the EV market and potential headwinds from regulatory changes remain significant risks.
**Recent Performance:**
Tesla’s recent price action has showcased volatility while maintaining key support levels around $301.11. The stock has demonstrated resilience, holding firm during tech sector corrections. Over the past month, Tesla has seen short-term rallies driven by positive speculation about its EV lineup, alongside broader optimistic movement in the S&P 500. Investors have stayed engaged, with trading volumes suggesting sustained interest despite external pressures.
**Expert Analysis:**
Market experts underscore $322 as a critical resistance level that serves as the decision point for renewed momentum. The stock's recent consolidation pattern signals a possible breakout, assuming macroeconomic conditions remain favorable. Analysts have also cautioned about rising competition from other EV manufacturers like BYD, which intensifies pressure on Tesla's pricing strategy and market share. Nevertheless, Tesla’s ambitious pipeline, including autonomous driving technologies, remains a significant source of long-term investor confidence.
**News Impact:**
Tesla’s near-term outlook is influenced by competing factors. On one hand, reports of a lower-cost EV could dramatically increase its addressable market, while ongoing advances in AI and battery technologies enhance the company’s competitive edge. On the other hand, upcoming expiration of federal EV tax credits and increasing geopolitical scrutiny over Musk’s public statements may weigh on investor sentiment. Despite this, news of expanded production capabilities in Gigafactory Nevada has bolstered optimism regarding Tesla’s capacity to scale effectively.
**Trading Recommendation:**
Taking a long position in Tesla appears favorable as price action signals bullish momentum within its established range. The short-term trade targets $322 followed by $330, with stop-loss levels placed at $310 and $305 to manage downside risk. Traders are advised to monitor any developments in macroeconomic conditions and competitive activity, which remain key influences on price trajectory.
BULL: Shakeout!BULL: Shakeout!
.
Will you join the plan?
US STOCKS- WALL STREET DREAM- LET'S THE MARKET SPEAK!

AAAPL: Updated Outlook and Best Level to BUY/HOLD 70% gains________________________________________
Apple Outlook: July 2025–Q1 2026
After peaking near $200 in late May, Apple (AAPL) remains under correction territory despite pockets of resilience, closing July around $193. The current correction is projected to persist until Q1 2026, as global macro and policy headwinds weigh on the broader tech sector. Technicals suggest AAPL could find its cycle low between Q3 and Q4 2025, potentially setting the stage for a renewed bull run into late 2026. Pullback until 170/175 USD. 📉
Catalysts Shaping Apple’s Stock Price in 2025–26
1. AI Integration and Apple Intelligence
Strength: 9/10
The roll-out of on-device Apple Intelligence features—including an upgraded Siri, ChatGPT integrations, and generative AI tools—continues to build anticipation for a major iPhone upgrade supercycle. Initial adoption has been strong, but broader impact will hinge on Q4 developer and enterprise feedback. 🤖
2. Services Segment Growth
Strength: 8.5/10
Apple’s Services business (App Store, iCloud, Apple Music, AI-powered subscriptions) is projected to post double-digit growth into Q4 2025, with consensus revenue estimates at $25–27B for the quarter. Analysts see upside from new AI-driven service bundles, which could add $5–8B in annualized revenue by 2026. 💡
3. Gross Margin Expansion & Cost Efficiencies
Strength: 8/10
Apple’s gross margin is forecast to improve by up to 60 basis points in Q4 2025 as the product mix tilts toward higher-margin services, and as component costs ease. Operational efficiencies from supply-chain automation may further cushion profit margins amid macro uncertainty. 📊
4. iPhone 17 Product Cycle
Strength: 7.5/10
The iPhone 17 lineup—rumored to include advanced polymer batteries and potential foldable form factors—is expected to launch Q4 2025, giving Apple a competitive hardware edge versus Android rivals. Early channel checks point to pent-up demand, though upgrade rates may lag previous cycles due to consumer caution. 📱
5. Vision Pro & Hardware Diversification
Strength: 7/10
Next-gen Vision Pro headsets and new AR/VR devices, boosted by Apple Intelligence, are expected to drive incremental growth in Q4 2025. However, high price points and limited mainstream adoption keep near-term impact contained. 🥽
6. Share Buybacks & Dividend Policy
Strength: 7/10
Apple’s $110B share buyback authorization and steady dividend growth provide valuation support, but recent market volatility has prompted a more cautious pace of repurchases. Yield-seeking investors are watching closely for any pivot in capital return policy if macro pressures persist. 💵
7. Supply Chain & Trade Policy Risks
Strength: 6.5/10
Escalating U.S.–China trade tensions—including the risk of expanded tariffs or tech export bans—remain a top concern. Apple is accelerating its assembly shift toward India and Vietnam to diversify risk, but any new policy shocks in Q4 could hit margins and unit volumes. 🌏
8. Regulatory & Antitrust Pressures
Strength: 6/10
The EU’s Digital Markets Act and potential U.S. antitrust probes could force Apple to further open up its iOS ecosystem by year-end, potentially capping Services revenue growth and adding compliance costs. ⚖️
9. Macro & Interest-Rate Environment
Strength: 5/10
With the Fed signaling “higher for longer” rates through mid-2026, tech sector valuations remain under pressure. Analysts see this limiting multiple expansion even if EPS growth resumes in late 2025. 📈
10. Smartphone Market Competition
Strength: 5/10
Aggressive pricing and innovation from Samsung and Chinese OEMs are intensifying competitive pressures, especially in emerging markets. Apple’s share gains are likely to slow until the macro environment improves and new hardware cycles fully materialize. 🥊
________________________________________
Analyst Projections for Q4 2025:
• Consensus Revenue: $108–112B (up ~4% YoY)
• EPS Estimate: $2.30–$2.42
• Gross Margin: 45–46%
• iPhone Unit Growth: 2–3%
• Services Revenue: $25–27B
Morgan Stanley and JP Morgan maintain “Overweight” ratings, but expect rangebound performance until macro and trade uncertainty clears. Most price targets for Q4 2025 hover between $195–$215, with upside potential post-correction into 2026. 📊
________________________________________
Analyst / Firm Date Rating Price Target (USD)
Barclays 06/24/2025 – 173 ()
Jefferies (E. Lee) 07/01/2025 Hold (Upgraded) 188.32
UBS (D. Vogt) 07/03/2025 – 210.00
J.P. Morgan (S. Chatterjee) 06/26/2025 Overweight 230.00
Morgan Stanley (E. Woodring) 03/12/2025 Overweight 252.00
Evercore ISI 01/31/2025 – 260.00
Redburn Partners 01/31/2025 – 230.00
D.A. Davidson (G. Luria) 05/02/2025 – 250.00
TradingView Consensus (avg) – Consensus 228.98
TipRanks Consensus (avg over 3mo) – Consensus 226.36

Time to buy? Too much negative press. Buy in Fear- Updated 7/7Apple has faced prolonged downward pressure from bearish investors. Despite its best efforts and some dips, the stock has steadily maintained a baseline price of 200 USD. The flag pattern required some adjustments along its path to break out, primarily due to geopolitical issues and economic variables. Ultimately, Apple broke out to the upside in the week of June 30th, as predicted in my earlier posts. This breakout resulted from end-of-Q2/H1 sell pressure, delivering a 7.56% gain or 15 USD. This is a very bullish sign for Apple, and with the tailwinds forming for September product releases, we can expect further gains as traders return and volume increases.
If Apple follows its historical profit trajectory (see pink line), we could see a new all-time high (ATH) in the region of 270 USD in September. The green resistance and support levels are highlighted, and I may use these to adjust my position, considering whether to short or go long once confirmation is established on the daily timeframe.
Apple has significantly underperformed compared to the other Magnificent 7 stocks, but I don’t believe it’s a company you should bet against in the current climate. With a slow rollout of AI and recent statements from Apple, they may not always be first to market, but they generally execute well. The remarks regarding Sony, Samsung, and Netflix by Apple were very revealing and demonstrate a solid long-term strategy. However, there may be some bumps along the way as they work toward their goals, potentially involving acquisitions.
The fear spread in the media is similar to the FUD (fear, uncertainty, doubt) often associated with Bitcoin, and this is typically a good time to buy. Remember the saying: if retail investors miss the boat, it’s gone, but if institutions miss it, they often bring the boat back.
While this is not financial advice, based on the green weekly candle, it's hard not to pay attention, and Apple may now have a very positive year ahead! Especially with the weakening dollar and reports stating that this will benefit them greatly.
My large long position is still intact, and my target price will depend on how we manage supports and resistances. I am looking to take profits at over 260 USD.

Howmet Aerospace: Navigating Geopolitics to New Heights?Howmet Aerospace (HWM) has emerged as a formidable player in the aerospace sector, demonstrating exceptional resilience and growth amidst global uncertainties. The company's robust performance, marked by record revenues and significant earnings per share increases, stems from dual tailwinds: surging demand in commercial aerospace and heightened global defense spending. Howmet's diversified portfolio, which includes advanced engine components, fasteners, and forged wheels, positions it uniquely to capitalize on these trends. Its strategic focus on lightweight, high-performance parts for fuel-efficient aircraft like the Boeing 787 and Airbus A320neo, alongside critical components for defense programs such as the F-35 fighter jet, underpins its premium market valuation and investor confidence.
The company's trajectory is deeply intertwined with the prevailing geopolitical landscape. Escalating international rivalries, particularly between the U.S. and China, coupled with regional conflicts, are driving an unprecedented surge in global military expenditures. European defense budgets are expanding significantly, fueled by the conflict in Ukraine and broader security concerns, leading to increased demand for advanced military hardware incorporating Howmet’s specialized components. Simultaneously, while commercial aviation navigates challenges like airspace restrictions and volatile fuel costs, the imperative for fuel-efficient aircraft, driven by both environmental regulations and economic realities, solidifies Howmet’s role in the industry’s strategic evolution.
Howmet's success also reflects its adept navigation of complex geostrategic challenges, including trade protectionism. The company has proactively addressed potential tariff impacts, demonstrating a capacity to mitigate risks through strategic clauses and renegotiation, thereby protecting its supply chain and operational efficiency. Despite its premium valuation, Howmet’s strong fundamentals, disciplined capital allocation, and commitment to shareholder returns highlight its financial health. The company's innovative solutions, crucial for enhancing the performance and cost-effectiveness of next-generation aircraft, solidify its integral position within the global aerospace and defense ecosystem, making it a compelling consideration for discerning investors.

TSLA Honey Ticking Bull Trap! UPDATE 1This is an updated chart, as I keep being prompted to reach "My Target" by TV.
No matter how bad things get for Elona and TSLA, there are always people who are willing to pile in and buy at any price. The problem is the chart is showing lower highs, as TSLA no longer attracts the people needed to boost price, just like TSLA the brand. As a result, people keep getting honey ticked.
Don't Get HONEY TICKED!
As I always say, never EVER!! Invest in toxic people like Elona. They always blow themselves up in the end. It's in their nature!
Click Boost, Follow, subscribe, and let's reach 5,000 followers. ;)

$MQ looks good"Marqeta is a modern card issuing platform that provides the infrastructure and tools for businesses to create, manage, and control payment card programs, including debit, prepaid, and credit cards. They offer an open API platform that allows companies to build customized payment solutions, manage transactions in real-time, and gain insights into card usage. Essentially, Marqeta enables businesses to issue and manage their own branded payment cards, rather than relying on traditional banking systems"
"Marqeta is used by a variety of companies, particularly those in the fintech, on-demand delivery, and digital banking sectors. Some of Marqeta's notable customers include Klarna, Uber, Coinbase, DoorDash, and Western Union. Marqeta's platform allows these businesses to issue cards, manage payments, and build custom financial products. "
Yes I copy and pasted because I'm lazy. But these huge companies rely on their card issuing and management software. Looks like its either ready to break out, targeting a $9-$12 range.
Or if we don't break out now looking for further accumulation near $5 support.

DQ heads up into $19: Major Resistance to book some profitsDQ has been flying off our bottom call (see below).
Now testing a major resistance zone at $18.69-18.99
Good spot to book some profits and look for a dip to buy.
.
Previous analysis that called the BOTTOM:
===================================================
.

Pullback soon and then Rocket launchWe may have a pullback towards mid 20s. I guess this will launch rocket gains next year to hit 90s. Happy trading !! not a financial advice.

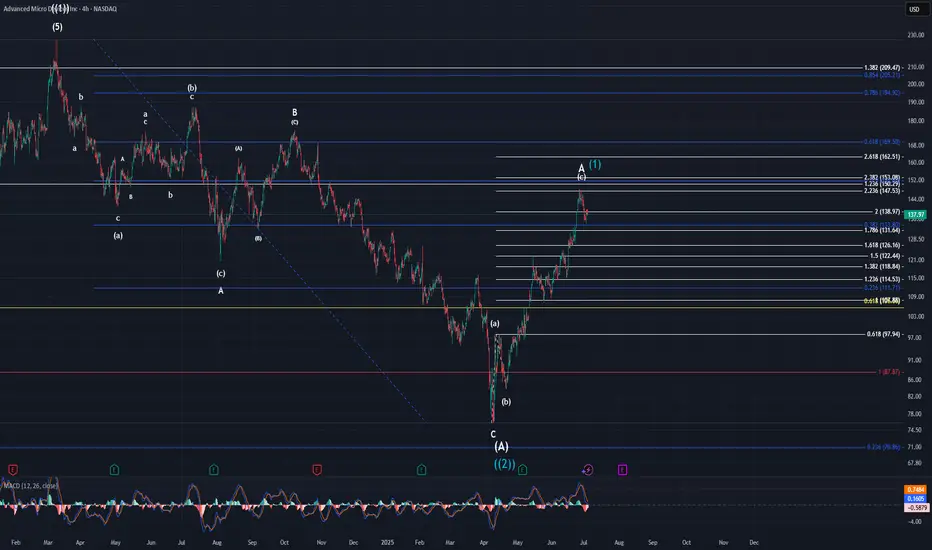
AMD UpdateAs I have mentioned, this move higher is either an extended minor A wave, or it is the beginning of another bull run. I side with the extended A wave due to not only the structure of the chart, but also the broader market as a whole. If this is the case, then price will likely drop to the $100-$110 area to complete minor B. Minor C would ideally take us back up to the $170-$190 area completing intermediate (B). I cannot say how long all of this will take us, but intermediate (A) took 13 months to complete. It would not be a stretch to say we still have 8-10+ months before (B) completes.
Let's just take this one step at a time though. That means we need to watch for price to take us to the low $100's for minor B next.
Apple UpdateThe way this pattern has been moving is very indicative of a B wave. It has been complex and very choppy. Needless to say, I have removed the lower target box from the chart and believe we should be headed to the upper larger target box from here. It appears, to my eyes, that price is within the micro-wave 3 of (c) of B. Once B completes, price should be headed to the $150-$110 area to complete minor wave C. This won't happen overnight but will take time. Be patient as these things can take a while.

BAC – Building the Base for a Breakout?Bank of America (BAC) has been consolidating quietly, attracting attention as it sits near a key mid-range level. With a 52-week low of $33.06 and a 52-week high of $48.08, the stock currently trades around $36.92 – roughly 11% above its low and 23% below its high.
This setup could be the calm before the move.
💥 Technical Outlook & Strategy
With financials holding steady and macro headwinds softening, BAC might offer a solid swing trade or medium-term positioning opportunity.
📌 Entry Points to Watch
$36.90 – Market price, if volume picks up near support
$33.30 – Prior breakout area and potential pullback support
$30.50 – Strong support and near the 52-week low for aggressive buyers
🎯 Target Levels
$39.80 – Short-term resistance; previous rejection zone
$43.50 – Fib retracement from the high, medium-term target
$47.50–48.00 – 52-week high retest, bullish scenario
🧠 Narrative to Watch
With potential Fed pauses on rate hikes, improving margins, and relative stability in U.S. banks, BAC could be positioning for a slow grind higher. Watch for earnings momentum and bond yield trends.
⚠️ Disclaimer
This analysis is for informational and educational purposes only and does not constitute financial advice. Always do your own research or consult with a licensed financial advisor before making trading decisions.

Is Citigroup (C) the Most Undervalued Big Bank Right Now?🔥Let’s talk numbers:
🧮 P/E: 9.78x
💸 P/S: 0.66x
That’s deep value — Wall Street’s sleeping on this one. While everyone's chasing AI, Citigroup is trading at garage sale prices.
🧠 The Setup:
If you're into swing plays with strong R/R and macro upside, C is worth a look.
🔑 Entry Zones: 1️⃣ Market price — for early bulls
2️⃣ $55 — breakout confirmation
3️⃣ $48 — bargain bin steal
🎯 Targets:
TP1: $70 🟢
TP2: $78 🚀
TP3: $84 💰
💬 Why it matters:
Citi has been lagging behind peers like JPM, but it’s still a beast. If the Fed holds or cuts, banks could catch a serious bid — and this one’s ready to pop from a value base.
📌 Watching volume at $55 and any macro shifts as catalysts.
👀 Don’t ignore this one just because it’s not trending. That’s where smart money hides.
📢 Disclaimer:
This is not financial advice. Just sharing ideas and setups I’m watching. Always do your own research and manage your risk.
#Citigroup #C #Undervalu
#Citigroup #C #UndervaluedStocks #SwingTrade #TradingSetup #DeepValue #Banking #PEratio #SmartMoneyMoves #StockMarket #Financials #Watchlist
