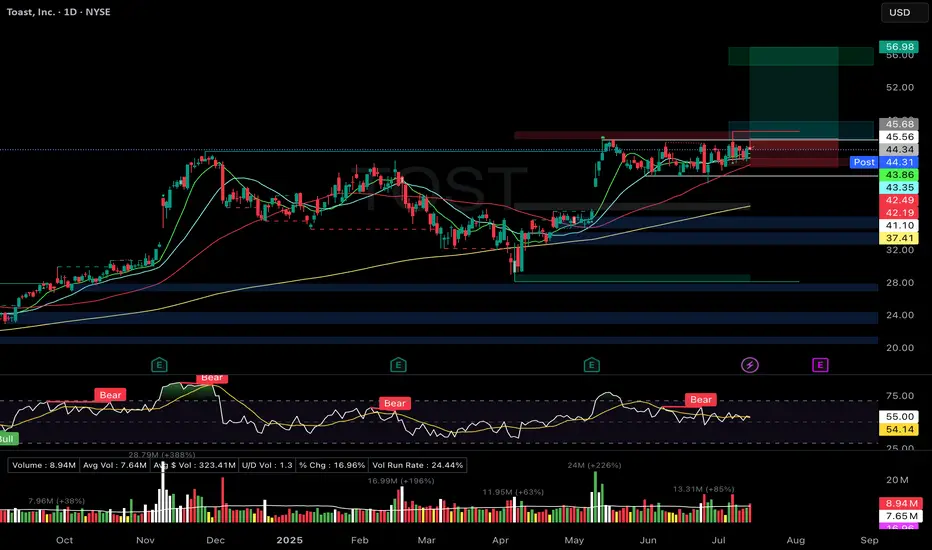
TOST Flat Base Breakout AttemptToast Inc. (TOST)
🚀 Entry: $45.68
📊 Setup: Flat Base Breakout Attempt
🛑 Stop: $42.19
🎯 Target: $56.98
🔑 Why I Entered:
Ideal flat base formation, tight consolidation under $45.56 pivot with volume drying up neatly between key moving averages.
Clear bullish moving average stack (rising 10/21/50/200 DMA).
Strong relative strength rating (92) with accelerating EPS growth signaling fundamental leadership.
🎯 What's Next:
Confirming breakout with strong volume above $46.00 pivot; will tighten stops accordingly once confirmed.
Earnings expected in four weeks—will closely manage the position as the event approaches.
Is it right time and choice to buy UNH Stock - {15/07/2025}Educational Analysis says that UNH Stock (USA) may give trend Trading opportunities from this range, according to my technical analysis.
Broker - NA
So, my analysis is based on a top-down approach from weekly to trend range to internal trend range.
So my analysis comprises of two structures: 1) Break of structure on weekly range and 2) Trading Range to fill the remaining fair value gap
Let's see what this Stock brings to the table for us in the future.
Please check the comment section to see how this turned out.
DISCLAIMER:-
This is not an entry signal. THIS IS FOR EDUCATIONAL PURPOSES ONLY.
I HAVE NO CONCERNS WITH YOUR PROFIT OR LOSS,
Happy Trading.

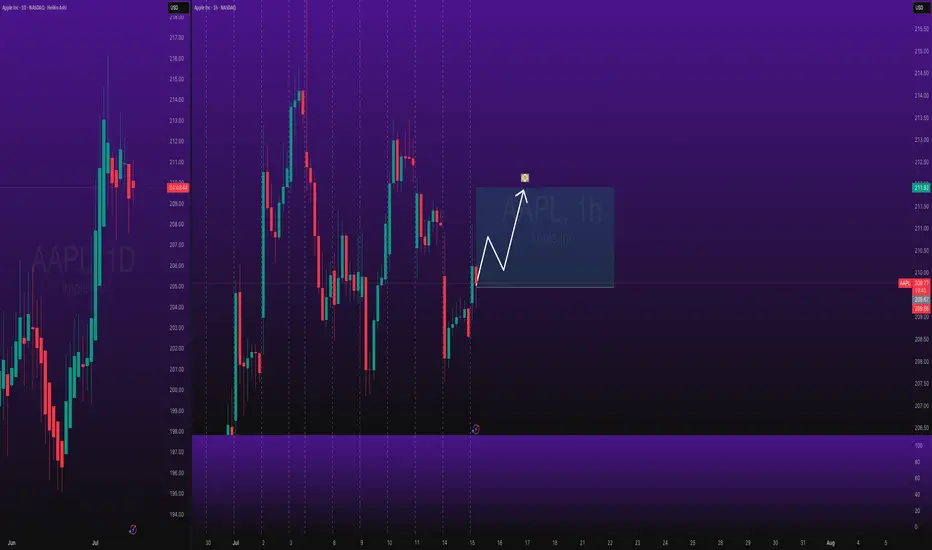
Stocks SPOT ACCOUNT: APPLE stocks Buy Trade with Take ProfitStocks SPOT ACCOUNT:
MARKETSCOM:APPLE stocks my buy trade with take profit.
This is my SPOT Accounts for Stocks Portfolio.
Trade shows my Buying and Take Profit Level.
Spot account doesn't need SL because its stocks buying account.
Looks good Trade.
Disclaimer: only idea, not advice
Time for Lucid Group Inc. (LCID) – Short-Term Bullish --3.50 USDLucid Group Inc. (LCID) on the 4-hour chart is showing a moderately bullish structure, suggesting potential for continued short-term upside. After a period of consolidation and base-building, the price has broken above key moving averages (MA5, MA10, and MA30), which are now turning upward and beginning to act as dynamic support. This shift indicates improving technical sentiment. The nearest resistance is around the $3.08 level — a zone defined by previous swing highs. A confirmed breakout above this level could pave the way toward the next target around $3.50, which represents both a psychological threshold and a former supply zone.
Supporting this bullish outlook, momentum indicators (likely WaveTrend or Stochastic RSI) are signaling continued upside pressure without yet showing strong overbought conditions. However, caution is warranted: if the price gets rejected at the $3.08 resistance, a pullback toward the $2.70–$2.75 support area is possible. Holding that support would be crucial for maintaining the current higher-low structure. Overall, the technical setup favors a move toward $3.50, but it requires follow-through from buyers at key resistance levels.
Potential TP : 3.50 USD

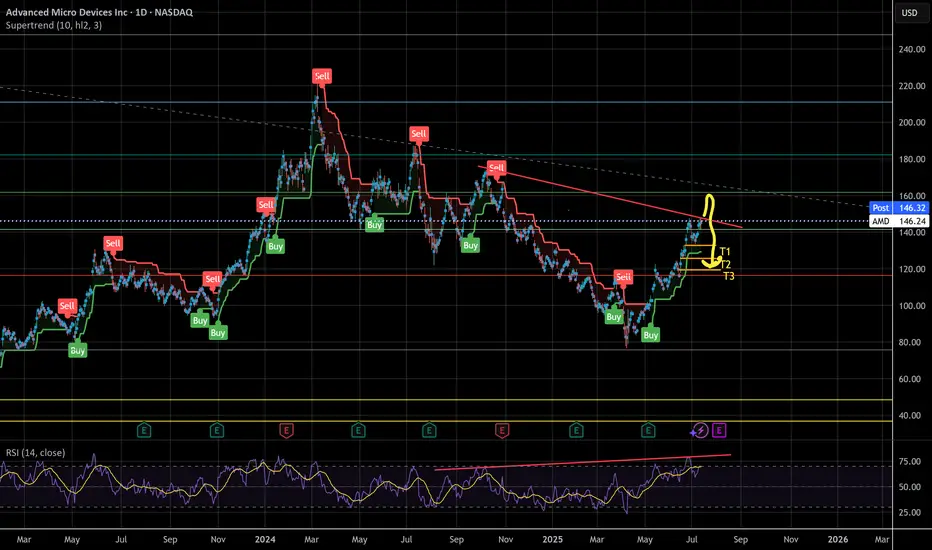
Must go down to go upI think AMD needs to cool off before it continues further, possibly tapping $160 first before a serious correction. Targets are listed at the strong support ending at $120. RSI printing bearish divergence on multiple time frames
Look at the red line, look at the direction of price. It's still a downtrend.
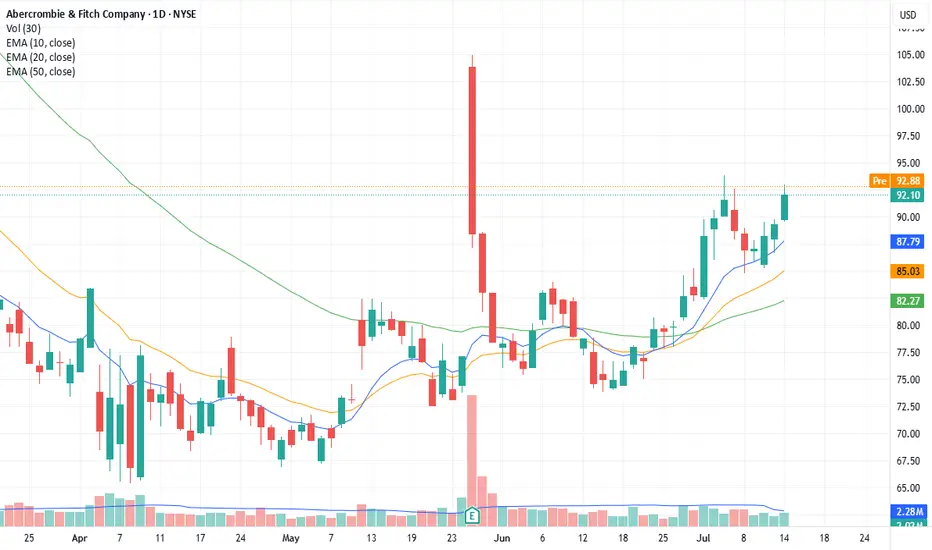
ANF break out1) uptrend since mid june
2) drying of volumes
3) breaking through the $92.10 line
4) entry $92, stop loss at $89.50
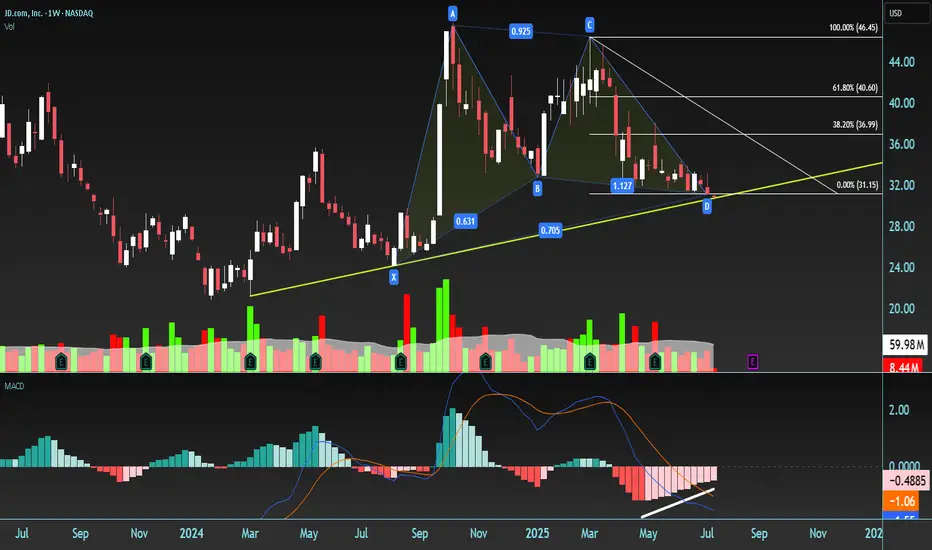
Bullish Gartley Pattern – Trade Setup on JD.comPotential Bullish Gartley pattern has formed with the following structure: XABCD.
initial low X = 23.45 , Price rallies to point A, then forms a corrective structure down to
D = 30.71 trough BCD. CD leg is downward, completing the pattern.
Despite the decline, point D is higher than X, suggesting a bullish setup. The area around D (30.71) is identified as a Potential Reversal Zone (PRZ).
Confluences Supporting a Long Entry
1. Gartley Completion at PRZ
Point D lies near the 78.6% Fibonacci retracement of the XA leg — a typical Gartley completion level.
2. Rising Support Trend Line
D is aligned with a yellow ascending trend line, reinforcing it as a potential bounce area.
3. MACD Bullish Divergence
Price makes a lower low into D, while MACD forms a higher low, signaling bullish momentum divergence.
Trade Plan
* Enter long after confirmation via a strong bullish candle*(e.g., bullish engulfing, hammer)
* Preferably accompanied by above-average volume
Stop Loss:
* Place stop just below point D (30.71)
* Allow a small buffer (e.g., 1–2% below) to account for noise
Targets – Fibonacci Retracement of CD Leg:
1. Target 1 – 38.2%
2. Target 2 – 61.8%
3. Target 3 – 78.6%
4. Target 4 – 100% (full retracement of CD)
Risk Management:
* Use appropriate position sizing (e.g., risk only 1–2% of total capital)
* Consider trailing the stop as targets are hit to lock in profits
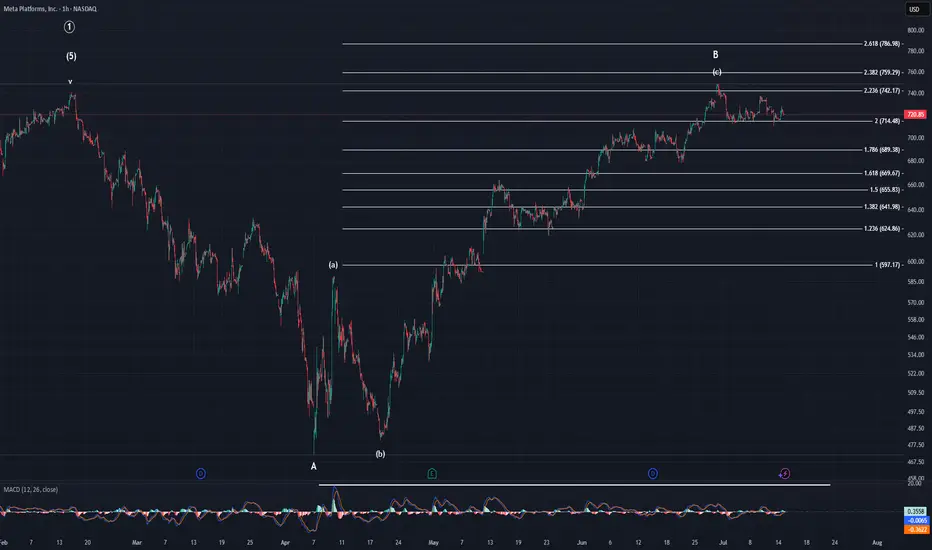
MetaSince the last post I made price has yet to make a new high. It has managed to chop in this area with a slight downward bias. If we're on the verge of the top of the indices, there is no reason to think Meta will continue higher much longer. This pattern, which is clearly corrective in nature, is way overextended. We started off with a 3-wave move higher off the April low and have risen all the way to the 2.236. Even if you could somehow say this is impulsive, it would still be over extended. So, no matter how you look at this pattern, it is in need of a correction. The question is how will that correction look. IMO, it will look like a minor C wave of intermediate (A). However, if it is somehow impulsive, then it would look like either minor A just now starting, or a smaller degree wave 2.
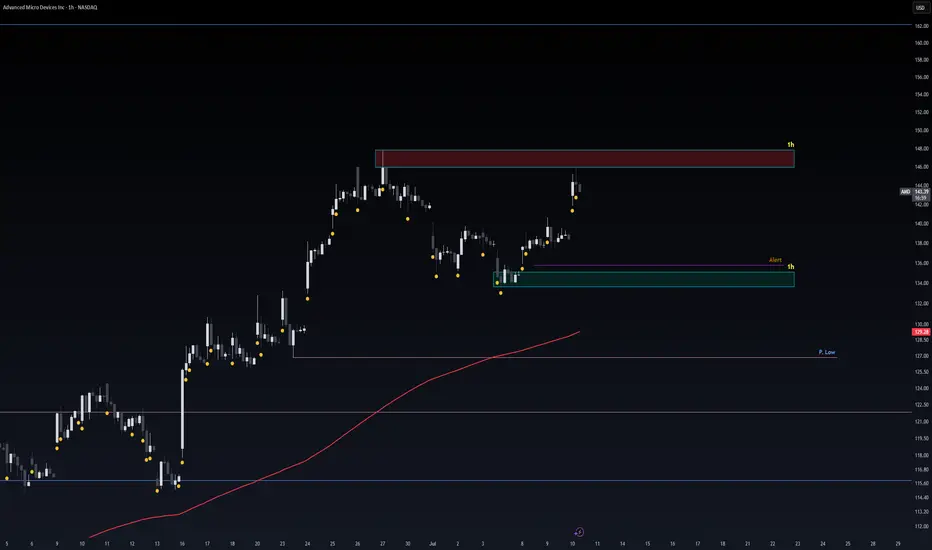
Safe Entry Zone AMDPrice Rejected From Resistance.
Safe Entry Green Zone.
Target after that 162$ price level.
Note: 1- Potentional of Strong Buying Zone:
We have two scenarios must happen at The Mentioned Zone:
Scenarios One: strong buying volume with reversal Candle.
Scenarios Two: Fake Break-Out of The Buying Zone.
Both indicate buyers stepping in strongly. NEVER Join in unless one showed up.
2- How to Buy Stock (safe way):
On 1H TF when Marubozu/Doji Candle show up which indicate strong buyers stepping-in.
Buy on 0.5 Fibo Level of the Marubozu/Doji Candle, because price will always and always re-test the
Take Care & Watch OUT !
How expensive is Nvidia today?How expensive is NASDAQ:NVDA today?
❗ You're paying $40 today for $1 of next year's earnings
That's what Nvidia's forward P/E 40x means at current $172 per share
AI might be the future but you're prepaying for it like it's 2060 🤖

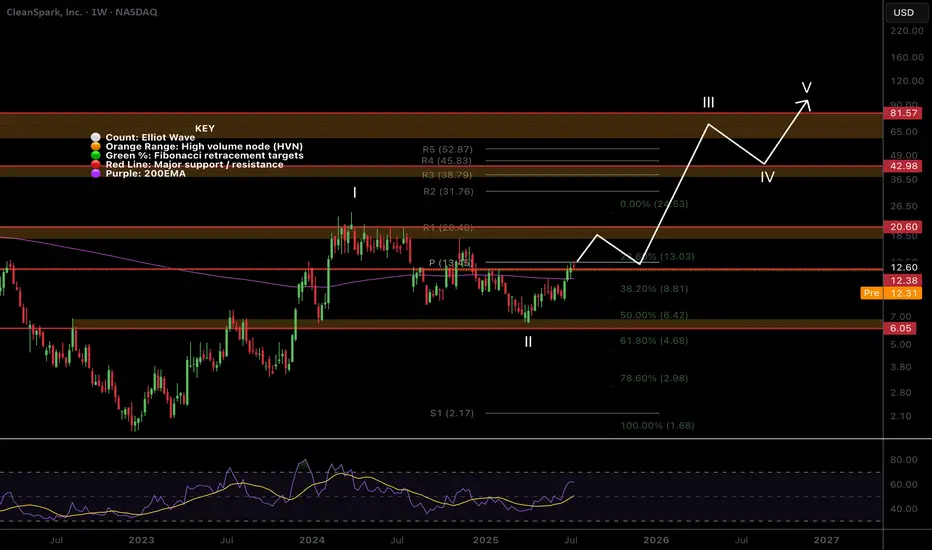
$CLSK Trapped between Critical Resistance and Support?NASDAQ:CLSK Shot through the weekly 200EMA and hit the weekly pivot resistance and was rejected into the High Volume Node (HVN) just below.
If the count is correct we should see price breakthrough in wave 3 after some consolidation and continue up after wave 2 tested the .618 Fibonacci retracement and HVN as support.
Heavy resistance HVN coupled with the R1 pivot at $20.40 will prove another challenge to overcome. Ultimately, if the count is correct AND Bitcoin doesn't tank we can expect a challenge of the all time highs up at $60.
I already closed partial take profit myself at the weekly pivot on a recent trade and will be looking to go long again to the those targets. Make sure to always be taking profits on the way as nobody has a Crystal ball!
RSI is currently printing a bearish divergence on the weekly so we need to see that negated.
Analysis is invalidated below $6.
Safe trading
YEXT 1W - breakout confirmed, retest inside bullish channelYext stock just pulled a clean breakout of the weekly downtrend line, retested the buy zone around the 0.5 Fibo level ($7.32), and is now bouncing within a rising channel. The 200MA and 50EMA are both below price, supporting a shift in trend even though the golden cross hasn’t formed yet. The volume increased on breakout, and there's low overhead supply - a classic setup for continuation. The arrow shows the expected move, contingent on confirmation.
Targets: 9.15 - 11.40 - 15.06
Fundamentally, Yext offers enterprise-grade AI-powered search solutions and recently gained attention with new product updates. With AI adoption accelerating, the company may ride the next wave of institutional interest.
When price retests the zone, MA is supportive, and there's no overhead resistance - that’s not noise, that’s a signal.

TSLA - Explosive Bounce TSLA Before the Drop? | EW Analysis My primary view is that we’re in the final stages of an ending diagonal, which could lift the price to new all-time highs, potentially between $460 and $650. Wave 4 of this structure appears to have completed after precisely tagging key Fibonacci support, and since then, we've already seen a strong bounce from that low. I’m now watching for the development of the final wave in this pattern, which could deliver gains of over 100% from current levels.
However, I’m not fully convinced by the internal shape of the diagonal so far. That’s why I’m also have an alternative scenario: in this case, the recent low may have marked the end of Wave 2 within a much larger diagonal. If true, this opens the door to a much more extended rally potentially reaching $1,000 before we see a major correction.
That said, this second scenario is not my preferred one, and a decisive break below the recent lows would invalidate both counts.

Mapping Out a Probable Basing Structure for ContinuationI’m tracking price as it retraces into the 0.5–0.618 Fibonacci zone, where I expect a potential base to form. With declining volume confirming the pullback is losing momentum, I’ll look for a clear basing pattern or double-bottom on lower timeframes before entering long. If confirmed, the plan is to position for a continuation move back toward previous highs.

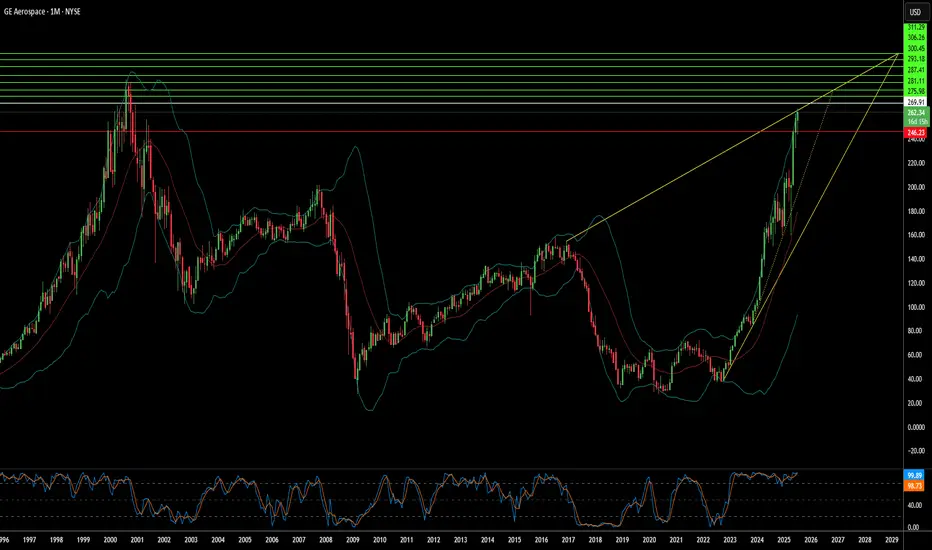
Soaring High: What Fuels GE Aerospace's Ascent?GE Aerospace's remarkable rise reflects a confluence of strategic maneuvers and favorable market dynamics. The company maintains a dominant position in the commercial and military aircraft engine markets, powering over 60% of the global narrowbody fleet through its CFM International joint venture and proprietary platforms. This market leadership, coupled with formidable barriers to entry and significant switching costs in the aircraft engine industry, secures a robust competitive advantage. Furthermore, a highly profitable aftermarket business, driven by long-term maintenance contracts and an expanding installed engine base, provides a resilient, recurring revenue stream. This lucrative segment buffers the company against cyclicality and ensures consistent earnings visibility.
Macroeconomic tailwinds also play a crucial role in GE Aerospace's sustained growth. Global air travel is steadily increasing, driving higher aircraft utilization rates. This directly translates to greater demand for new engines and, more importantly, consistent aftermarket servicing, which is a core profit driver for GE Aerospace. Management, under CEO Larry Culp, has also strategically navigated external challenges. They localized supply chains, secured alternate component sources, and optimized logistics costs. These actions proved critical in mitigating the impact of new tariff regimes and broader trade war tensions.
Geopolitical developments have significantly shaped GE Aerospace's trajectory. Notably, the U.S. government's decision to lift restrictions on exporting aircraft engines, including LEAP-1C and GE CF34 engines, to China's Commercial Aircraft Corporation of China (COMAC) reopened a vital market channel. This move, occurring amidst a complex U.S.-China trade environment, underscores the strategic importance of GE Aerospace's technology on the global stage. The company's robust financial performance further solidifies its position, with strong earnings beats, a healthy return on equity, and positive outlooks from a majority of Wall Street analysts. Institutional investors are actively increasing their stakes, signaling strong market confidence in GE Aerospace's continued growth potential.
$HIMS $58 mean reversion target on horizonNYSE:HIMS daily with bullish engulfing candle. $58 pt is for gap fill.

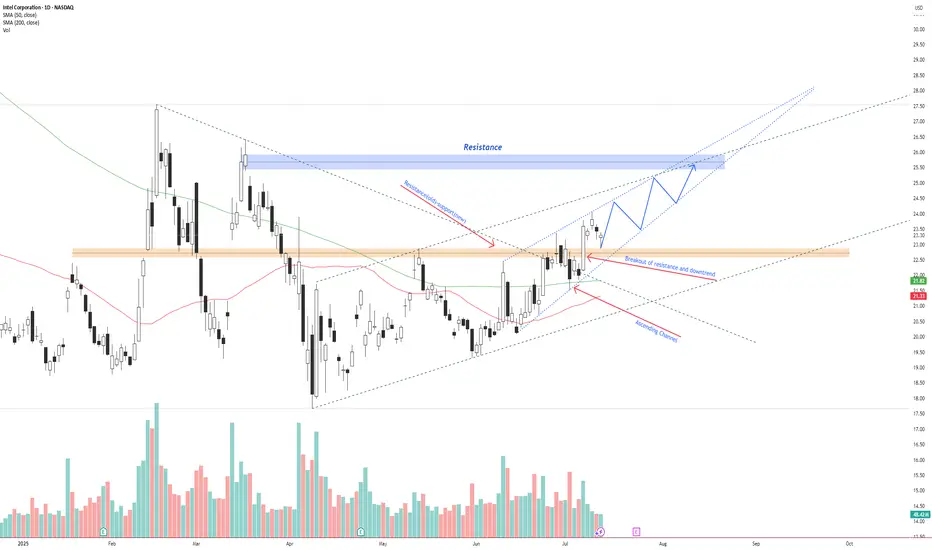
INTC – Breakout Confirmed, Bullish Continuation Inside AscendingIntel NASDAQ:INTC has broken above previous resistance and a descending trendline, confirming a bullish reversal.
Price is currently respecting an ascending channel and forming higher highs and higher lows. The breakout retest around $22.50 has held as new support.
If the current structure remains intact, price could continue toward the $26.00–$26.50 resistance zone. A breakout above this zone opens the door for a move toward $28+.
Key levels:
Support: $22.50 (previous resistance)
Resistance: $26.00–$26.50
Trend structure: Bullish channel
Volume supports the trend, and price is trading above both the 50 SMA and 200 SMA.
📌 Watching for a pullback and continuation move inside the channel.
This is not financial advice. Always do your own research.
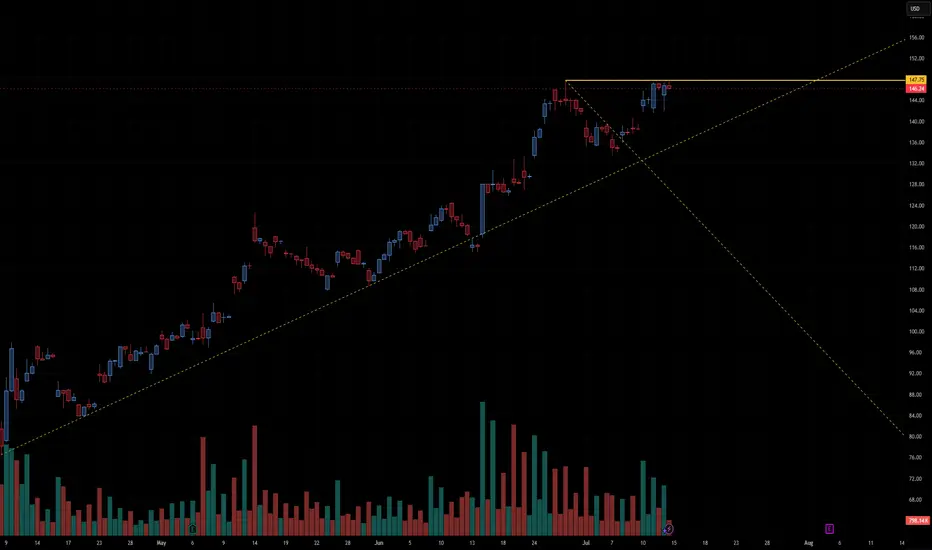
AMD preparing to break out or fail at resistance🔍 Chart Structure & Key Levels
Horizontal Resistance:
The stock is repeatedly testing the $147.75 level, which is acting as a horizontal resistance (shown in orange). Price has stalled here for several sessions, creating a tight range just below resistance—a common precursor to breakouts.
Ascending Trendline Support:
A long-term upward trendline (dashed yellow) supports the current move. Price has respected this line multiple times, showing a strong bullish structure over the past few months.
Volume Analysis:
Volume has decreased during the recent consolidation near the highs, which is typical before a breakout. However, we want to see a volume spike on a confirmed breakout above $147.75 to validate strength.
Symmetrical Triangle / Coil:
There's a tightening pattern forming between the rising trendline and the flat resistance, indicating price compression. This type of structure is often resolved with a large directional move.
✅ Bullish Scenario
A confirmed breakout above $147.75 with volume expansion could trigger a strong upward move.
Price could quickly target the psychological level near $150, and potentially beyond to $155+, based on the height of the prior impulse wave.
⚠️ Bearish Breakdown Scenario
If price fails to break above $147.75 and breaks the ascending trendline, a pullback to $140 or $135 becomes likely.
A breakdown would invalidate the current bullish structure and signal a potential short-term reversal.
🧠 Summary
This chart is in a bullish consolidation with a coiled setup just under major resistance. A breakout above $147.75 is the critical level to watch for upside continuation. Traders should monitor volume and candlestick confirmation before entering positions.
CCJ stead as she goes but triple top failure ahead?Cameco Corp. (CCJ) shows a strong uptrend with a consolidation just below resistance, which is a bullish technical pattern. Let’s break it down:
🔍 Technical Analysis of CCJ
1. Trend Structure
Clear uptrend: The stock has been making a series of higher highs and higher lows since March.
Ascending trendline (yellow dashed line): Price continues to respect this trendline as dynamic support, indicating sustained buying momentum.
2. Resistance Zone
Horizontal resistance at ~$75.42: This level has been tested multiple times but not yet convincingly broken.
The recent candles are testing this level again, showing pressure building. This increases the probability of a breakout.
3. Support Zone
Horizontal support at ~$67.87: This was the breakout level from a prior consolidation in early June and has acted as support since then.
Also aligns with the ascending trendline, forming a rising base—a sign of strength.
4. Volume Analysis
Volume has been picking up slightly during the current approach to resistance, but a significant spike in volume on a breakout would add strong confirmation.
Notably, there was strong volume during previous rallies—momentum buyers may be waiting for a confirmed breakout before re-entering.
✅ Bullish Scenario
A daily close above $75.42, ideally on above-average volume, could trigger a breakout with a target toward $80–82 in the near term.
The steep angle of the ascending trendline supports a continued rally if broader market conditions are favorable.
⚠️ Bearish/Neutral Scenario
If price fails to break above $75.42 and drops below the ascending trendline, look for a retest of the $67.87 level.
A break below that support could open the door for a deeper pullback toward the mid $60s.
🧠 Summary
CCJ is in a bullish consolidation pattern with strong support from a rising trendline and a flat-top resistance at ~$75.42. The setup resembles a classic ascending triangle, a continuation pattern that often resolves with a breakout in the direction of the prevailing trend (up).
Watch closely for:
A breakout candle above $75.42 with strong volume
Potential pullbacks toward the trendline for entries if breakout fails temporarily

PALANTIR REMAINS YOUR TRADING GOAL, DOUBLING IN PRICE IN 2025In the Faraway Kingdom... In the Thirtieth Realm....
Somewhere in another Galaxy.. in late December, 2024 (yet before The Second Coming of Trump), @TradingView asked at it awesome Giveaway: Happy Holidays & Merry Christmas .
1️⃣ What was your best trade this year?
2️⃣ What is your trading goal for 2025?
Here's what we answered:
1️⃣ What was your best trade this year?
- Surely Palantir NASDAQ:PLTR 💖
I followed Palantir all the year since January, 2024, from $16 per share, watch here .
Current result is 5X, to $80 per share.
Also I added more Palantir after SP500 Index inclusion in September 2024 watch here .
Current result is 2.6X, from $30 to $80 per share.
2️⃣ What is your trading goal for 2025?
- Once again, surely Palantir NASDAQ:PLTR 💖
It's gone 7 months or so... (Wow... 7 months really? 😸😸😸)
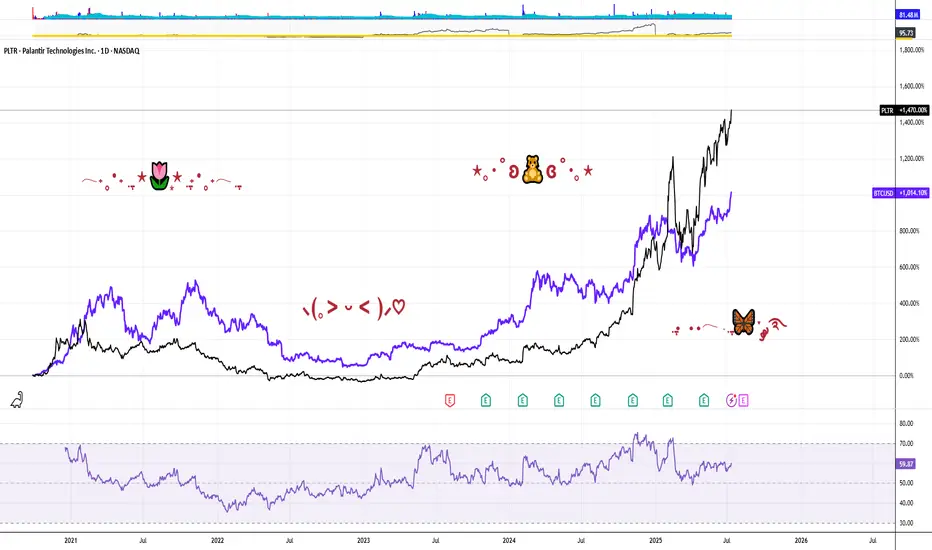
Let see what's happened next at the main graph of Palantir stock, to LEARN WHY PALANTIR REMAINS THE TRADING GOAL, DOUBLING IN PRICE IN 2025...
Palantir stock remains an attractive trading goal for several compelling reasons rooted in its strong market performance, innovative technology, and robust growth prospects, particularly in the artificial intelligence (AI) sector.
1. Exceptional Stock Performance and Momentum.
Palantir Technologies has been one of the best-performing stocks in 2025, surging over 80% in the first half of the year alone, vastly outperforming the S&P 500’s modest 5.5% gain. The stock recently hit all-time highs around $149, reflecting a nearly 400% increase year-over-year, underscoring its strong momentum and investor enthusiasm. This surge positions Palantir as a top AI stock to watch, attracting both retail and institutional investors, including conservative entities like the Czech National Bank.
2. Leadership in AI and Data Analytics.
Palantir is not just a data analytics company; it has transformed into a major AI software provider with its Artificial Intelligence Platform (AIP). This platform extends beyond government contracts into commercial sectors such as healthcare, energy, and automotive, fueling significant revenue growth. The company reported a 39% revenue increase to $883.9 million in Q1 2025, driven largely by AI adoption. Its AI platform is gaining traction globally, with many companies rapidly adopting Palantir’s software through short training bootcamps, demonstrating scalable and fast integration.
3. Strong Government and Commercial Contracts.
Palantir’s roots in government intelligence and defense continue to be a significant revenue driver. The U.S. government division alone generated $373 million in Q1 2025, with overall government revenue up 45% year-over-year. Strategic partnerships, such as with Accenture to streamline federal operations and projects like the U.S. Navy’s ‘Warp Speed for Warships,’ highlight Palantir’s expanding footprint in critical government sectors. Simultaneously, the commercial segment is booming, with revenue soaring 71% to $255 million in Q1 and projected to reach $1.178 billion in 2025.
4. Financial Health and Growth Outlook.
Palantir’s financials are strengthening, with no debt and adjusted free cash flow more than doubling to $370.4 million in the recent quarter. Analysts forecast the company’s revenue to exceed $3.5 billion in 2025, up from $2.23 billion the previous year, and project potential revenue of $7 billion by 2028. Operating margins are improving, with a recent quarter reporting a 26% margin, the highest in company history. This solid financial foundation supports further investment in AI innovation and market expansion.
5. Market Position and Competitive Edge.
While Palantir competes with tech giants like Microsoft, Amazon, and Google in the AI and data analytics space, it has carved out a unique niche with its specialized government contracts and AI-driven software solutions. Its ability to integrate complex datasets for real-world operational use distinguishes it from competitors, fostering a loyal investor base and a "cult-like" following among retail investors.
6. High Valuation Reflects Growth Expectations.
Despite a high price-to-earnings ratio (PE around 621), reflecting elevated expectations, many analysts remain optimistic about Palantir’s long-term potential due to its rapid growth and expanding AI capabilities. The company’s market capitalization has soared above $330 billion, surpassing many established corporations, signaling strong market confidence.
7. Palantir stock is a compelling trading goal because it combines robust growth, cutting-edge AI technology, strong government and commercial contracts, and solid financial health.
8. In conclusion, Palantir remarkable stock performance and strategic positioning in the booming AI sector make it a promising investment for traders seeking exposure to transformative technology with significant upside potential.
9. ...and yet, Palantir performance since inception (It ultimately went public on the New York Stock Exchange through a direct public offering on September 30, 2020) is better, rather then Bitcoin.
--
Best wishes,
@PandorraResearch Team 😎
KULR Daily Watch – Triangle Squeeze Loading📍 Price Action:
Sitting tight at $6.50, coiling inside a clean symmetrical triangle. Last fake-out under support didn’t confirm → bulls still holding the line.
📊 Pattern Probabilities (Bulkowski):
Symmetrical triangles break ~54–60% in trend direction. Post-breakout moves hit ~60–75% of measured height → decent odds for upside here.
✅ Volume contracting = typical pre-breakout behavior
✅ RSI divergence still bullish
✅ Channel since 2023 intact, macro structure supports trend-following
🎯 Targets & RR Setup:
Trigger zone: $7.20–$7.50
Target 1: $9.45 (+31% | RR ~2.5:1)
Target 2: $28.81 (+298% | RR ~12:1)
Target 3 (channel top): $168.12 (+2,368% | moonshot 🌙)
⏳ Next Step:
Break over $7.50 = green light for Target 1. We’re trailing stops below the rising trendline to lock in gains without killing the move early.
#KULR #TrianglePattern #BreakoutWatch #TargetTraders #StockMarket

MP eyes on $49.43: Golden Genesis fib stopped the news spikeMP is now partially owned by the DOD, which spiked the price.
That massive move smacked into the Golden Genesis at $49.43
Look for a Break-n-Retest for idea long, or Dip-to-Fib below.
