GLXY Bull flag....ready to goIt looks like GLXY is ready to pop.It looks like a bull flag on weekly time frame, ready to go,short term target $32-34 longer-term new all time high 😀

$PUKPF Long - A British entityPrudential Financial is looking good. I like the technicals and earnings seem ok.
I like the LONG here.
I don't have any yet.
Cheers.

Insiders are selling Roblox ! Heres the levels you need to knowIn this video I lay out a solid plan for a move to the downside for Roblox after a 100% move to the upside since April of this year .
I demonstrate why I believe we will take a 30% retracement and provide confluent evidence to support this theory.
There are some fundamental reasons that I also did include alongside the technical analysis which is not my regular style but important given the context.
Tools used in the video 0.382 Fib , Standard Fib pull, Trend based fib and pivots .

APPLE: Short Trade with Entry/SL/TP
APPLE
- Classic bearish formation
- Our team expects pullback
SUGGESTED TRADE:
Swing Trade
Short APPLE
Entry - 213.58
Sl - 217.99
Tp - 204.49
Our Risk - 1%
Start protection of your profits from lower levels
Disclosure: I am part of Trade Nation's Influencer program and receive a monthly fee for using their TradingView charts in my analysis.
❤️ Please, support our work with like & comment! ❤️

Retest?Price is hovering below the 50 EMA now.
The candle that broke away from the consolidaton and fell under the 50 EMA, had alot of momentum and volume. But the most recent candle tried to reclaim the 50 EMA but fail by it's long upper shadow. The question is was the most recent candle a classical retest candle before the bears proceed to march on. Bulls need to maintain the 12.54 price or risk losing to the Bears.

TESLA: Bulls Will Push
The price of TESLA will most likely increase soon enough, due to the demand beginning to exceed supply which we can see by looking at the chart of the pair.
Disclosure: I am part of Trade Nation's Influencer program and receive a monthly fee for using their TradingView charts in my analysis.
❤️ Please, support our work with like & comment! ❤️

FiservInsiders have sold $239 Million shares on MAY 29TH. We expect price to rally from these lows to visit the 50% Fib levels. This is a contrarian play as 4,024 Puts are in play which means more Bears are betting on a drop. This means a lot of Stop Loss orders are prime above the $170 level. This will be a Fade the market play.

LAES - Another Quantum Stock - What to expectHello Everyone,
Hope you all have a good Weekend. This analyze was asked by @Lukylexx and i tried to make some drawing on it.
Before the technical details , here is some basic Info about SEALSQ
Company Overview:
What they do: SEALSQ is a Swiss‐based semiconductor and security solutions company, part of WISeKey. They design and produce secure microcontrollers, integrate post‐quantum cryptography (PQC), and offer full-stack provisioning, PKI (Public Key Infrastructure) and certification services for IoT and other connected devices .
Innovation & quantum focus: SEALSQ operates a quantum lab and is releasing quantum-resistant microcontrollers (like QS7001), TPM chips with PQC features (QVault), and engaging in projects like Quantix Edge for post-quantum security .
Revenue (H1 2025) : USD 4.8 million, flat vs H1 2024, representing steady progression as PQC transition continues .
Cash reserves: USD 120 million as of June 30, 2025, up sharply from USD 19 million a year earlier—providing strong runway for R&D and expansion .
Market cap & financial metrics: ~USD 455 million market cap, P/E ratio –6.6 (reflecting net losses) .
Growth acceleration underway, shifting from legacy products to quantum-resistant chips—with revenue forecast of USD 16–20 m in 2025, then doubling or more in 2026.
Robust future pipeline (~USD 145 m) bolstered by IC’ALPS acquisition and emerging PQC projects.
Technical Part:
I expect 2 options which i marked as 1 (green) and 2 (orange) in graphs.
If they break the 4.50 and stay above this level for 3 days or more then target price is 6.00 which is approx %50 above from todays price level.
What can it do. Break 4.50 then go up and restest 4.50 - So this restest point could be a good and safe entry point for me.
If you would like to take a risk then you can jump in next week . Long Term i beleive it is a good one to buy and hold.
As loong as it does not break the Yellow trend line (Support levels), trend is up.
Second option is hit the Trend lines and go up. If try this way then 3.20 - 3.30 levels could be a other good entry points and you can try to get in that levels. But remember Yellow Trend line ;) .
Lets see what will it do .
My long term expectetion in One year maybe less it can be reach the 7.00 price Level.
If you like to take a risk and make a quick wins or are Long Term investors, SEALSQ could be right choise.
This is just my thinking and it is not invesment suggestion , please do not make any decision with my anaylsis.
Have a lovely Weekend to all.

Riding the Wave: Breakout Trading with Elliott Wave AnalysisHello Friends,
Welcome to RK_Chaarts,
Today we're going Analyze the chart of " HASBRO. " to identify a trend change opportunity.(Educational Post).
Let's get started!
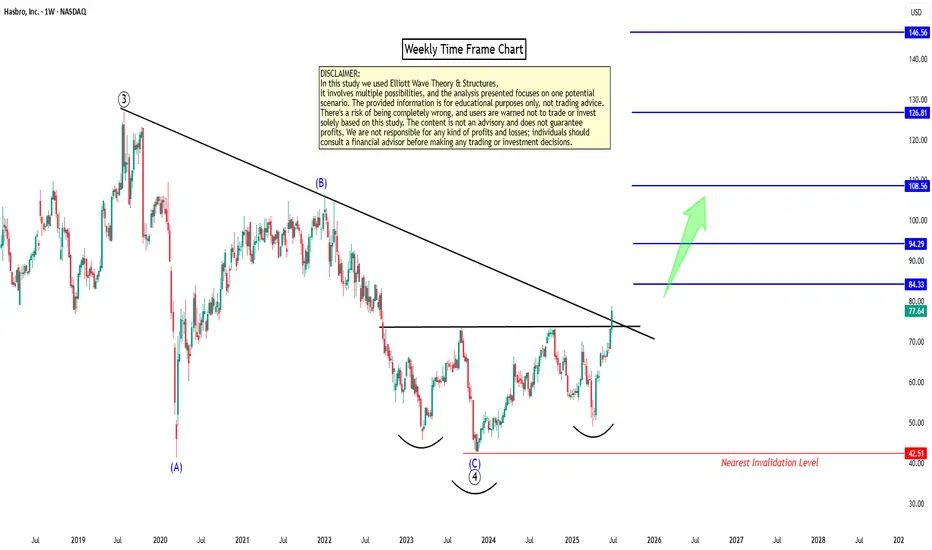
Today, we analyzed the weekly chart of "HASBRO" using Elliott Waves theory and chart patterns. We clearly observed that the July 2019 top, with a high of 126.87, completed a primary degree Wave ((3)) in Black. The recent bottom in November 2023, around 42.69, marked the end of primary degree Wave ((4)) in Black. Since then, the price has formed a higher high and low, indicating a potential reversal.
The recent weekly candle close has broken out of the Resistance trendline and also confirmed an inverted head and shoulders breakout along with good breakout in RSI on weekly-cum-monthly time frames. This suggests that we may be unfolding a primary degree Wave ((5)) in Black, which should consist of five sub-divisions of Intermidiete degree in Blue. Based on the chart, it appears that Intermidiete degree Waves (1) and (2) in Blue are complete, and Wave (3) may have started.
Resistance Trendline Breakout with Inverted Head n Shoulder Breakout
RSI Breakout on Weekly
RSI Breakout on Monthly
Major EMAs Support on Daily, Weekly & Monthly
Both Elliott Wave theory, EMAs support, Trendline Breakout and chart pattern Breakout indicates that the price is likely to move higher from here. However, please note that technical analysis is a game of probabilities, and there's always a chance of being wrong.
To mitigate this risk, we've marked an invalidation level around 42.69. If this level is breached, our analysis would be invalidated.
Projecting the target for Wave ((5)) using the 123.6% of Wave ((4)) measurement, we get a long-term target of around 146.56. This is a possible target, but please keep in mind that this is an educational study and not a trading tip or advice.
Before making any trading decisions, please conduct your own analysis or consult with a technical expert or financial consultant.
I am not Sebi registered analyst.
My studies are for educational purpose only.
Please Consult your financial advisor before trading or investing.
I am not responsible for any kinds of your profits and your losses.
Most investors treat trading as a hobby because they have a full-time job doing something else.
However, If you treat trading like a business, it will pay you like a business.
If you treat like a hobby, hobbies don't pay, they cost you...!
Hope this post is helpful to community
Thanks
RK💕
Disclaimer and Risk Warning.
The analysis and discussion provided on in.tradingview.com is intended for educational purposes only and should not be relied upon for trading decisions. RK_Chaarts is not an investment adviser and the information provided here should not be taken as professional investment advice. Before buying or selling any investments, securities, or precious metals, it is recommended that you conduct your own due diligence. RK_Chaarts does not share in your profits and will not take responsibility for any losses you may incur. So Please Consult your financial advisor before trading or investing.
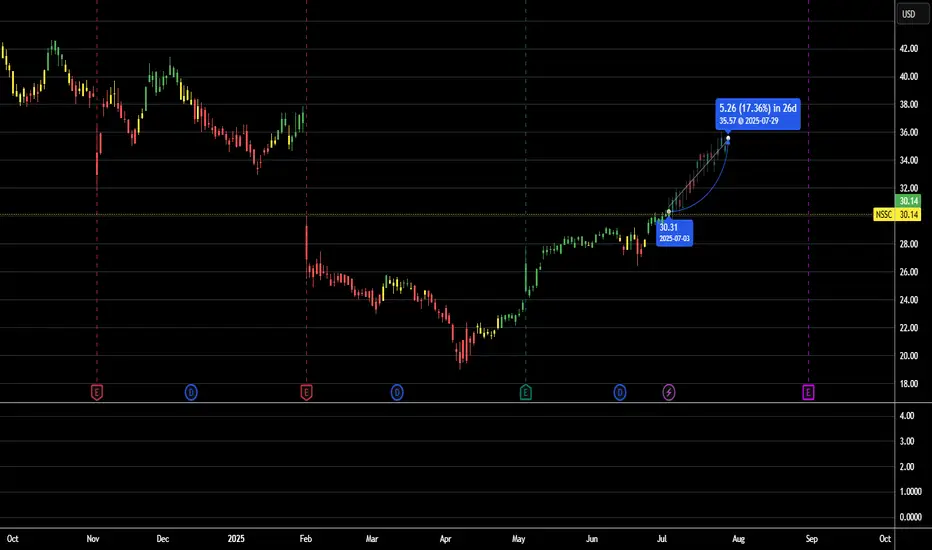
Trade Plan (Short-Term Swing) for $NSSC🔍 Chart Setup & Trend
Timeframe: Daily chart
Trend: NASDAQ:NSSC has recently rebounded from support around $28 and is attempting a short-term recovery after a corrective phase.
The price is back above the 20-day EMA, signaling renewed buying interest.
A move above $31.00–$31.50 resistance could trigger a bullish breakout.
📊 Key Technical Indicators
RSI: ~54
↳ Neutral zone, with room to move toward overbought territory.
MACD: Bullish crossover is forming
↳ Indicates upside momentum building.
Volume: Increasing volume on green days—suggests accumulation phase.
🔧 Support & Resistance
Support: $28.50 (recent bounce zone)
Resistance 1: $31.00 (near-term ceiling)
Resistance 2: $33.50
17% Price Target: $35.26
🎯 Trade Plan (Short-Term Swing)
Entry: $30.14 (or breakout confirmation above $31.00)
Target (17% gain): $35.26
Stop-loss: $28.40 (below recent swing low and EMA support)
Risk/Reward Ratio: ~1:2.2
📈 Example Calculation
Entry: $30.14
Target: $35.26
Stop-loss: $28.40
Potential Gain: $5.12
Potential Loss: $1.74
⚠️ Risks
If $31.00 fails to break, the stock could range or retest lower support.
Broader tech/security sector weakness could drag NASDAQ:NSSC even if setup looks bullish.
Keep an eye on earnings dates or macroeconomic risk (interest rates, spending cuts, etc.).
✅ Summary
Napco Security Technologies ( NASDAQ:NSSC ) shows early signs of a trend reversal. With momentum building above key short-term moving averages, a 17% move to $35.26 is feasible if the stock breaks through $31 with strength.
Entry: ~$30.14
Target: $35.26
Stop-loss: ~$28.40
Outlook: Cautiously Bullish, confirmation above $31 preferred.
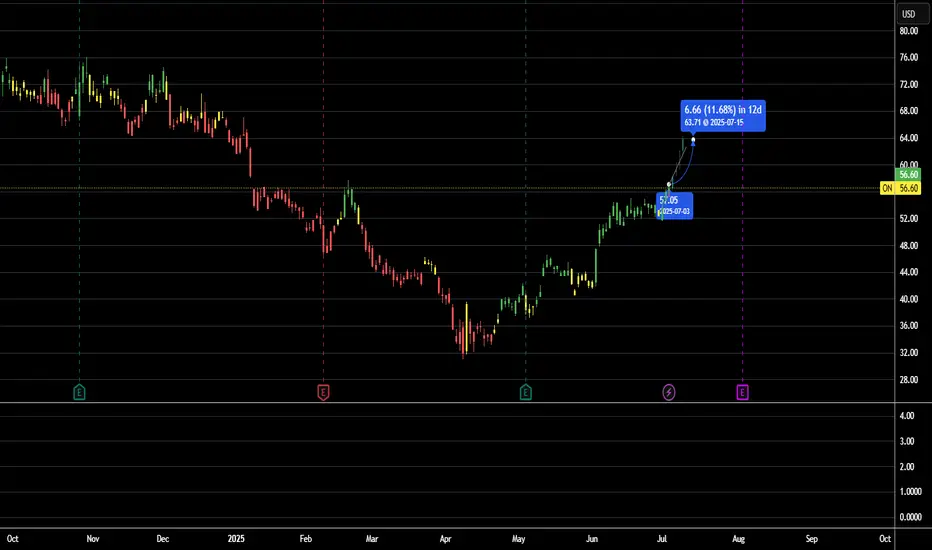
Trade Plan (Short-Term Swing) for $ON🔍 Chart Setup & Trend
Timeframe: Daily chart
Trend: After a prolonged downtrend, NASDAQ:ON appears to be forming a base and attempting a short-term reversal.
It is testing resistance around $57, and a breakout could trigger bullish continuation.
Price is approaching the 50-day EMA, which is a key level to watch for confirmation.
📊 Key Indicators
RSI: ~52
↳ Neutral, but trending upward. Room to grow before hitting overbought levels.
MACD: Bullish crossover just occurred
↳ Momentum is shifting in favor of the bulls.
Volume: Modest uptick on green days—sign of early accumulation.
🔧 Support & Resistance
Immediate support: $54.80 (recent swing low)
Resistance 1: $57.00 (current test level)
Resistance 2: $60.00
12% Target Price: $63.40
🎯 Trade Plan (Short-Term Swing)
Entry Zone: $56.60–$57.10 (on confirmed breakout)
Price Target (12% gain): $63.40
Stop-loss: $53.90 (below recent low and EMA20)
Risk/Reward Ratio: ~1:2 or better depending on entry
Key Level and QuestionsWe have strong momentum RSI 68.81 at a key level 18.55 . Will the bulls push through the key level at 18.55 and march to next key level at 23.30 price area or will bears take price down to the 16.00 down price level?

NVIDIA (NVDA) 4H Setup – Rocket Booster Strategy Building🚀 NVIDIA (NVDA) 4H Setup – Rocket Booster Strategy Building Momentum After Gap-Up and Volume Spike 📈
NVIDIA (NVDA) is showing early signs of another bullish
continuation on the 4-hour chart, echoing a similar pattern seen recently on Microsoft. This setup fits well within the Rocket
Booster Strategy framework — a method focused on catching strong trend acceleration signals backed by confluence.
Here’s what’s happening on NVDA’s chart:
1. High Volume on the 4H Candle
There’s been a strong increase in volume on a bullish 4H candle, indicating significant interest at current levels. This suggests
accumulation or breakout positioning, typically a good sign ahead of momentum bursts.
2. Stochastic RSI Between 50 and 20
While the Stochastic RSI hasn’t bounced from the oversold zone yet, it’s hovering between 50 and 20 — a zone that often acts as a
launching point for continued upward momentum. This shows that buyers are gradually regaining control without being overextended.
3. Price Above the 50 EMA and 200 EMA
NVDA is currently trading well above both the 50 EMA and 200 EMA on the 4-hour chart. This bullish structure confirms a strong
underlying uptrend, and it gives added confidence to long positions.
4. Bullish Gap-Up
A gap-up occurred recently, further confirming buying pressure. Gaps during trending conditions often signal the start of a new
impulsive wave, especially when backed by rising volume and clean trend structure.
Strategy Context
This is a textbook setup for the Rocket Booster Strategy, though the Stochastic RSI is not fully reset. Instead, it’s showing a more
gradual buildup of strength — which can be an early entry signal before larger players pile in.
Entry: On 4H candle continuation or brief intraday retracement
Stop Loss: Below the gap or recent support
Target: Previous swing highs or Fibonacci-based extensions
Final Thoughts
NVIDIA is showing strong signs of bullish continuation, and this could be the early stage of a new momentum phase. The
Stochastic RSI position adds a slightly different flavor to the setup
— more of a buildup than a reversal — but the overall structure remains solid. As always, risk management is key.
Let me know in the comments if you’re watching NVDA too or already in the trade. More setups like this coming soon.
🔥 Rocket Booster Strategy: Engaged for NVDA?
Disclaimer:
This analysis is for educational and informational purposes only. It does not constitute financial advice or a recommendation to buy or sell any security.
Always do your own research and consult a licensed financial advisor before making any trading decisions. Trade at your own risk.

Microsoft (MSFT) 4H Buy Signal – Rocket Booster Strategy🚀 Microsoft (MSFT) 4H Buy Signal – Rocket Booster Strategy Activates on Gap-Up, Volume Spike, and Stoch RSI Reversal 📈
-
Microsoft (MSFT) has just triggered a compelling buy signal on the 4-hour chart, with multiple layers of confluence aligning to
-
support a bullish continuation. This setup fits perfectly into what I call the Rocket Booster Strategy — a system built to catch strong
-
upside moves right before they ignite.
-
Here’s what’s happening on the chart:
-
1. High Volume on the 4H Entry Candle
We’re seeing an above-average volume spike on the recent bullish 4H candle,
-
which tells me there’s strong participation behind the move — possibly institutional activity. High volume at key price levels
-
often acts as the first stage of a breakout acceleration.
-
2. Stochastic RSI Reversal from Oversold
-
The Stochastic RSI has curled back up from below the 20 line, printing a clear buy signal.
-
This reversal suggests that upward momentum is returning just as price confirms strength — a powerful combination.
-
3. Price Trading Above Both the 50 EMA and 200 EMA
-
MSFT is now well above the 50 EMA and 200 EMA on the 4-hour chart.
-
This alignment confirms a strong underlying trend. When price is supported by both short- and long-term moving averages,
-
it's a green light for trend-following strategies.
-
4. Bullish Gap-Up
-
The session began with a bullish gap-up, which acts like a "booster rocket" for momentum.
-
Gaps on tech stocks like Microsoft often attract short squeezes and breakout buyers
-
— this one could be the start of a new leg higher.
Strategy Context: Why This Setup Matters
-
The Rocket Booster Strategy works best when these four elements align:
-
Volume spike
Momentum reversal
EMA trend structure
Gap-up catalyst
-
With Microsoft showing all four in perfect sync, this becomes a high-probability continuation entry.
-
Trade Idea (Not Financial Advice)
-
Entry: Current 4H candle close or next retracement
Stop Loss: Just below the gap or the 50 EMA
Target: Previous swing high and extended target based on Fibonacci expansion
-
Final Thoughts
-
Microsoft rarely gives such clean setups, and when it does, it pays to watch closely. If momentum continues, this could set the tone for the rest of the week.
-
Always manage risk — no rocket launches without backup systems.
-
Let me know if you’re trading this setup too or have your own spin on the strategy. Feedback and chart ideas welcome!
Rocket booster engaged for MSFT? 🔥
Rocket Boost This Content To Learn More
Disclaimer:
This analysis is for educational and informational purposes only. It does not constitute financial advice or a recommendation to buy or sell any security.
Always do your own research and consult a licensed financial advisor before making any trading decisions. Trade at your own risk.

META: Testing Alternative Interconnection TypeResearch Notes
Given expression like this:
Fractal Corridors can be used for horizontal perspective of the same pattern manifestation. Alternative frames of reference exposes how historic swings of various magnitude in some way wire the following price dynamics. www.tradingview.com helps to seek a matching commonality in angles of trends which gives a hint how structure evolves in multi-scale perspective.
I use both when it comes to working with complex waves and making interconnections through fibonacci ratios.
To define emerging wave's limits (probable amplitude), I'll test classic rule of Support/Resistance shift in fibs. (When resistance becomes support or vice versa)
By theory it means a trendline can also shift like that.
In our case this can be applied as:
Fibocnacci Structure:

WMT : Potential Diamond Top BreakoutDiamond top pattern identified with potential breakout above $98.90 and downside support at the 9 & 20 ema of 97.47 and 97.09. Anticipated rate cuts and seasonal rotation may drive this above the breakout threshold.
