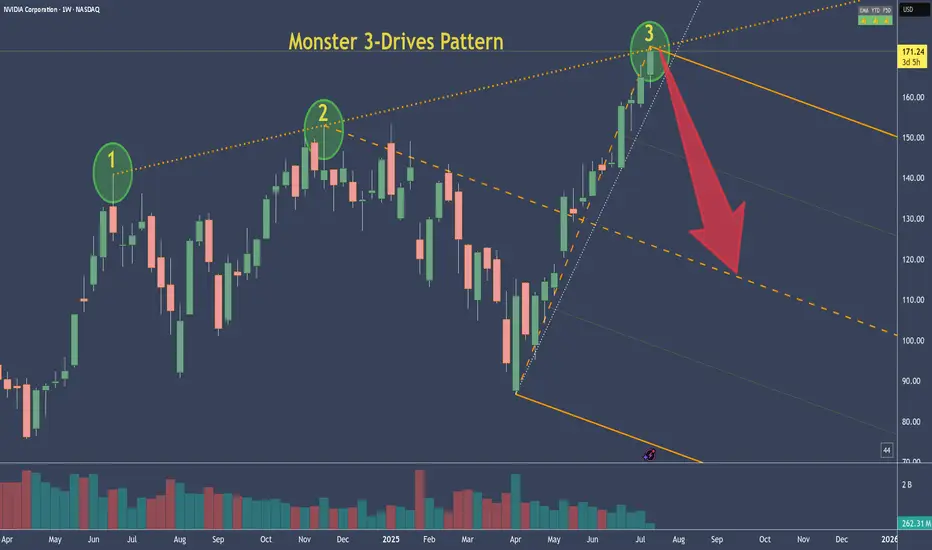
NVDA - NVIDIA's 3-Drive Pattern target if it plays outThis is the weekly chart of NVDA.
We can clearly see a 3-Drives pattern forming.
If this pattern plays out, the centerline would be my target. Of course, it's still too early to short.
But I’ve got my hunting hat on and I'm watching for signals on the daily chart.
One would be a break of the slanted trendline—but there are a couple of other conditions that need to align as well.
Always ask yourself: What if?
Piercing Candle?Do we have a Piercing candle around the golden zone 0.5 Fibonacci level 6.19$, also this candlestick pattern is resting at the moment on top of the 21 EMA? Will the bulls continue the march? is the pull back over? We need to close a bullish candle above the halfway candle of today's candle this week for the bulls to keep the 21 EMA and march on to victory.

OPEN Long to 10.69Down ~98% from 2021 highs, changes to the business model, VC money is all sold (likely), and a chart to die for. I like it to IPO price, should tap within 18 months.

DELL eyes on $116.10: Golden Genesis fib will determine TrendDELL has been a sleepy stock with mixed earnings.
Now testing a proven Golden Genesis at $116.01
Look for a Break-and-Retest to start an Uptrend.
.
See "Related Publications" for other plots ---------------------->>>>>>>
This one in particular is caught the BOTTOM exaclty:
===================================================
.

Cup and handle formation. The handle is currently being completeCup and handle formation. The handle is currently being completed.
The support level is at 1.60

KURA Set for Liftoff: Breakthrough Cancer Drug, Massive Analyst Kura Oncology (KURA) is emerging from a prolonged downtrend just as its lead drug candidate, ziftomenib, approaches a critical FDA decision deadline this fall. With zeroed-in focus on targeted leukemia treatments and no approved competitors in its niche, Kura is positioned to benefit from increasing demand for precision oncology therapies and growing biotech investment.
Wall Street analysts remain highly optimistic, projecting more than 300% upside based on Kura’s strong cash position, late-stage pipeline, and potential blockbuster market for its lead asset. In a healthcare landscape where next-generation cancer treatments are both a clinical and economic priority, Kura’s story stands out as a high-reward opportunity for long-term investors.
Don’t miss our next big setup—hit follow now!

Dell, bullish, ascending triangleNYSE:DELL looks ready to go
4 weeks of tight price action with higher lows
AI infra has been hot and dell is a key player
nuff said

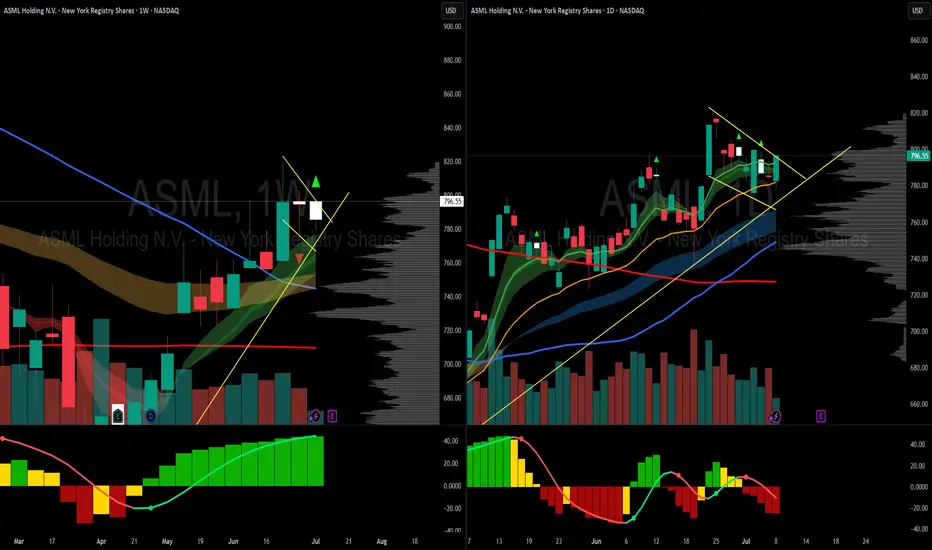
ASML looks readyNASDAQ:ASML looks ready to go with a bull flag and a double inside week, semis are strong as a sector and it is a monopoly business... pretty good long term hold also
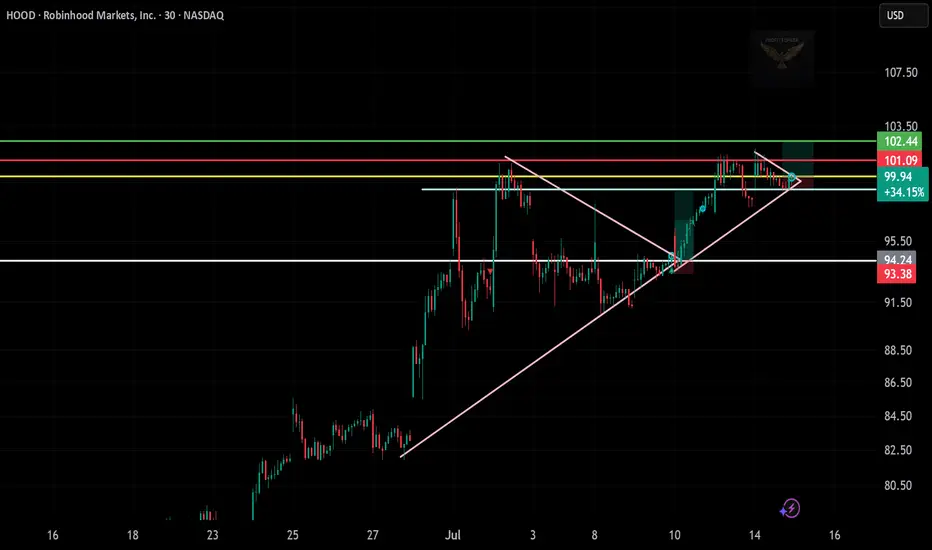
HOOD Breakout Watch – Eyeing $103+
🧠 Chart Breakdown:
Setup: Price broke out of a large ascending triangle and is now forming a mini symmetrical triangle — a consolidation before a possible continuation.
Current Price: $99.94
Breakout Zone: Near $100, close to decision point.
📊 Key Levels:
Immediate Resistance:
$101.09 (yellow)
$102.44 (first green target)
$103.50 (final target zone)
Support Levels:
$94.74 (white line)
$93.38 (stop-loss zone)
🎯 Trade Idea (Bullish Bias):
Entry: $100.00
Target 1: $102.44
Target 2: $103.50
Stop-Loss: Below $94.74
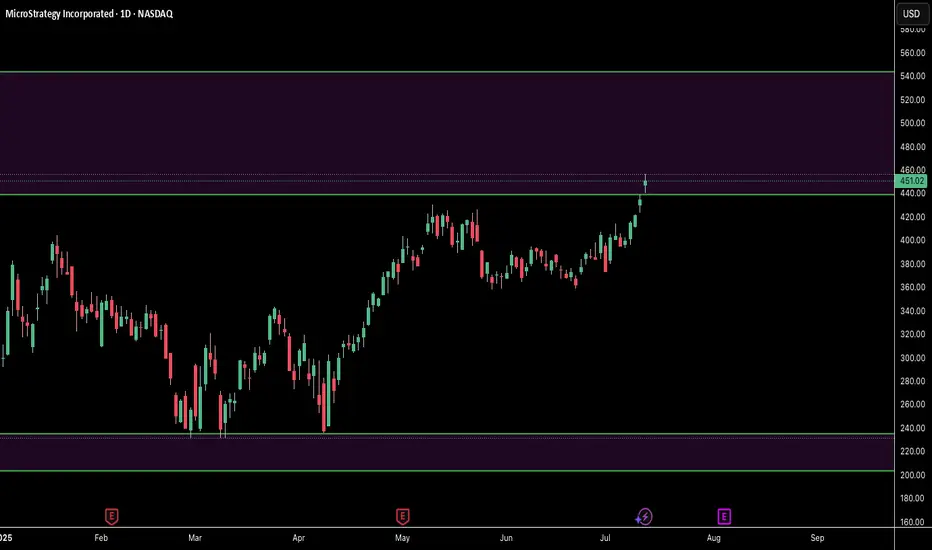
MicroStrategy Bitcoin FOMOIs it time to sell? In percentage terms, MicroStrategy has significantly outperformed its underlying asset, Bitcoin. It's concerning to watch Michael Saylor's FOMO (fear of missing out) into Bitcoin over the past year, as this could ultimately do more harm than good for Bitcoin. MicroStrategy's stock seems massively overvalued compared to its Bitcoin holdings. As the saying goes, "when the tide goes out, we see who is swimming naked."
Over the same period Bitcoin has gained 674%, while MicroStrategy has gained 2831%, making the situation quite clear. When comparing past bull runs, the percentage gains between Bitcoin and MicroStrategy have typically matched more closely, with both assets trending up together. So, what's different this time? Media exposure and FOMO.
Proceed with caution; this is starting to look like a bubble. Is it time to short?

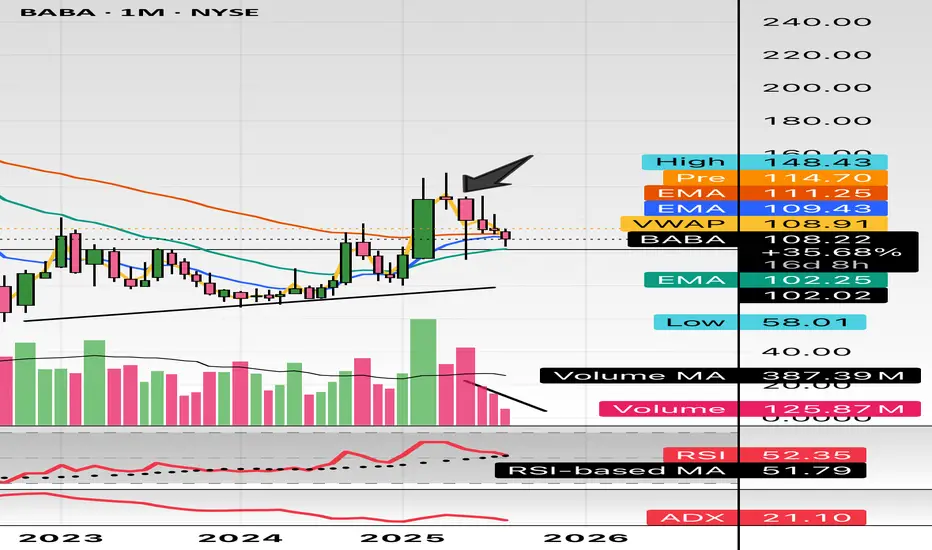
$BABA don’t miss this milky bottle. Called this out at $105 in minds. This Monthly declining volume, support at $100, and uptrend pattern. China will boom into the end of Q3 and early 2026. Target is $180 and $200.
WSL.
$HUT Clear for Further Upside?NASDAQ:HUT is having a great time clearing resistances, the weekly 200EMA and the weekly Pivot point did not prove challenging.
It is currently sitting in a High Volume Node (HVN) where price is likely to reject and retest the weekly pivot as support before continuing upwards towards $32 and beyond in wave 3.
Wave 2 tested the 'alt-coin' golden pocket between 0.618-0.782 Fibonacci retracement giving me confidence in the count.
Safe trading

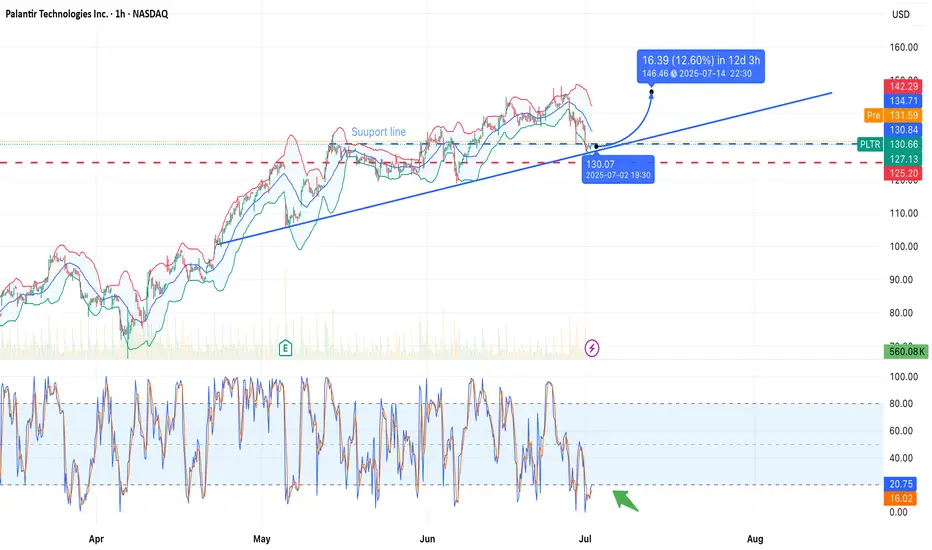
Palantir Technologies (PLTR) — Bounce in Progress?NASDAQ:PLTR is testing a long-term ascending trendline near the $128.79 level, which also aligns with a horizontal support zone. A potential rebound is forming with a projected move toward $145.94 — a +13.32% gain in 12 days.
Technical Highlights:
• Support zone: $128.79 (trendline touch + horizontal level).
• Stochastic Oscillator: Deep in oversold territory — bullish crossover forming (green arrow).
• Bollinger Bands: Price pierced lower band — reversion to the mean is likely.
• Volume: Stable, with room for momentum pickup.
Targets:
• First resistance: $134.71
• Primary target: $145.94
• Stop level: below $127 (to invalidate bullish thesis)
Nvidia at a CrossroadsNvidia at a Crossroads: Unstoppable Growth, Geopolitical Tensions, and Fears of Talent Drain to China
Ion Jauregui – Analyst at ActivTrades
Nvidia’s rise as a central player in the artificial intelligence revolution has not been a solitary journey. The company, now valued at over $4 trillion, has built a complex network of suppliers, strategic clients, and industrial partners that fuel its growth. However, this success has also placed the firm under the scrutiny of U.S. authorities, especially amid growing fears of knowledge transfer to China.
Washington on Alert: National Security Risks?
The U.S. government has begun to closely monitor the hiring of foreign talent in strategic sectors. One of its main concerns is the potential unintentional transfer of advanced military knowledge to China through engineers working at companies like Nvidia. The company’s chips power everything from data centers to autonomous systems, and part of its strength lies in the know-how contributed by its employees—many of whom are of Asian descent—to the development of these key technologies.
Although the company benefits enormously from hiring highly skilled engineers—many of them trained in U.S. universities—there is concern in Capitol Hill and the Pentagon that some of these specialists, directly or indirectly, could end up collaborating with China’s People’s Liberation Army. The U.S. Department of Commerce and the Pentagon have increased scrutiny of technical staff with links to China, particularly after identifying several cases of dual-nationality engineers involved in sensitive projects. According to intelligence sources cited by outlets such as Bloomberg and The Washington Post, internal investigations have been launched to review hiring policies at key semiconductor companies. There is concern that without stricter measures, U.S. technological know-how—especially related to dual-use civilian-military GPUs—could leak and accelerate the development of Chinese military capabilities, including AI for warfare.
The Ecosystem Powering Nvidia
Nvidia does not manufacture its own chips: it relies primarily on Taiwan Semiconductor Manufacturing Company (TSMC), which produces its most advanced units—such as the H100 and the new B200 Blackwell chips—using 3 and 4 nanometer processes. Pressure from the U.S. government to relocate production led TSMC to build a factory in Arizona as a geostrategic response to ensure supply on American soil.
Additionally, companies like SK Hynix, Micron, Wistron, and Flex form a key supply chain, providing everything from HBM memory to full system assembly. In parallel, Nvidia has accelerated development of the HBM4 chip amid growing competition from new players such as AMD and AI divisions of Chinese firms.
An AI-Powered Empire: Voracious Clients and Strategic Alliances
Meanwhile, Nvidia’s rise has been meteoric. From a napkin sketch in 1993 to a market cap surpassing $4 trillion, the company has gone from revolutionizing video games to becoming the heart of artificial intelligence. The key lies in its GPUs (such as the H100 and the new B200), which power language models like ChatGPT and Llama-4.
Its supplier network includes TSMC, SK Hynix, Micron, and Wistron, while on the demand side, Microsoft, Meta, Amazon, Alphabet, and Super Micro are among the giants boosting its revenue. In fact, Microsoft alone accounts for nearly 19% of Nvidia’s revenue. Microsoft leads with over $29 billion invested, while Meta allocates more than 9% of Nvidia’s total revenue to training its Llama-4 model. Even Amazon, which develops its own Trainium and Graviton chips, continues to purchase Nvidia GPUs due to high customer demand for cutting-edge products.
Now, all hopes are pinned on the new generation of Blackwell chips. The B200 promises performance up to 30 times higher than the H100 in generative AI tasks, positioning it as the new industry standard. But as the market matures, competition, regulation, and geopolitical risks are all intensifying.
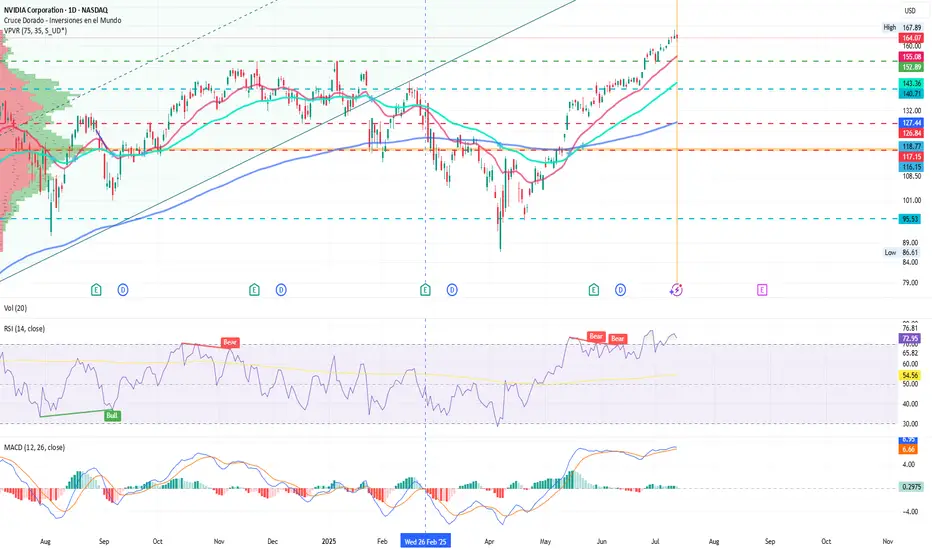
Technical Analysis of Nvidia (NVDA)
Nvidia (NVDA) shares closed yesterday at $164.07, slightly below its all-time high of $167.89. On the daily chart, we observe a consolidation movement after hitting a new record high on Friday. The price remains within an upward channel that began in January 2024.
Key Support: $141.75 (above the 50-session moving average), a level defended by buyers during recent pullbacks.
Immediate Resistance: $167.89 (all-time high). A breakout with volume could open the door to $180 as the next psychological target.
Technical Indicators:
The daily RSI stands at 72.95%, reflecting strong overbought conditions and suggesting continued buying interest.
The moving averages remain in a wide bullish crossover, with no clear sign of directional reversal.
The volume point of control (POC) sits at $118, at the lower end of the consolidation zone.
The MACD continues in a bullish crossover pattern, although it’s starting to show a loss of momentum. This could signal that the price push is weakening, indicating a bearish divergence between price and volume.
The technical outlook remains bullish, but a short-term pause or sideways movement is not out of the question—especially if regulatory pressure or the next quarterly results fail to meet high market expectations. The key level to watch is around $141 as the structural support to maintain the uptrend.
The Future? A Mix of Innovation and Oversight
Nvidia embodies the spirit of Silicon Valley, but its privileged position also makes it a central piece on the global geopolitical chessboard. While its technology drives scientific, medical, and consumer advancements, its ties to Asia and openness to foreign talent will continue to spark friction with Washington.
The big question is whether it can continue to lead the AI race without destabilizing the delicate balance between national security and technological innovation. Time—and the regulators—will tell.
*******************************************************************************************
The information provided does not constitute investment research. The material has not been prepared in accordance with the legal requirements designed to promote the independence of investment research and such should be considered a marketing communication.
All information has been prepared by ActivTrades ("AT"). The information does not contain a record of AT's prices, or an offer of or solicitation for a transaction in any financial instrument. No representation or warranty is given as to the accuracy or completeness of this information.
Any material provided does not have regard to the specific investment objective and financial situation of any person who may receive it. Past performance and forecasting are not a synonym of a reliable indicator of future performance. AT provides an execution-only service. Consequently, any person acting on the information provided does so at their own risk. Political risk is unpredictable. Central bank actions can vary. Platform tools do not guarantee success.
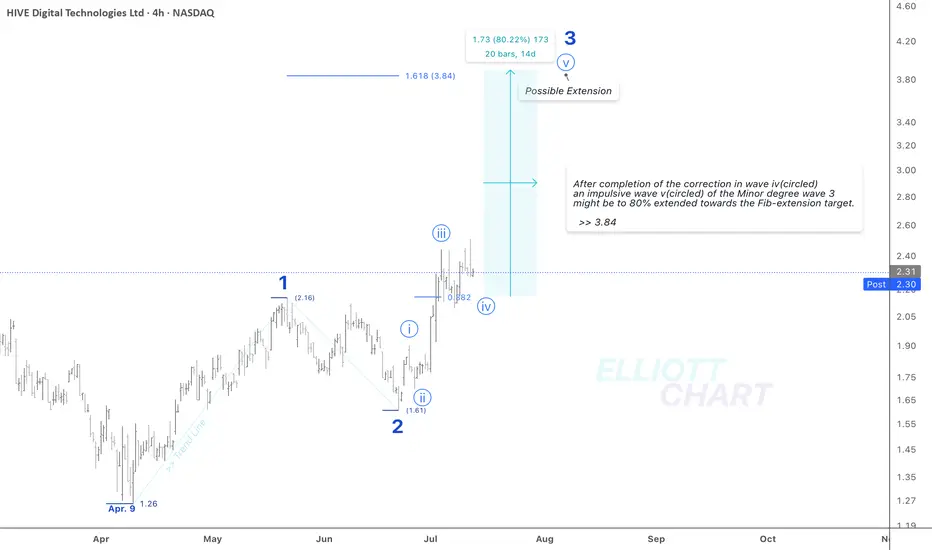
$HIVE / 4hAs depicted in the 4h-frame above, NASDAQ:HIVE may have developed a sequence of Minor degree waves upward >> 1, 2, and an impulse 3, which remains in progress, since April 9.
Wave Analysis >> After completion of the ongoing correction in wave iv(circled), an impulsive wave v(circled) of the Minor degree wave 3 might be to 80% extended towards the Fib-extension target >> 3.84.
#CryptoStocks #HIVE #BTCMining #Bitcoin #BTC
NASDAQ:HIVE CRYPTOCAP:BTC MARKETSCOM:BITCOIN
MSTR returning to ATHMSTR returning to ATH. Will MSTR continue or not? MSTR returning to ATH. Will MSTR continue or not?MSTR returning to ATH. Will MSTR continue or not?MSTR returning to ATH. Will MSTR continue or not?MSTR returning to ATH. Will MSTR continue or not?MSTR returning to ATH. Will MSTR continue or not?MSTR returning to ATH. Will MSTR continue or not?
Mean Reversion Trade: FTNT1. RSI in oversold region
2. Price likely to rebound back the the mean
Trade Rules:
Entry Trigger - RSI has cross below oversold region, enter limit buy at close price
Exit Trigger - Close at market when close price cross above exit trigger (Red step line)

NSE IONQ - Are we ready for a breakout?The corrective phase is complete and an impulse move appears likely. A strong buy above the A-B-C channel could target levels around 30 - 37 - 45 or higher. Good entry is possible above 26. However, if conditions worsen, further corrections may ensue.
I will update further information soon.

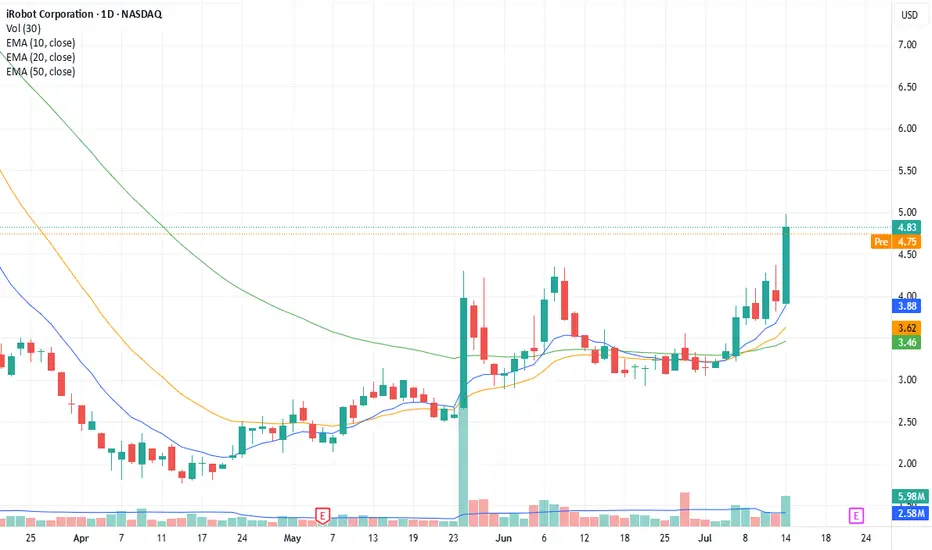
IRBT swing? 1) the uptrend is there
2) breakout already happened, maybe twice now $3.35 and $3.75 maybe ??
3) maybe look to enter at $4 if we comes back
MARA supply and demand; swing tradeI'm looking at the weekly chart here, we have an interesting zone between 14.00$ and 14.68$. We've had decent amount of price action correlating to the areas going back to December of 2020. I set my trade idea with a stop loss at 12.95$ just in case of a liquidity flush , we're still getting at least a 3.5 to 1 ratio, with 2 other targets. This could take till May 2026 to conclude, would consider this a swing trade so could take months or more.

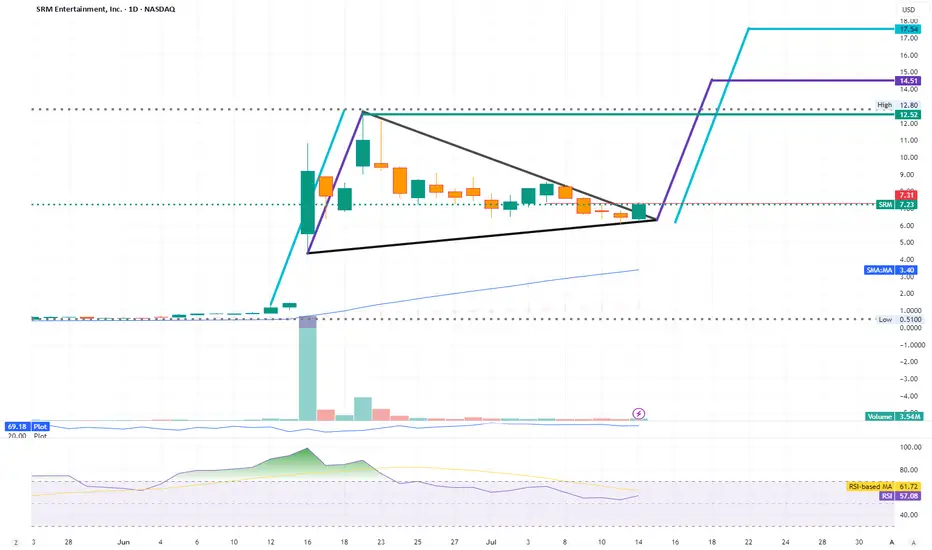
SRM - SRM Entertainment Inc (Soon to be TRON INC.)SRM Entertainment (SRM) used to design, development, and delivery of toys and themed merchandise for the global amusement and entertainment industry. They work with popular brands like Harry Potter, Frozen, Marvel, and Star Wars to create exclusive products found in various venues. However, through a reverse takeover they're are planning to change their name to Tron Inc.
The main reason for this shift is a $100 million equity investment dedicated to a new TRON Token Treasury Strategy. Justin Sun, the founder of the TRON blockchain, is also coming on board as an advisor. This move means they're completely shifting away from their prior business to focus on revenue generation within the blockchain space, with plans to implement a dividend policy through TRX staking.
Financially, SRM's past performance showed some weaknesses, with negative net income. However, what they did in the past is meaningless and has nothing to do with what they are doing now. The new $100 million investment significantly changes their financial outlook, providing substantial capital for their new direction. Currently, they report around $1.09 million in cash and short term investments, with total assets at about $5.81 million and liabilities around $828K.
The move into blockchain with a significant investment and Justin Sun's involvement could position them in a growing technology sector. If the TRON Token Treasury Strategy is successful and the blockchain market expands, there's potential for upside and a dividend policy from TRX staking could attract investors.
Their new model focuses on the TRON Token Treasury Strategy. They plan to generate revenue by acquiring and holding TRON (TRX) tokens, benefiting if the TRX value increases. They'll also earn staking rewards by locking up their TRX holdings to support the TRON network, and, once stable, they intend to distribute a portion of these staking rewards as dividends to shareholders. This strategy ties their financial performance directly to the TRON blockchain ecosystem.
Overall, this is a high risk, high reward situation. It will requires careful monitoring given volatility of the crypto market. It's not a typical long term, low maintenance investment at this stage.
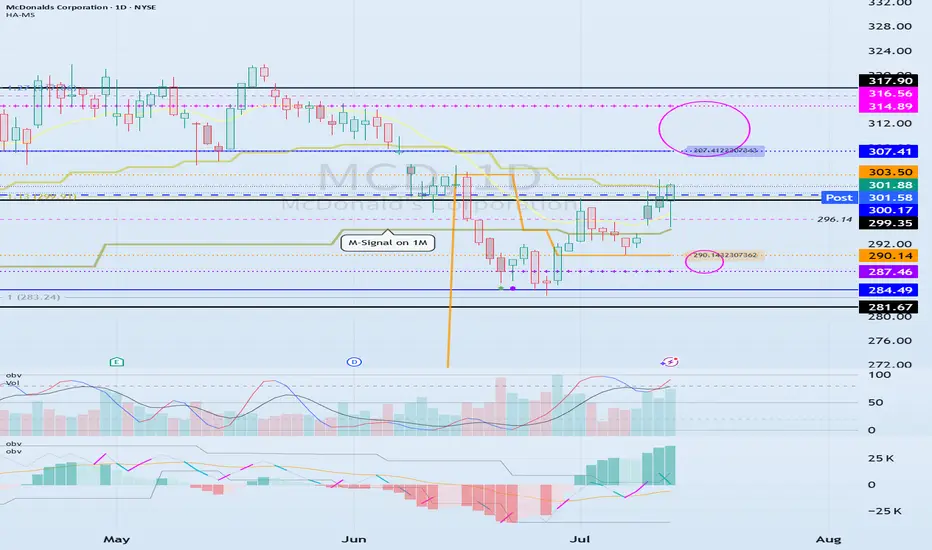
The key is whether it can be supported and rise near 300.17
Hello, traders.
If you "Follow", you can always get new information quickly.
Have a nice day today.
-------------------------------------
(MCD 1D chart)
Before following the basic trading strategy, the first thing to check is whether the current price is above or below the M-Signal indicator on the 1M chart.
If the price is below the M-Signal indicator on the 1M chart, there is a possibility that it will turn into a medium- to long-term downtrend.
Therefore, if possible, it is recommended to trade stocks whose prices are above the M-Signal indicator on the 1M chart.
If the price is below the M-Signal indicator on the 1M chart, you should respond quickly and briefly using the short-term trading (day trading) method.
-
The support and resistance zones can be seen as the 287.46-290.14 zone and the 307.41-314.89 zone.
The 287.46-290.14 zone is the DOM(-60) ~ HA-Low zone, and the 307.41-314.89 zone is the HA-High ~ DOM(60) zone.
These two zones are likely to form a trend depending on how they break through, so they can be seen as support and resistance zones.
-
The 300.17-316.56 zone is the HA-High ~ DOM(60) zone on the 1W chart.
Therefore, we need to check whether it can receive support and rise in the 300.17-316.56 zone.
Therefore, if it falls near the 307.41-314.89 range, you should check for support near 300.17.
-
If it rises above the HA-High ~ DOM(60) range, it is likely to show a step-up trend, and if it falls in the DOM(-60) ~ HA-Low range, it is likely to show a step-down trend.
-
Thank you for reading to the end.
I hope you have a successful transaction.
--------------------------------------------------
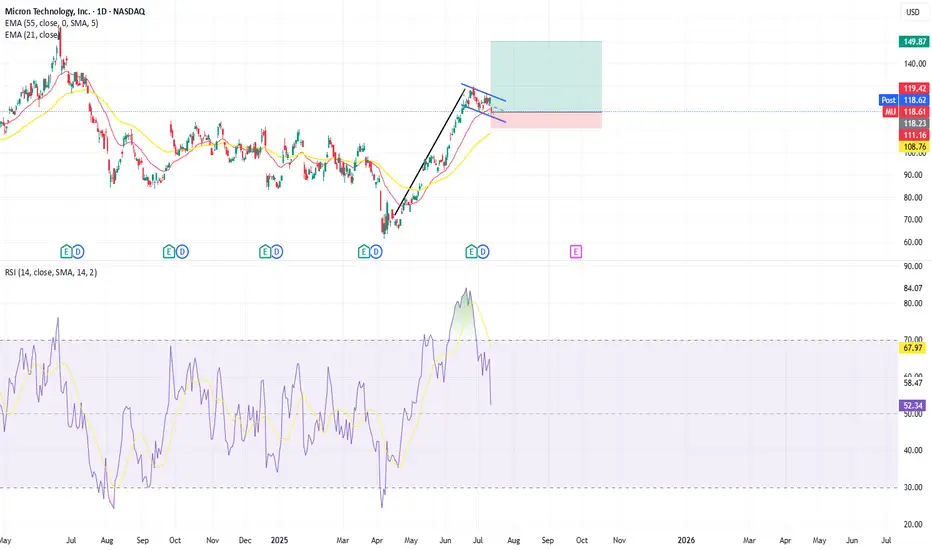
Bullish flag Pattern on MUIt appears there is a Bull flag occurring in MU. Weve seen an 82% rise since the lows caused by the market drop in April and our now seeing a slight retraction back into the 21 EMA. Price is currently at 118.6 with some support at the 114 level. Using a Stop Loss just below this support level should it break and using the first target of 150, just below all time highs yields a risk reward ratio of 1:4.5.