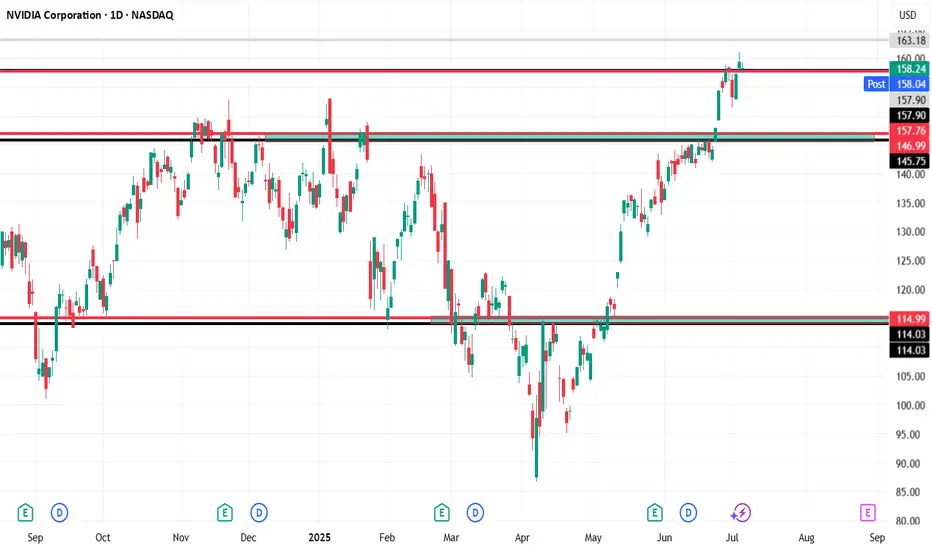
NVDA📊 NVIDIA (NVDA) – Daily Chart Technical Analysis
Entry Point:
A long position is considered at $158, assuming the price holds above $157.78.
Resistance & Target:
The first target is set at $163, which is a clear resistance zone on the chart based on historical price reactions.
If momentum continues beyond that, higher targets could be considered in future analysis.
Stop Loss:
A tight stop-loss is placed just below key support at $157 to manage risk.
🔄 Weekly Bearish Scenario:
If the price closes below $157, this invalidates the bullish setup:
The first downside target would be $146, which is a previously established support zone.
A further drop could extend toward $115, especially if broader market weakness or sector rotation occurs.
📌 Key Technical Zones:
Support Zones: $157.78, $157.00 (critical for bullish continuation)
Resistance Zones: $158.12, $163.18
Multiple historical rejections and price consolidations are noted near these zones, highlighting their significance.
Summary:
As long as NVDA remains above $157.78, the outlook remains bullish targeting $163. However, a confirmed breakdown below $157 could shift the sentiment sharply bearish, targeting $146 and possibly $115.
Trade Idea: $HOOD – $106C by 7/25 | Bullish Setup🧠 Thesis:
After topping out at $100, NASDAQ:HOOD pulled back ~10%. I believe this recent pullback sets up a healthy base for a continuation move back toward $100+ in the coming sessions. If momentum kicks in, we could see a push toward the $106 level by expiration.
📊 Key Levels:
Resistance: $95.60 → $97.34 → $99.77 → $102 → $106
Support: $94.00 (uptrend line), $92.97 (higher low), $90.97 (must hold for bulls)
📌 Trade Strategy:
I'm scaling into the $106 Calls expiring 7/25.
Looking for:
A breakout above $97.34 to trigger upside momentum
Profit-taking zones around $99.77 and $102
Final target near $106 (ITM zone)
Risk is managed below $92.97.
🧭 Notes:
Watching broader market sentiment and NASDAQ:QQQ correlation closely. Volume confirmation will be key on any breakout attempts.

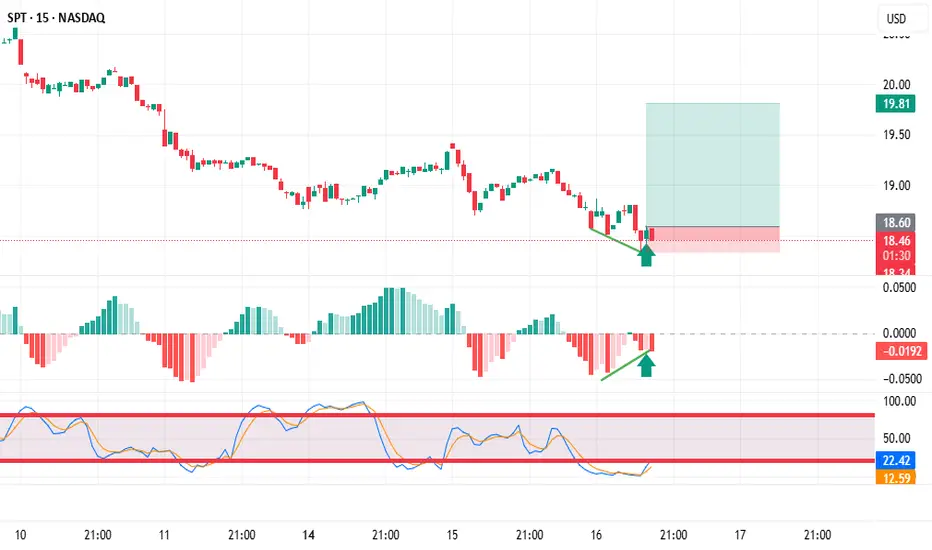
Mean Reversion Trade: MA1. RSI in oversold region
2. Price likely to rebound back the the mean
Trade Rules:
Entry Trigger - RSI has cross below oversold region, enter limit buy at close price
Exit Trigger - Close at market when close price cross above exit trigger (Red step line)

SMCI: Watching Monitoring price action closely. Momentum remains positive, and volume is supportive of continuation. Awaiting confirmation before entering, but setup favors a potential move higher.

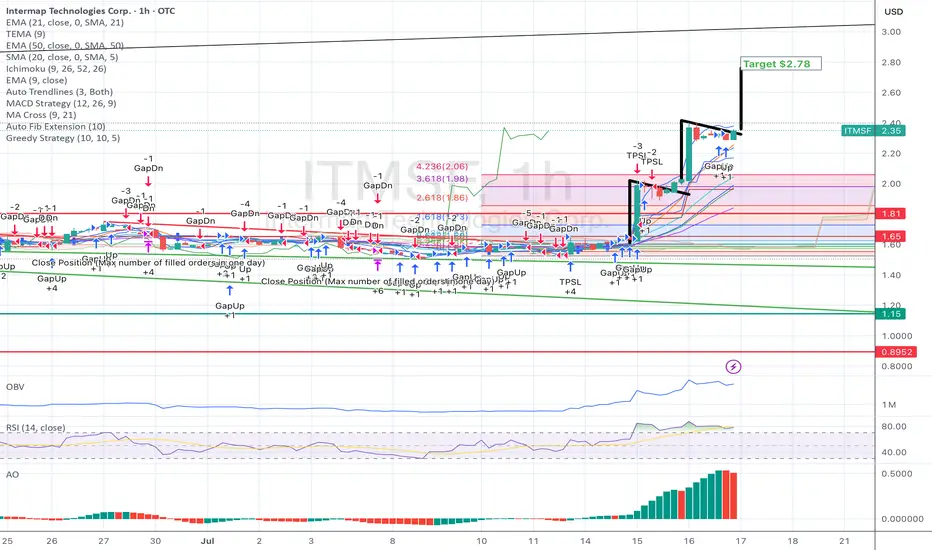
Continuation with exact bull flag for back to back %15 on ITMSF Price discovery is occurring and much more to go to get to $5.... :)
COIN -- Major Trendlines + Bearish Divergence = Breakdown?Hello Traders!
Today I have shared the chart of COINBASE. Of course we cant know for sure what price will do, however you can take clues and combine them to give you a high probability reading of the chart.
Here are the clues:
1) MAJOR TRENDLINE
2) TRENDLINE
3) BEARISH DIVERGENCE
4) BULL FLAG MEASURED MOVE
When we combine these clues, a very bearish picture is painted... This signals to me that there is a high probability price will likely reverse and trade to the downside in the near future.
I hope everyone enjoyed this post and is able to use it as an educational tool.
Thanks everyone and best of luck on your trading journey!

fuboTV $5.00 price target Positive Divergence Multi time frameMy trade on fuboTV has a $5.00 price target. With positive divergence multiple time frames 15,1hr, 4hr. An RSI scoop where the hrly RSI with a length setting of 36 shows upward momentum? The Chande momentum oscillator with a setting of 24 indicates the price may not stall at $4.50.

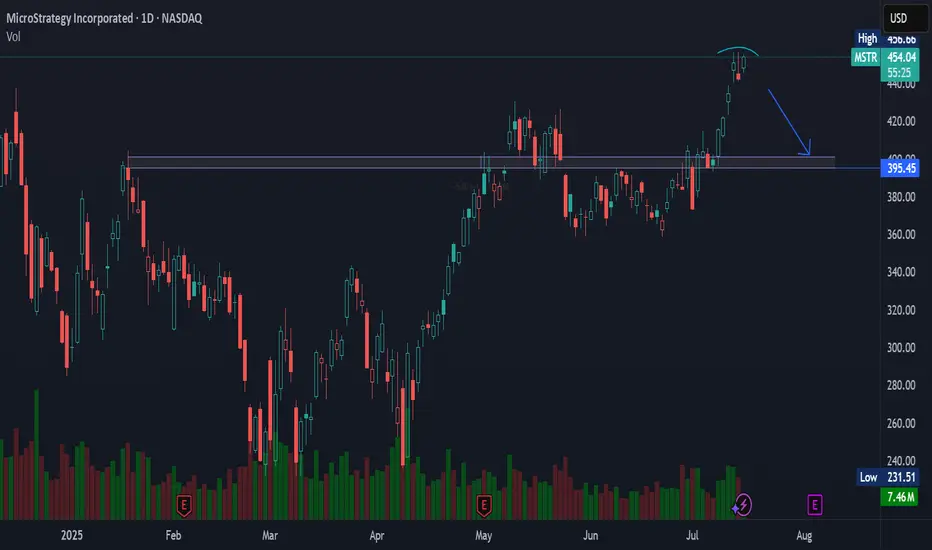
MSTR NASDAQ:MSTR looks like it’s gearing up for a pullback — eyes on the $395 level for a potential retest.
Watch the support. 👀📉
#MSTR #Bitcoin #Stocks #Tech #Trading
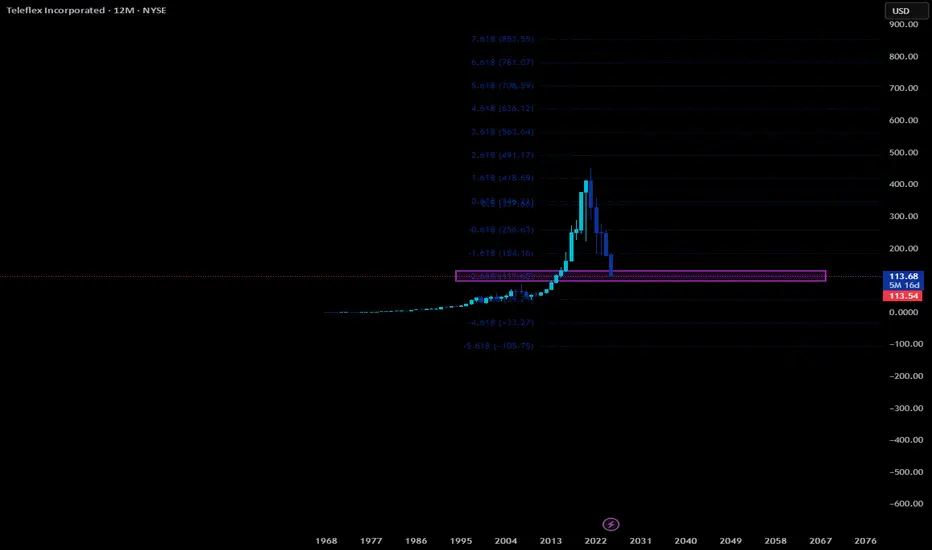
$FICO Bullish too good to ignore here. seems like it has finally found support just where it did a few weeks ago. Williams % range curling as well. Invalidation would be a close below the S/R flip zone below. First target would be to test the falling trend zone and hopefully find a breakthrough

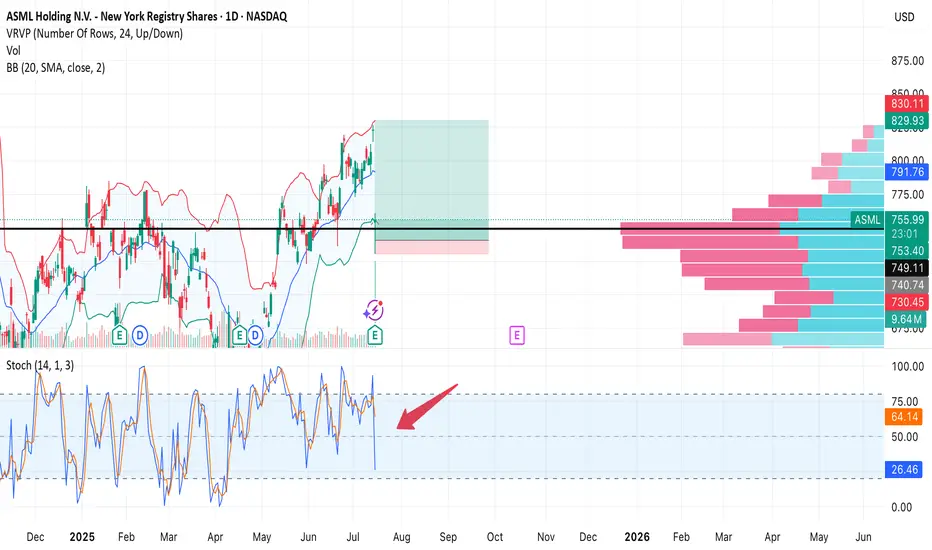
ASML — Strong earnings, sharp drop on profit-taking. Second chanAfter a strong quarterly report, NASDAQ:ASML stock initially surged, but then dropped -7.6% in a single session. Most likely due to profit-taking and a broader tech sector correction. Still, the key $754 support held, and the uptrend remains intact.
Trade Setup:
• Buy Zone: $754–760 (on retest)
• Target: $849 (+12%)
• Stop Loss: $730 (below support and volume shelf)
• Risk/Reward: 1:8
Earnings were great, fundamentals are solid. This drop could be a shakeout before continuation. As long as $754 holds, bulls have a second chance.
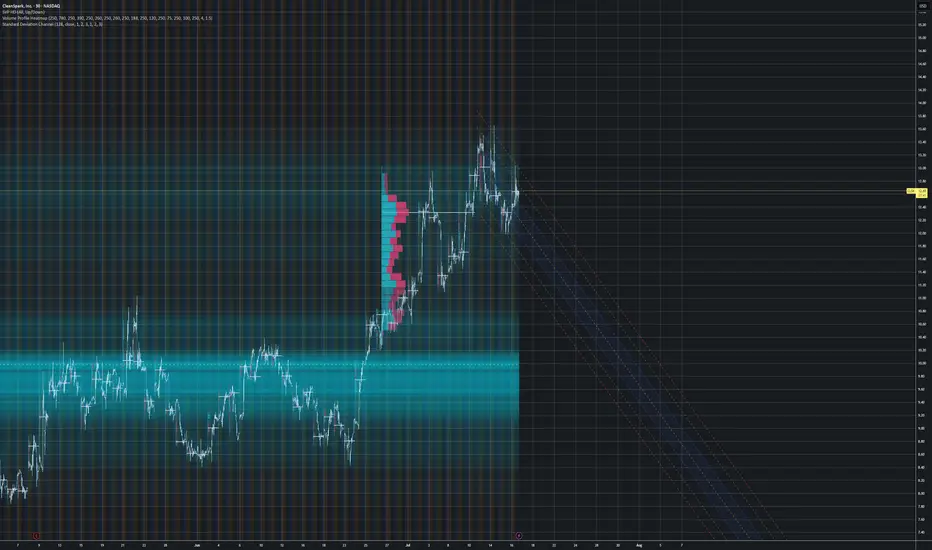
[$CLSK] CleanSpark Inc. - Farming [$BTC] LongNASDAQ:CLSK
no finanical advice
📑market outlook
+ Fed rate cut priced in --> short term risk-on environment
+ total FIAT-debasement in motion --> Precious &Crypto are poomping
- geo-political risk can drag down the 'weaker ANTI-Fiat' risk-on positions
💡idea
we want to farm BTC indirectly by selling covered-calls /placing cash secured puts
🧪approach
derivatives options with i.e. 0.1 BTC ~ 10,000 USD
🏁target
get 2% yield per month
⚠️ caution
Only weekly options: --> Crypto Cycle could take hits of -50% which would basically demolish your position
--> check weekly volume/sentiment on BTC
Don't forget:
⏳ Theta is our alley. Always have been!

Upxi7hr low stochastics
Potential hidden bullish divergence here.
I could see a 23 a share target.
My humble opinion

[$CLSK] CleanSpark Inc. - Farming [$BTC] Long[ NASDAQ:CLSK ]
no finanical advice
📑market outlook
+ Fed rate cut priced in --> short term risk-on environment
+ total FIAT-debasement in motion --> Precious &Crypto are poomping
- geo-political risk can drag down the 'weaker ANTI-Fiat' risk-on positions
💡idea
we want to farm BTC indirectly by selling covered-calls /placing cash secured puts
🧪approach
derivatives options with i.e. 0.1 BTC ~ 10,000 USD
🏁target
get 2% yield per month
⚠️ caution
Only weekly options: --> Crypto Cycle could take hits of -50% which would basically demolish your position
--> check weekly volume/sentiment on BTC
Don't forget:
⏳ Theta is our alley. Always have been!
TSLA about to put in a huge reversal dayCoinrotator.app signaling higher after a 3 month consolidation.
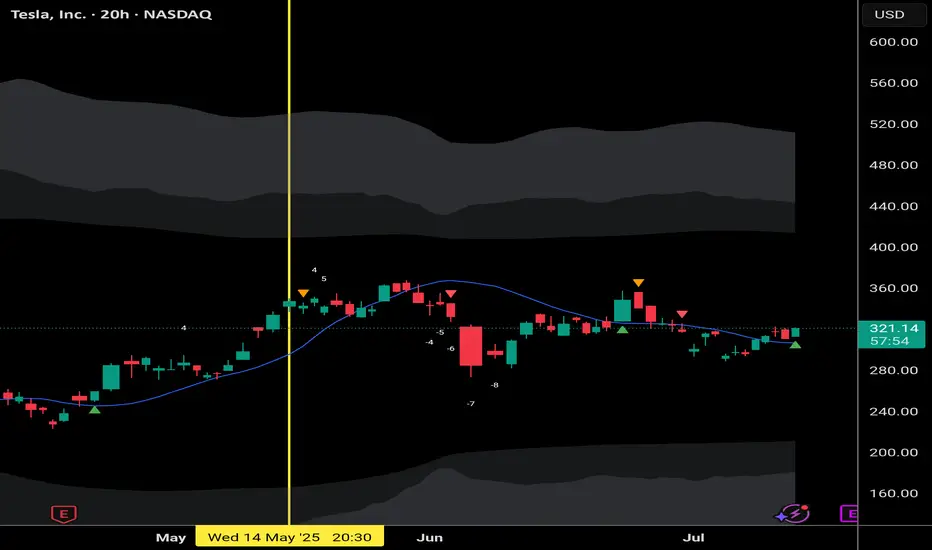
TSLA UPDATE: Trend Initiation in Play – WaverVanir SMC ModelPosted July 16, 2025 – 15m Chart
🚨 "PLACE YOUR BETS!" triggered bullish confirmation.
After textbook accumulation → manipulation → expansion, TSLA is attempting a breakout above premium zone. We're entering trend territory now.
🔍 Highlights:
🔄 Accumulation held above the 0.5–0.618 Fib + SMC EQ zones
💥 Manipulation sweep faked below $312.63 before reclaiming
🎯 Target zones:
▫️ $322.45 reclaim confirms
▫️ $329.32 → $340.35 are projected liquidity zones
🔊 Volume is climbing as trend unfolds
🧠 WaverVanir DSS Notes:
Our ORB model detected a valid launch from $316.85 (0.786 Fib)
This is Trend Phase 1, with volatility expected to increase
No More Bets! = stop hunting complete
Smart money likely positioned → now comes the markup
youtu.be

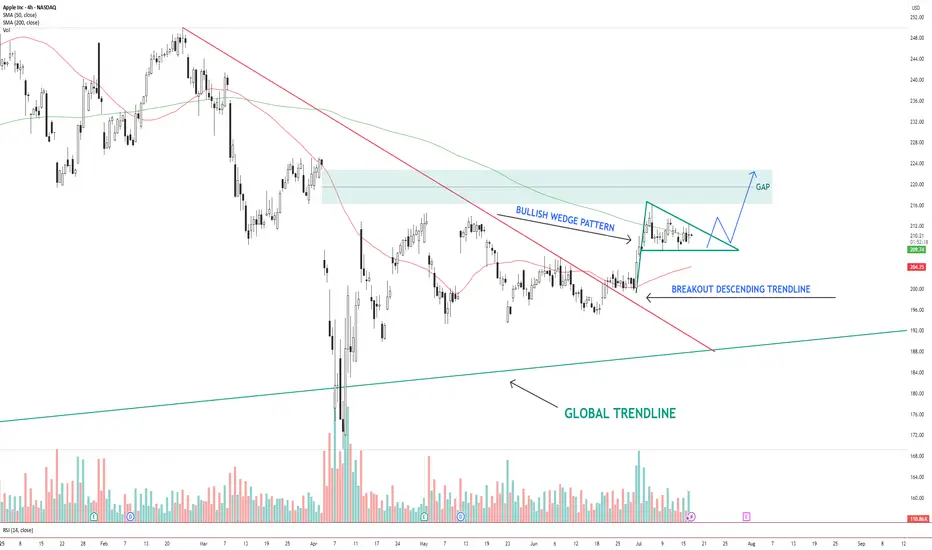
AAPL – Bullish Wedge Breakout Setup Toward Gap FillAAPL NASDAQ:AAPL has broken out of a descending trendline and is now consolidating inside a bullish wedge pattern . Price is holding above the 200 SMA and hovering near the 50 SMA.
The structure suggests a potential breakout above the wedge, with a clear gap area between $216–$224 acting as the next upside target.
Key levels:
Support: $206 (wedge base / 50 SMA)
Resistance: $216–$224 (gap zone)
Trend structure: Bullish consolidation after breakout
A clean breakout from the wedge with volume could trigger a continuation move toward the gap zone.
📌 Watching for confirmation and potential entry on a breakout + retest.
This is not financial advice. Always do your own research.
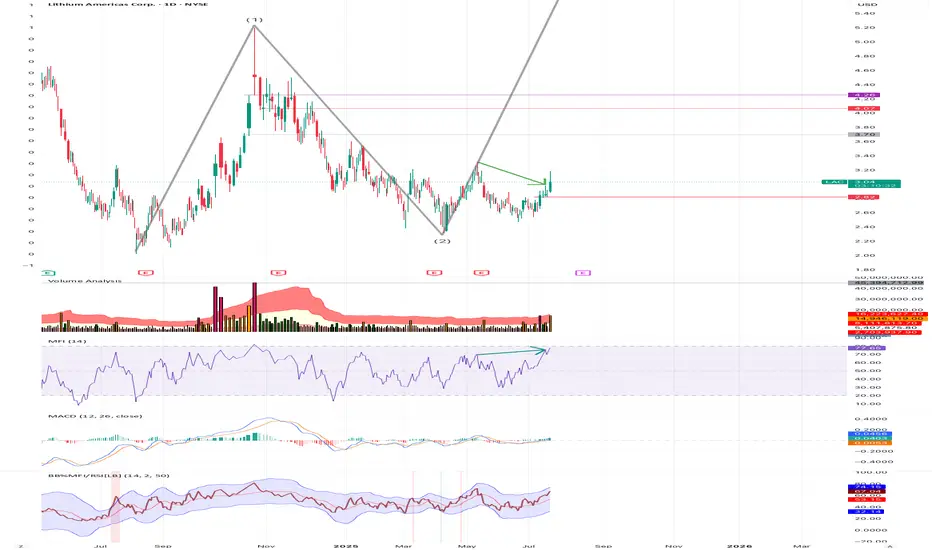
$LAC up from here: support, elliot wave, price actionI believe LAC may have begun its 3rd elliot wave, with a bottom at $2.33. There also appears to be nice recent strong base support around $2.80. In addition, there appears to be a deviation between price and money flow, as shown with the green arrows - with a potential correction available to push price beyond $3.30 very soon.
I have entered and will watch its daily action and volume with an upside expectation limit around $9-10, then a 4th wave down, etc. Of course, I am not a financial advisor and I have been wrong before and will be wrong again. I trade within this reality and control my risk.
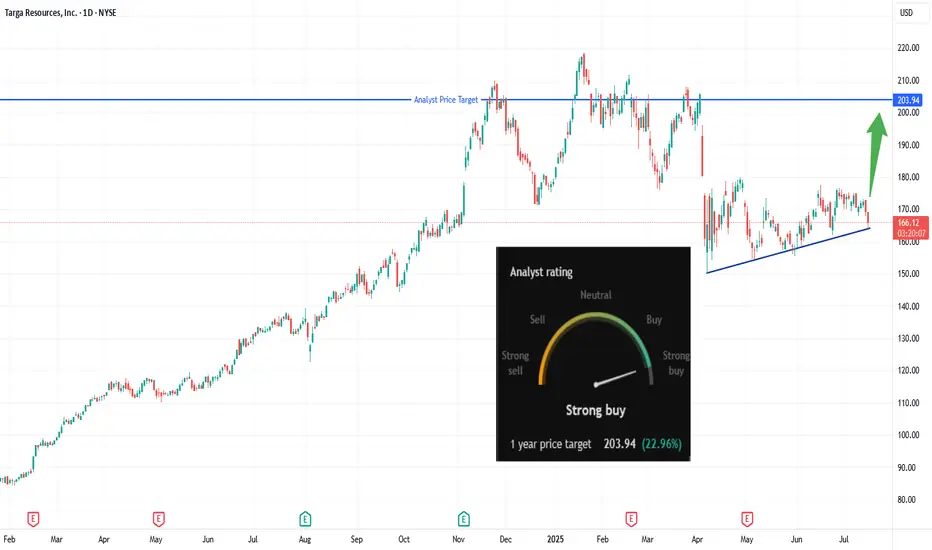
Breakout Brewing: Is TRGP About to Explode?🔹 Trade Summary
Setup:
Ascending triangle forming over several months
Price consolidating near major resistance
Strong analyst buy rating with 1-year target at $203.94
Entry:
Buy on daily close above $169.42 (breakout trigger)
Stop-loss:
Below $159 (invalidate the setup)
Targets:
$203.94 (analyst target / recent highs)
Risk/Reward:
Approx. 1:3.5 (risking ~$10 for ~$34 gain)
🔹 Technical Rationale
🔹 Ascending triangle pattern suggests bullish continuation
🔹 Flat resistance at $169.42 now being challenged
🔹 Daily timeframe, recent higher lows showing building pressure
🔹 Catalysts & Context
🚦 Analyst “Strong Buy” rating with 1-year upside potential of +22.96%
🛢️ Energy sector momentum, especially in midstream & LNG plays
📰 Potential earnings/corporate updates could drive breakout
🔹 Trade Management Plan
Entry: Buy only on daily close above $169.42
Stop-loss: Below $159 — trail up if price closes above $180
Scaling: Take partial profits at $185, remainder at $203.94 (target)
What’s your view? Are you watching NYSE:TRGP ? Comment below or vote:
🔼 Bullish
🔽 Bearish
🔄 Waiting for confirmation
🔹 Disclaimer
Not financial advice. Trade at your own risk.
*** Don't forget to follow us for more trade setups ***
Trading stocks using Dr. Elder's "Three Screens" methodI found a great divergence on the weekly chart
Then I looked at the daily chart of this stock, and here I also found divergence.
Then I looked at the hourly chart of this stock, and here I also found divergence.
And even on the 15-minute chart I saw price divergence towards the indicators. This will be an excellent entry into a long position.

Roblox to $110I don't know much about Roblox except that my nieces play it and their gross profits are insane. Should be a pretty likely move to $110. It's currently trading at 12X revenue. My best guess is Hindenburg did a number on keeping this stock down.
Good luck if you take this trade!

Hidden Support on RIG: Next Big Move?🔹 Trade Summary
Setup:
Price pulling back to ascending trendline support
Testing major support near $2.58
Analyst 1-year target: $3.76
Entry:
Above today's high of $2.64 (on confirmation of bounce from trendline)
Stop-loss:
Below $2.40 (clear break of trendline)
Targets:
$3.76 (analyst price target / major resistance)
Risk/Reward:
Approx. 1:4 (risking ~$0.25 for ~$1.10 gain)
🔹 Technical Rationale
🔹 Ascending trendline holding as key support since April
🔹 Oversold bounce potential at this zone
🔹 Daily timeframe shows structure for a trend reversal if support holds
🔹 Catalysts & Context
🏦 Strong analyst “Buy” rating; 1-year target at $3.76 (+45%)
🛢️ Oil sector volatility—any rally could boost offshore drillers
🌍 Macro: Global energy demand headlines could trigger momentum
🔹 Trade Management Plan
Entry: Wait for daily close above $2.65 to confirm support
Stop-loss: Move to breakeven if price closes above $3.00
Scaling: Trim partial at $3.20, rest at $3.76 (analyst target)
What’s your view? Are you watching NYSE:RIG ? Comment below:
🔼 Bullish
🔽 Bearish
🔄 Waiting for confirmation
🔹 Disclaimer
Not financial advice. Trade at your own risk.
*** Don't forget to follow us for more trade setups ***
