Morgan Stanley: Post-Earnings Reaction & Technical SetupToday, NYSE:MS released strong earnings:
🔹 $2.13 EPS vs. expected $1.98
🔹 Revenue: $16.8B, including:
— +23% in equity trading
— +9% in fixed income
— $59B inflows into Wealth Management
Despite the beat, the stock dropped nearly 4%, signaling possible profit-taking after a 30%+ rally year-to-date.
Technical View
The price broke below the middle line of the Bollinger Bands, heading toward the lower band.
The Stochastic RSI turned sharply lower, confirming downside momentum.
Volume on the decline is above average — a bearish sign.
🟦 Key support lies around $130–131, a zone to watch for a potential bounce.
🟥 A breakdown below it could open the way to $127–128.
The market may have priced in the strong results ahead of time, leading to a sell-the-news reaction.
We now see a potential correction toward the $131 area — where buyers might step in.

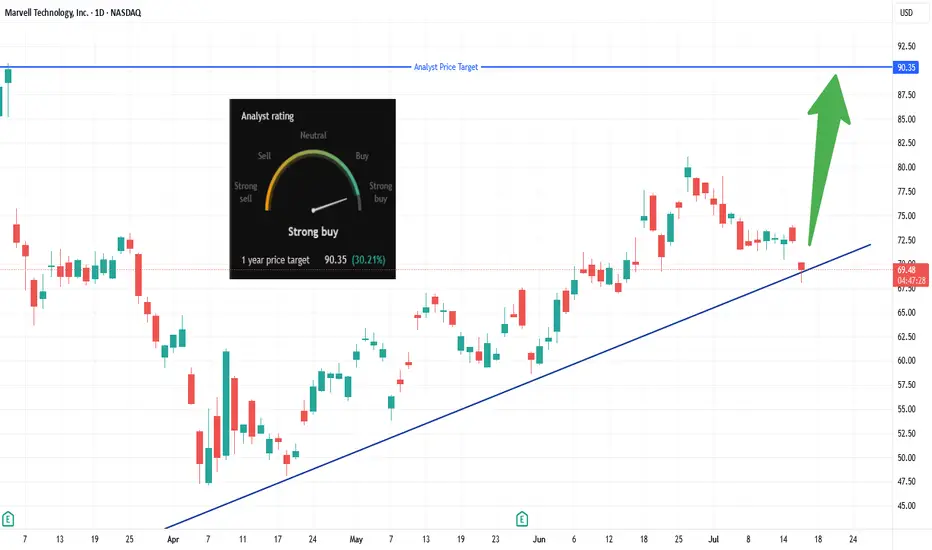
MRVL Long Breakout Setup, Eyes $90 Target!Looking to enter long on a clear breakout above $70.13 (today’s high).
• Entry: Above $70.13
• Stop-Loss: Below today’s low (~$68.50) to protect capital
• Target: $90.35 – per analyst consensus (~+30%)
✅ Why:
📈 Trendline bounce & momentum: Price holding strong above an ascending trendline from April suggests buyers are stepping in.
🏢 AI-chip catalyst: Marvell’s custom ASICs are gaining traction with Amazon, Microsoft, and Google—data-center demand is surging.
💰 Analyst confidence: Consensus is “Strong Buy” with average targets between $90–$94 (some as high as $133).
🧩 Market & Sector Tailwinds: AI chip stocks rallying; Marvell poised as lower-cost custom-chip alternative to Nvidia—and undervalued vs peers.
*** Be sure to follow us for more trade setups! ***
$ZENA Updated Support/Resistance LinesPerfect spot for a pullback to support above $5, before retest of the $6 and higher.

NBIS 55 BREAKOUT in the works!NBIS is an AI darling and a big momentum stock. When it goes it goes! it has been testing this 55 level for some time now.
We recently had a big GS upgrade that "woke" it up. A rest day here and another one will let the 9ema catch up to it and allow for a big breakout. If we take out this trendline at 55 ill put the stop 9ema and swing this.

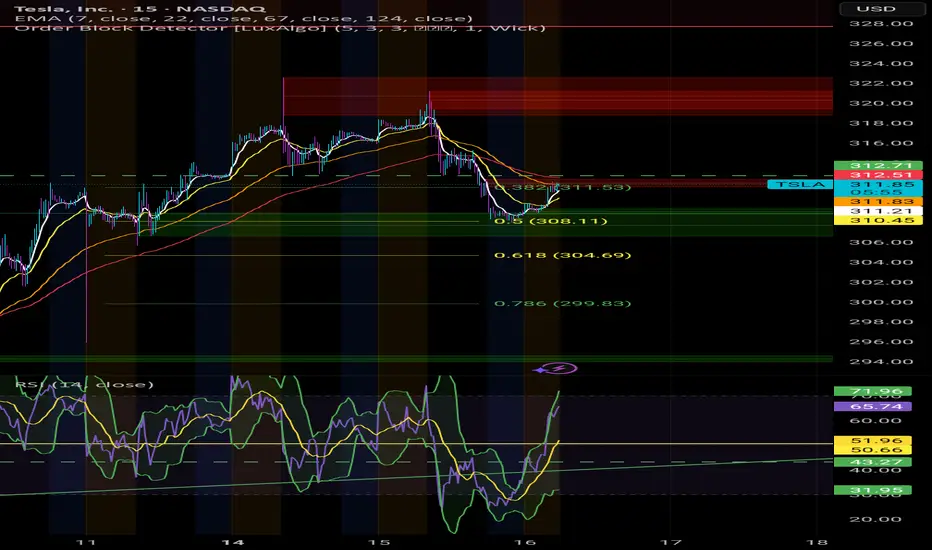
TSLA: DT 7/16/2025Took a trade at the fair value gap 15 min TF, If the market is going to reverse it is either going to be from .50 or .382.

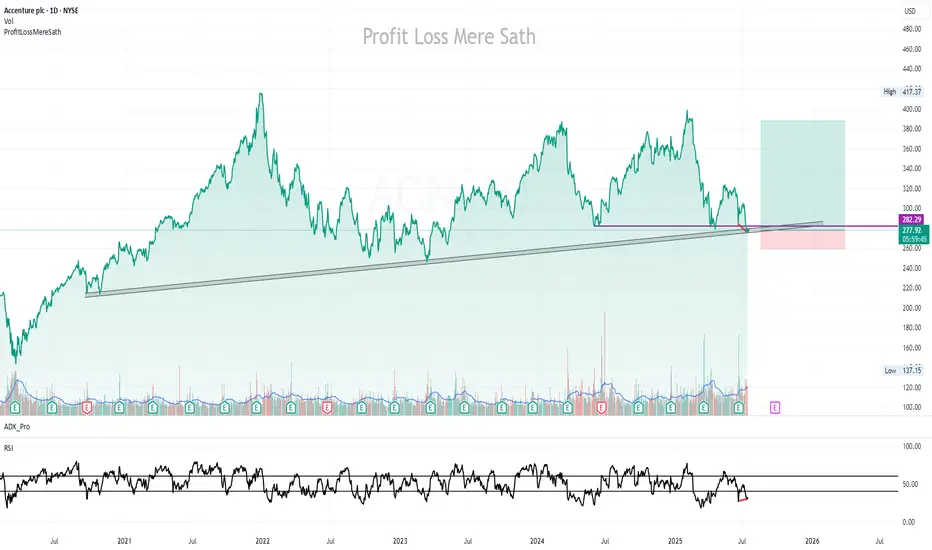
ACN | Buy @LTP | SL below 260 on closing basis | Target 385Disclaimer:
This is not financial advice. Please do your own research or consult with a financial advisor before making any investment decisions. Investments in stocks can be risky and may result in loss of capital.
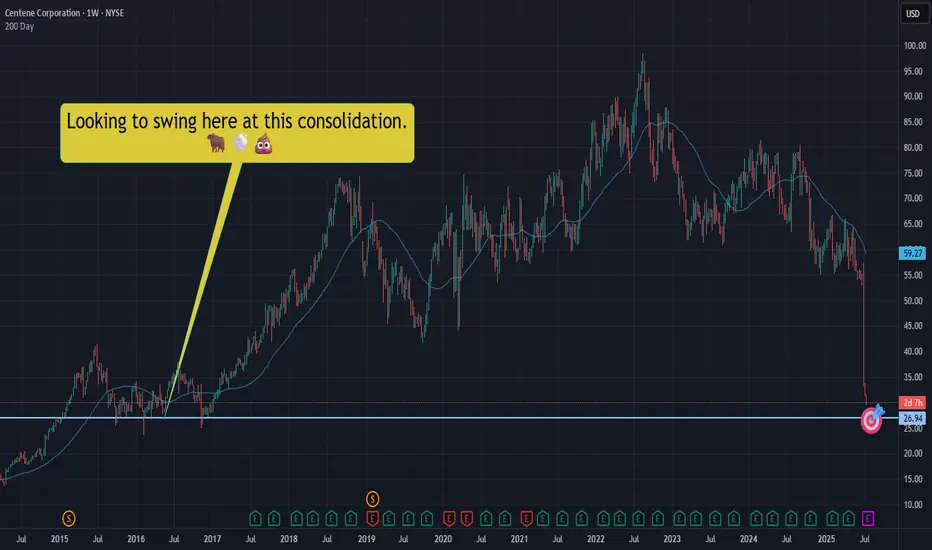
CNC|Let's take a swing at a falling dagger! NYSE:CNC slicing through the void, well.... like a falling dagger through a void.
Not trying to catch this bad boi, but we should expect a bounce at some point. Let's swing for a bounce in that $26.90ish area.
This is NOT a YOLO and I hope it's not an "oh no!" Let's keep our wits about us - starter position only. We can add if we need to, but let's just hope we sell and make some quick Christmas money.
THANK YOU FOR YOUR ATTENTION ON THIS MATTER
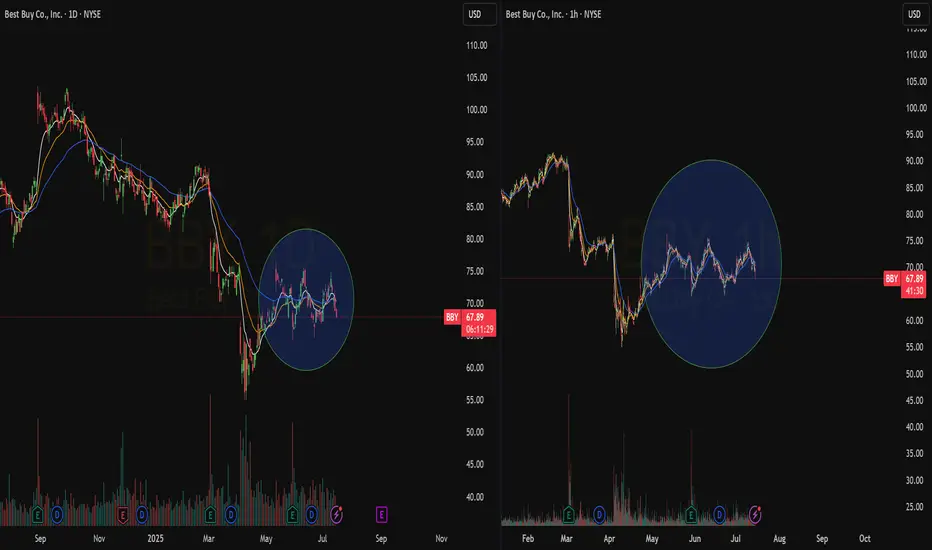
Quick View: $BBY- Both the TF are showing a strong consolidation area after a deep pullback. Volume is still there.
Ready to catch the action.
META - Double Top Currently Meta's double top around $750 is still in play. We wanted to watch the $710 level start to hold to climb back up but in early market we are still seeing a fall which could lead to our next lower support level around $680.
EPS data coming at the end of the month could signal if the trend will continue to be weak or if it is able to stay in line with the last few surprise prints and break through the key double top level.
The bearish divergence also shows us that currently the strength is starting to weaken in relation to price. Higher highs in price but lower highs on the RSI.


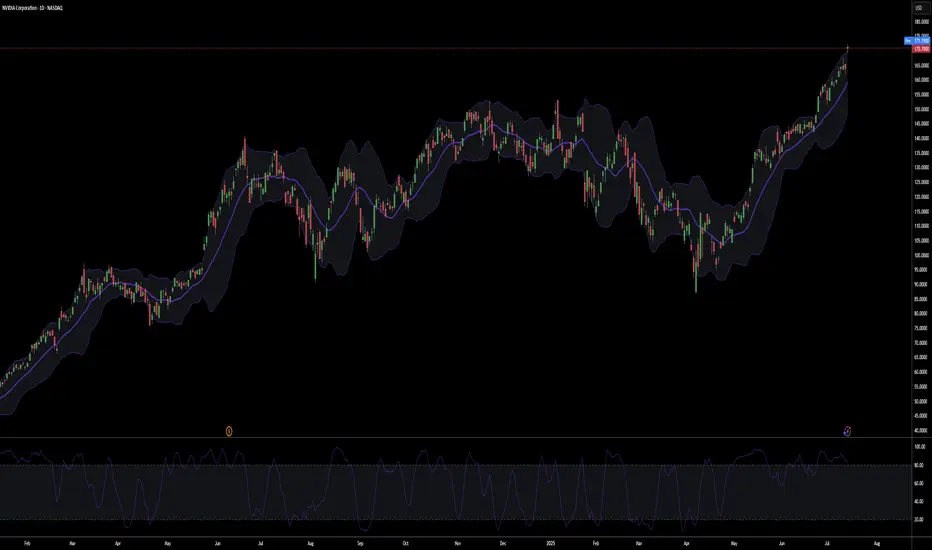
NVDA - Going VerticalNVDA has continue to see our near vertical trajectory to the upside.
After yesterday's test of our blue trendline on the daily at $160 price bounced and has now moved up to $170.
Due to the angle of this trend we will break to the downside very soon, but most likely not before some sort of blow off top move towards the $200 level. It is possible we continue to go vertical but just below $200 seems to be where the major level is to see some take profit start occurring.
Also market structure has been super strong which you can see by the retest and hold of the $153 level (yellow dotted line). This was the previous ATH that NVDA recently created as a new level of support with that retest.

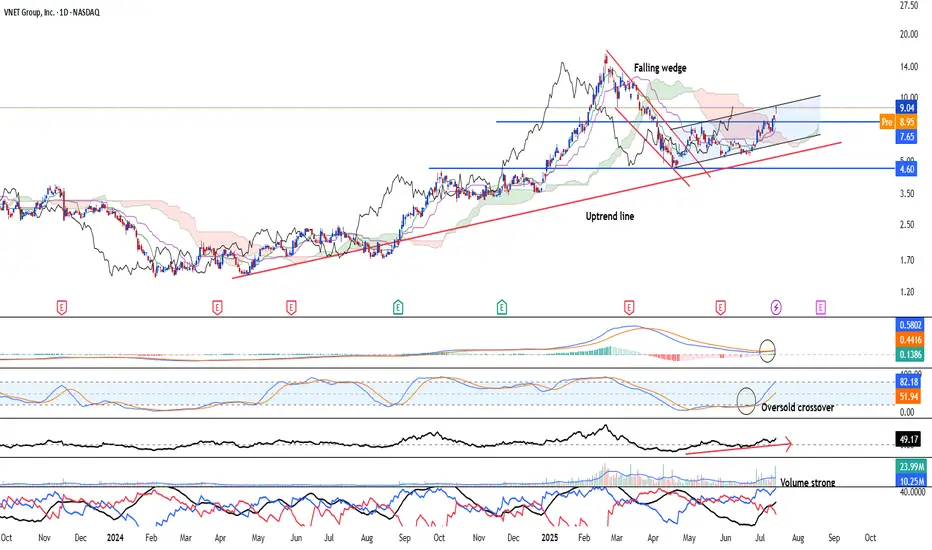
Vnet Group - Bullish trend in an early stage NASDAQ:VNET is looking at an early bullish trend continuation after the stock has broken out of the falling wedge and forms a pair of higher high and higher low. Uptrend remain intact since April 2024. Stock is likely to see strong upside going forward.
Long-term MACD just see a crossover. and histogram is positive. Stochastic oscillator has risen after confirming the oversold crossover and 23-period ROC is positive.
Volume is strong along with the uptrend and directional movement index is strongly bullish.
We see the target able to reach US$20.00. support will be at 7.65 and 6.27
Weekly Equities Trade Idea: CRCL Puts (Update)Hello Traders!
I'm providing an update to the CRCL trade idea from Monday July 14th. Here's what I'm watching:
- Price to open within the range from Tuesday July 15th
- Potential imbalance resolve from Monday July 14th at $204.70
- If price breaks Friday July 11th's high at $206.80 the trade is invalidated
Cheers,
DTD

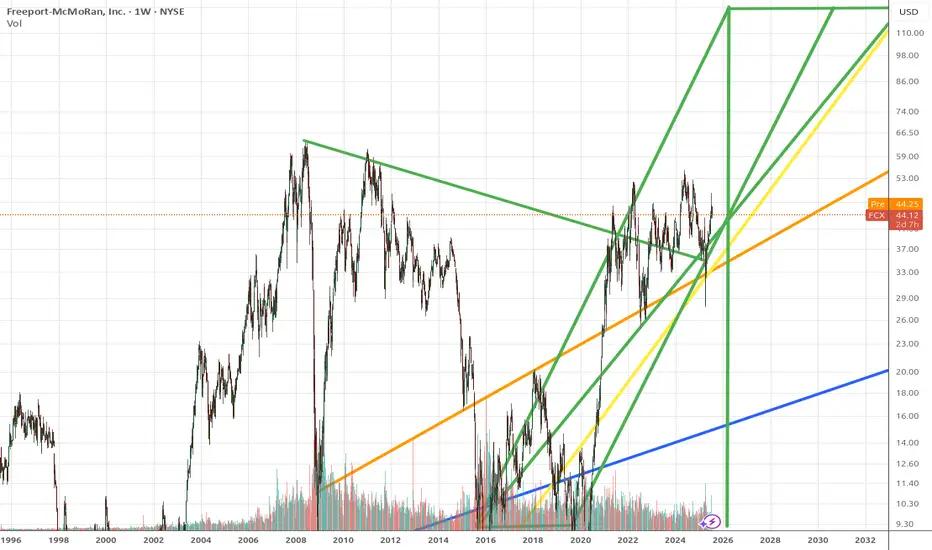
New normal for FCXWhen gold and silver are high and copper is in high demand as well as other metal, FCX goes balistic
AMD in cross section of 2 important levelsAMD is at the crosssection of 2 important
trend lines
1. from Jun22 lows to sep23 lows and Aug 24 lows,
breaking down in Dec24.
2. The channel from Mar24.
I hope the price comes down to 133 levels.

NVDA SELL SELL SELLSELL NVDA at any price now, riding it back down to 93.00 to 77.00 as Profit Targets, Stop Loss will be determine later!
If anyone likes long mumbo jumbo garbage analysis, than this is NOT for you.
Also, if you are afraid of risk, failure, and want only a 100% sure thing, than
run as fast as you can from the market, because the market is NOT a sure thing,
so it is definitely NOT for you.
WARNING: This is just opinions of the market and its only for journaling purpose. This information and any publication here are NOT meant to be, and do NOT constitute, financial, investment, trading, or other types of advice or recommendations. Trading any market instrument is a RISKY business, so do your own due diligence, and trade at your own risk. You can loose all of your money and much more.
Transitioning to a full Ethereum strategy at the right timeI feel that the ETH/BTC pair has bottomed out, and this company is likely to benefit greatly from Ethereum’s rise (and from staking), as one of the largest ETH holders.

Possible Break-Out Chart Pattern and News RelatedUpdate to Rigetti:
After a retest to the Fibonacci Support-Zone 0,5-0,618, we could see an impulse Movement in Wave 3 to the 1,618 Fibonnacci lvl around 24 $
News relating the new system and low error for their new qubits could launch that wave.

NVDA SELLSELL NVDA at 149.00 to 163.00, riding it back down to 93.00 to 77.00 as Profit Targets, Stop Loss is at 172.00!
If anyone likes long mumbo jumbo garbage analysis, than this is NOT for you.
Also, if you are afraid of risk, failure, and want only a 100% sure thing, than
run as fast as you can from the markets, because the markets are NOT a sure thing,
so it is definitely NOT for you.
WARNING: This is just my opinions of the market and its only for journaling purpose. This information and any publication here are NOT meant to be, and do NOT constitute, financial, investment, trading, or other types of advice or recommendations. Trading any market instrument is a RISKY business, so do your own due diligence, and trade at your own risk. You can loose all of your money and much more.

Is the BullRun over? I don't think so. $TSLAYesterday we saw a somewhat heavy fall in Indexes, and it probably scared alot of retail Bulls outs.
However, it seems we've fallen straight into potential medium term supports across multiple stocks in the markets.
I'm convinced we will get a good economic data print today.
This would open the door to new ATHs, again, in the Indexes.
For this to play out, the local bottoms established over night need to hold.
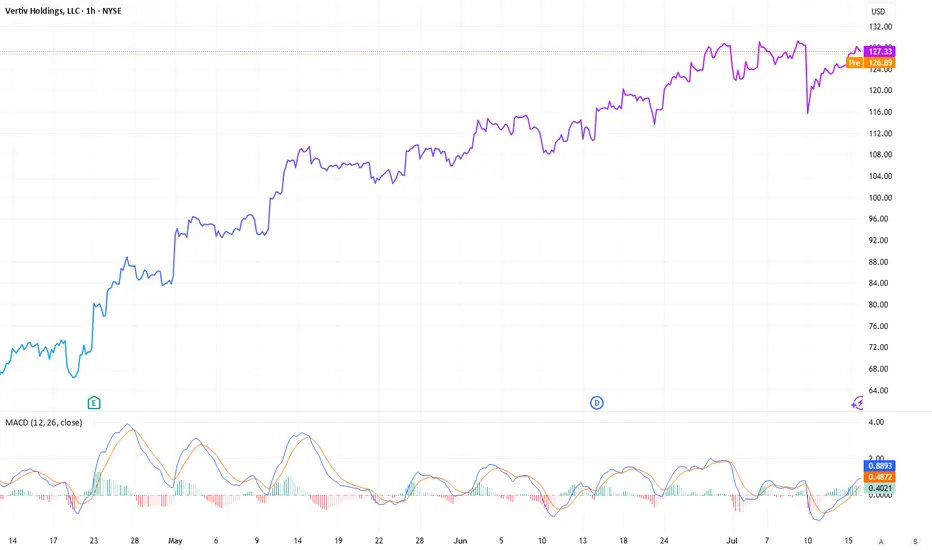
Vertiv Holdings: Powering the AI ProgressionNYSE:VRT NASDAQ:NVDA NASDAQ:META NYSE:ETN NASDAQ:CEG
While investors are engaged in a race “identify the next major microchip manufacturer”, a quieter opportunity is emerging at the crossroads of artificial intelligence (AI), infrastructure, and long-term demand. Vertiv Holdings (VRT), a company often overlooked amidst the hype, could be the backbone of the AI boom. In a recent NVIDIA earnings call, CEO Jensen Huang dropped a pretty interesting statement: the biggest hurdle for future data centers isn’t chips or regulations- it’s power.
The Power and Cooling Conundrum
AI is no longer some futuristic bet, it’s more like the engine of modern enterprise. Data centers, once powered by modest CPUs, now rely on NVIDIA’s superior GPUs to handle complex, multi-task workloads at scale. But this shift has exposed a critical bottleneck: energy supply can’t keep up with compute demand. Think of NVIDIA’s GPUs as high-performance supercars-powerful yet fuel-hungry, requiring premium infrastructure to operate efficiently. Data centers face challenges like high carbon footprints, downtime risks (recall the $10 billion CrowdStrike outage from a faulty software update), and intense cooling needs due to soaring rack densities.
And this is where Vertiv (VRT) comes in. This company designs and delivers essential infrastructure-uninterruptible power supplies, power distribution units, and advanced cooling solutions (both air and liquid-based)-tailored for data centers, telecom, and industrial clients. If NVIDIA’s GPUs are the brain, Vertiv is the heart and lungs, ensuring these systems run without melting down. The cooling challenge, in particular, is a game-changer. With rack densities exceeding 300kW, traditional air cooling falls short, making Vertiv’s liquid cooling innovations a must-have.
A Strategic Edge: The META-Nuclear Play
The AI race isn’t just about chips- it’s also about the infrastructure to sustain them. A telling sign came from META, which recently inked a nuclear power deal with Constellation Energy. Why nuclear? It offers low-carbon, reliable, 24/7 power with massive capacity-ideal for AI’s energy demands. Yet, Constellation’s deal didn’t address cooling, a gap Vertiv fills perfectly. This collaboration points a broader trend: companies are scrambling to solve power and thermal management issues, and Vertiv is at the forefront of this effort.
Financial Momentum and Analyst Backing
Vertiv’s financials back up its strategic importance. In Q1 2025, the company reported $2.04 billion in revenue-a 25% year-over-year jump, surpassing the $1.94 billion estimate. Adjusted earnings per share hit $0.64, beating the $0.615 forecast. Its backlog soared 50% to $6 billion, signaling robust future demand, while free cash flow margins doubled to 13% ($1.48 billion). Earnings before interest, taxes, depreciation, and amortization grew 22.8%, with a manageable 1.6x leverage ratio and over $350 million annually invested in R&D-much of it for cutting-edge liquid cooling.
Looking ahead, analysts project revenue of $10.76 billion by 2026, with EPS growth of 22% annually and free cash flow reaching $1.6 billion, even as capital expenditure rises to 18.2%. The sentiment is overwhelmingly bullish: Bank of America, Goldman Sachs, and Barclays maintain "Buy" ratings, with target prices ranging from $115 to $130. Oppenheimer, a top analyst, recently raised its target to $132, while 75% of analysts recommend buying, with only 6.3% suggesting a hold or sell.
Outpacing the Market
Since its liberation date of April 2, Vertiv has outperformed its peers. While the S&P 500 grew 11.48%, NVIDIA rose 45.62%, Eaton Corporation 30.26%, and Constellation Energy 48.3%, Vertiv surged 69.8%. Its focus on data centers and AI-driven infrastructure is reflected in this outperformance, with even uranium ETFs (42.41%) tied to nuclear power trends being outpaced. Vertiv’s faster free cash flow growth and direct exposure to AI’s power and cooling bottlenecks give it an edge over cyclical chipmakers.
A Long-Term Buy?
The thesis is simple: AI is already here and it will stay, and the infrastructure supporting it-especially cooling- is important factor in ensuring the rotation of the gears. Vertiv is quietly becoming, lets say, the NVIDIA of infrastructure, leveraging strong financials, analyst confidence, and a critical role in solving AI’s energy crisis. At a current price of $127.37, with targets up to $132 within the next 18 months (and potentially higher over 2-3 years), VRT could be a pretty confident long-term buy. Unlike chipmakers facing valuation risks, Vertiv may offer stable growth tied to an urgent need, which one is growing today.
Disclosure: I currently hold no positions in VRT, NVIDIA, Eaton, or Constellation Energy.
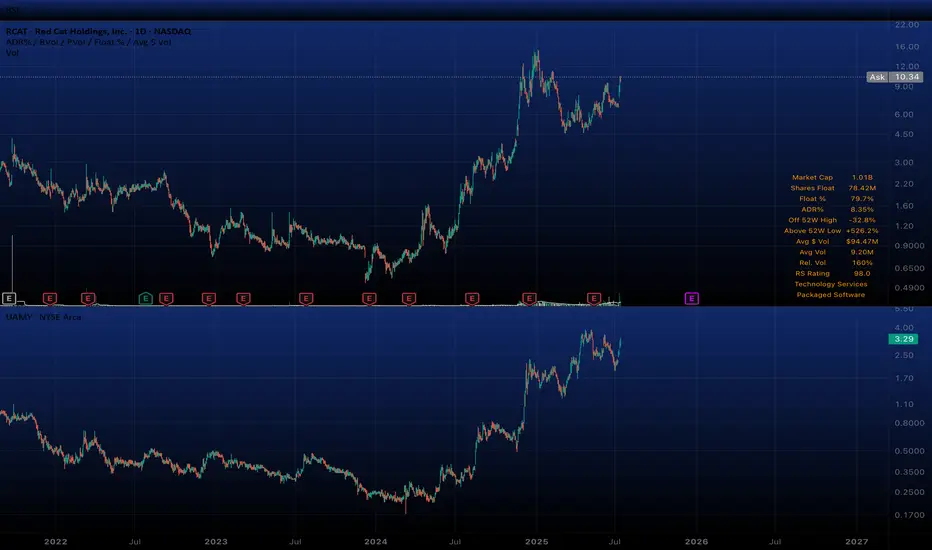
$RCAT $UAMY LONGNASDAQ:RCAT AMEX:UAMY
“If you’re good at something, never do it for free.”
AND one of the hardest you should learn things to judge is what level of risk is safe.
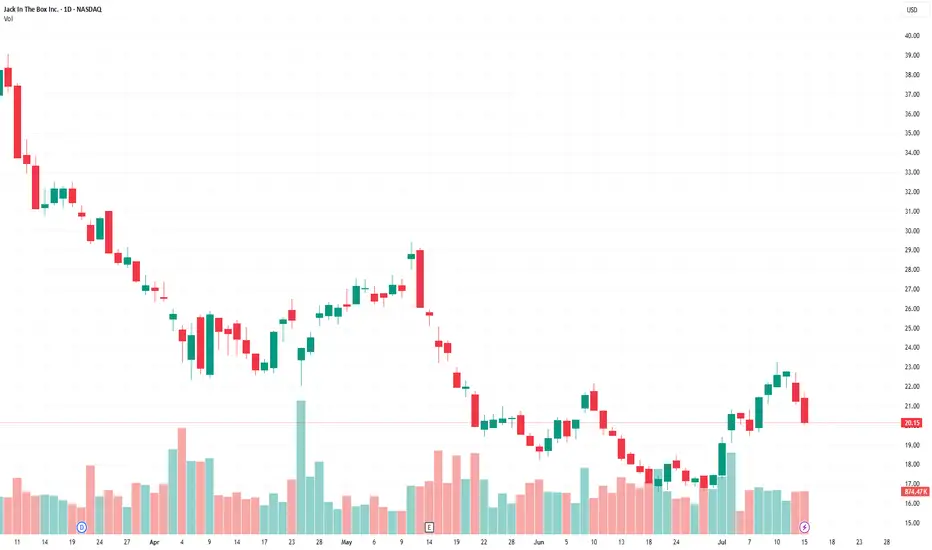
Jack in the Box (JACK)Consumer Discretionary - Restaurants
Buy the dip: strategic plan, a number of shorts and the institutional interest.
Supporting Arguments
Strategic transformation program.
Large number of shorts and high dividend yield.
Interest of a large investor.
Jack in the Box, Inc. (NASDAQ: (JACK) operates of two chains of quick-service and fast-casual restaurants, with a total number of 2,600. The Jack in the Box segment offers a classic burgers. The Del Taco segment focuses on both Mexican and American. The company was founded in 1951 and is headquartered in San Diego, CA.
Investment Thesis
Strategic transformation plan. The company grew its revenue at a double-digit rate in 2021–2023, but since last year, revenue has been declining. The debt burden has begun to grow and has reached a critical level of more than $1.7 billion, or 5.1x LTM EBITDA. Amid the problems, the CEO resigned.
The company announced a restructuring plan, which includes closing 150–200 unprofitable restaurants, and selling the Del Taco chain entirely to reduce debt by $300 million is not ruled out. It is also planned to increase online sales from the current 12.5% to 25%. The EBITDA margin of the online segment is planned to increase to 15%.
A large number of short positions and a dividend. Short interest is 4.48 million shares, or about 25% of shares in free float and 5 average daily trading volumes. Closing the short may lead to a strong short-term increase in quotes. The dividend yield is about 6%, however, due to the need to save, it cannot be ruled out that the company will cut the dividend in the near future.
The interest of a large investor. The company's capitalization is $420 million, it has not been so cheap since the COVID-19 pandemic, and before that in the early 2010s. Quotes have fallen almost 5 times from the maximum, which creates a good opportunity for a takeover by a large player. The Biglari Capital Corp. fund, which controls almost 10%, has already taken advantage of the stock correction and intends to increase its share. However, the Board of Directors is currently taking measures to counter a hostile takeover, hoping to cope with the crisis on its own.
We recommend to BUY a JACK shares with the target price of $935, which implies a 60 upside. To mitigate potential losses, it is advised to implement a stop-loss at $16.90.