Is the BullRun over? I don't think so. $TSLAYesterday we saw a somewhat heavy fall in Indexes, and it probably scared alot of retail Bulls outs.
However, it seems we've fallen straight into potential medium term supports across multiple stocks in the markets.
I'm convinced we will get a good economic data print today.
This would open the door to new ATHs, again, in the Indexes.
For this to play out, the local bottoms established over night need to hold.
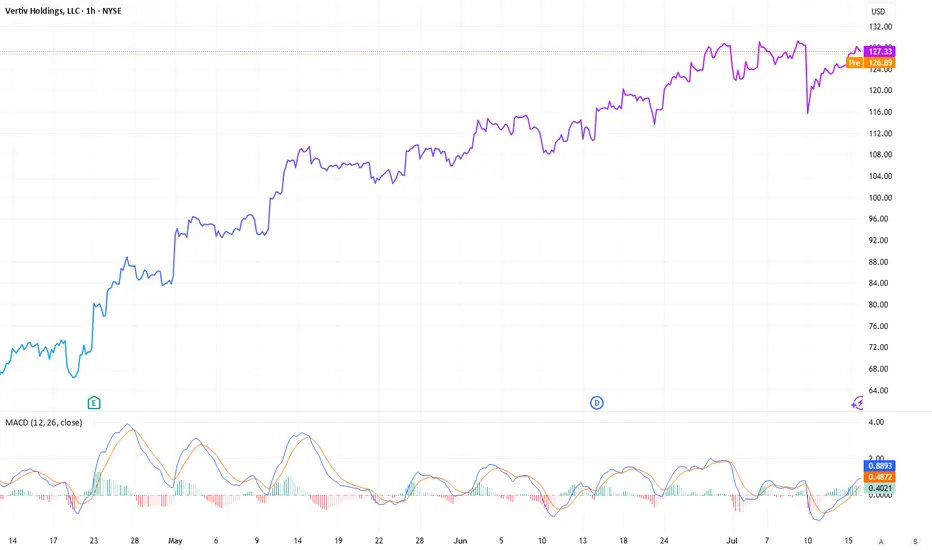
Vertiv Holdings: Powering the AI ProgressionNYSE:VRT NASDAQ:NVDA NASDAQ:META NYSE:ETN NASDAQ:CEG
While investors are engaged in a race “identify the next major microchip manufacturer”, a quieter opportunity is emerging at the crossroads of artificial intelligence (AI), infrastructure, and long-term demand. Vertiv Holdings (VRT), a company often overlooked amidst the hype, could be the backbone of the AI boom. In a recent NVIDIA earnings call, CEO Jensen Huang dropped a pretty interesting statement: the biggest hurdle for future data centers isn’t chips or regulations- it’s power.
The Power and Cooling Conundrum
AI is no longer some futuristic bet, it’s more like the engine of modern enterprise. Data centers, once powered by modest CPUs, now rely on NVIDIA’s superior GPUs to handle complex, multi-task workloads at scale. But this shift has exposed a critical bottleneck: energy supply can’t keep up with compute demand. Think of NVIDIA’s GPUs as high-performance supercars-powerful yet fuel-hungry, requiring premium infrastructure to operate efficiently. Data centers face challenges like high carbon footprints, downtime risks (recall the $10 billion CrowdStrike outage from a faulty software update), and intense cooling needs due to soaring rack densities.
And this is where Vertiv (VRT) comes in. This company designs and delivers essential infrastructure-uninterruptible power supplies, power distribution units, and advanced cooling solutions (both air and liquid-based)-tailored for data centers, telecom, and industrial clients. If NVIDIA’s GPUs are the brain, Vertiv is the heart and lungs, ensuring these systems run without melting down. The cooling challenge, in particular, is a game-changer. With rack densities exceeding 300kW, traditional air cooling falls short, making Vertiv’s liquid cooling innovations a must-have.
A Strategic Edge: The META-Nuclear Play
The AI race isn’t just about chips- it’s also about the infrastructure to sustain them. A telling sign came from META, which recently inked a nuclear power deal with Constellation Energy. Why nuclear? It offers low-carbon, reliable, 24/7 power with massive capacity-ideal for AI’s energy demands. Yet, Constellation’s deal didn’t address cooling, a gap Vertiv fills perfectly. This collaboration points a broader trend: companies are scrambling to solve power and thermal management issues, and Vertiv is at the forefront of this effort.
Financial Momentum and Analyst Backing
Vertiv’s financials back up its strategic importance. In Q1 2025, the company reported $2.04 billion in revenue-a 25% year-over-year jump, surpassing the $1.94 billion estimate. Adjusted earnings per share hit $0.64, beating the $0.615 forecast. Its backlog soared 50% to $6 billion, signaling robust future demand, while free cash flow margins doubled to 13% ($1.48 billion). Earnings before interest, taxes, depreciation, and amortization grew 22.8%, with a manageable 1.6x leverage ratio and over $350 million annually invested in R&D-much of it for cutting-edge liquid cooling.
Looking ahead, analysts project revenue of $10.76 billion by 2026, with EPS growth of 22% annually and free cash flow reaching $1.6 billion, even as capital expenditure rises to 18.2%. The sentiment is overwhelmingly bullish: Bank of America, Goldman Sachs, and Barclays maintain "Buy" ratings, with target prices ranging from $115 to $130. Oppenheimer, a top analyst, recently raised its target to $132, while 75% of analysts recommend buying, with only 6.3% suggesting a hold or sell.
Outpacing the Market
Since its liberation date of April 2, Vertiv has outperformed its peers. While the S&P 500 grew 11.48%, NVIDIA rose 45.62%, Eaton Corporation 30.26%, and Constellation Energy 48.3%, Vertiv surged 69.8%. Its focus on data centers and AI-driven infrastructure is reflected in this outperformance, with even uranium ETFs (42.41%) tied to nuclear power trends being outpaced. Vertiv’s faster free cash flow growth and direct exposure to AI’s power and cooling bottlenecks give it an edge over cyclical chipmakers.
A Long-Term Buy?
The thesis is simple: AI is already here and it will stay, and the infrastructure supporting it-especially cooling- is important factor in ensuring the rotation of the gears. Vertiv is quietly becoming, lets say, the NVIDIA of infrastructure, leveraging strong financials, analyst confidence, and a critical role in solving AI’s energy crisis. At a current price of $127.37, with targets up to $132 within the next 18 months (and potentially higher over 2-3 years), VRT could be a pretty confident long-term buy. Unlike chipmakers facing valuation risks, Vertiv may offer stable growth tied to an urgent need, which one is growing today.
Disclosure: I currently hold no positions in VRT, NVIDIA, Eaton, or Constellation Energy.
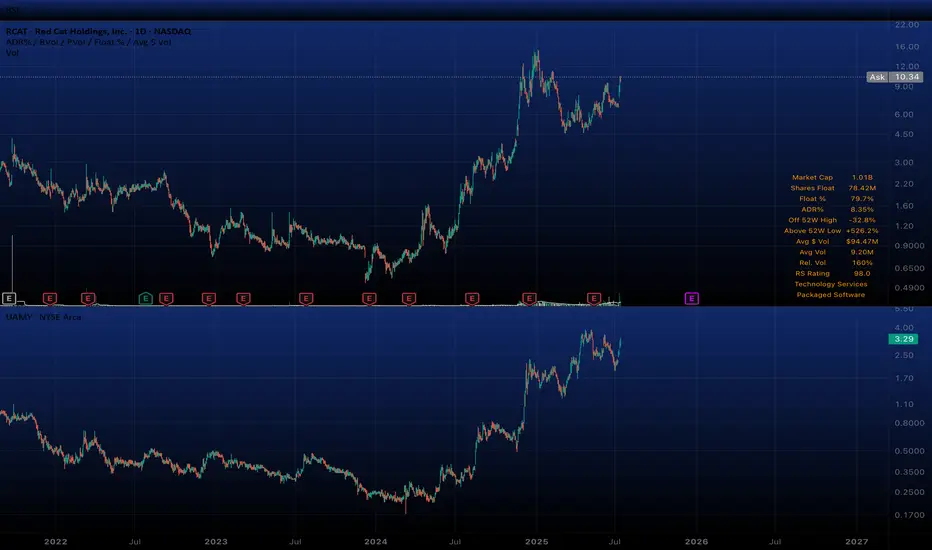
$RCAT $UAMY LONGNASDAQ:RCAT AMEX:UAMY
“If you’re good at something, never do it for free.”
AND one of the hardest you should learn things to judge is what level of risk is safe.
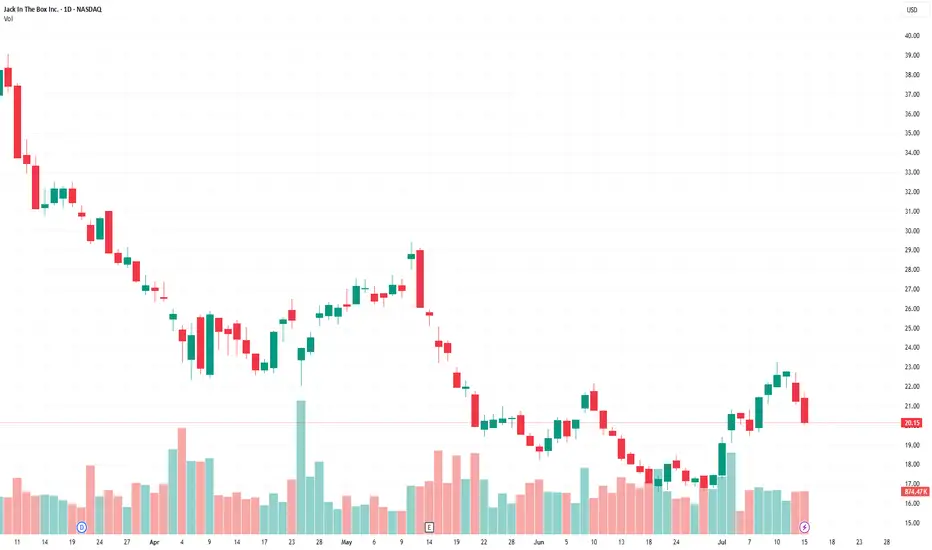
Jack in the Box (JACK)Consumer Discretionary - Restaurants
Buy the dip: strategic plan, a number of shorts and the institutional interest.
Supporting Arguments
Strategic transformation program.
Large number of shorts and high dividend yield.
Interest of a large investor.
Jack in the Box, Inc. (NASDAQ: (JACK) operates of two chains of quick-service and fast-casual restaurants, with a total number of 2,600. The Jack in the Box segment offers a classic burgers. The Del Taco segment focuses on both Mexican and American. The company was founded in 1951 and is headquartered in San Diego, CA.
Investment Thesis
Strategic transformation plan. The company grew its revenue at a double-digit rate in 2021–2023, but since last year, revenue has been declining. The debt burden has begun to grow and has reached a critical level of more than $1.7 billion, or 5.1x LTM EBITDA. Amid the problems, the CEO resigned.
The company announced a restructuring plan, which includes closing 150–200 unprofitable restaurants, and selling the Del Taco chain entirely to reduce debt by $300 million is not ruled out. It is also planned to increase online sales from the current 12.5% to 25%. The EBITDA margin of the online segment is planned to increase to 15%.
A large number of short positions and a dividend. Short interest is 4.48 million shares, or about 25% of shares in free float and 5 average daily trading volumes. Closing the short may lead to a strong short-term increase in quotes. The dividend yield is about 6%, however, due to the need to save, it cannot be ruled out that the company will cut the dividend in the near future.
The interest of a large investor. The company's capitalization is $420 million, it has not been so cheap since the COVID-19 pandemic, and before that in the early 2010s. Quotes have fallen almost 5 times from the maximum, which creates a good opportunity for a takeover by a large player. The Biglari Capital Corp. fund, which controls almost 10%, has already taken advantage of the stock correction and intends to increase its share. However, the Board of Directors is currently taking measures to counter a hostile takeover, hoping to cope with the crisis on its own.
We recommend to BUY a JACK shares with the target price of $935, which implies a 60 upside. To mitigate potential losses, it is advised to implement a stop-loss at $16.90.
The Case for Solar Tracker Infrastructure (NXT) NASDAQ:NXT
THE CONCEPT
Superficially, the solar infrastructure sector appears to be just another subset of the cyclical renewable energy market, heavily influenced by commodity pricing, subsidies, and Chinese overcapacity. This view, while partially accurate, overlooks a deeper dynamic now unfolding in the utility-scale solar ecosystem: the emergence of solar trackers, specifically Nextracker (NXT), as a default layer of infrastructure that enhances energy yield, drives project economics, and becomes essential to capturing IRR in large-scale solar development.
The true attraction of companies like NXT lies not in their participation in the solar value chain but in their ability to compound earnings by becoming the default standard in project infrastructure. As utility developers increasingly seek higher ROI and shorter time-to-completion, tracker systems with proven yield enhancements and robust reliability are becoming indispensable. What began as a technological upgrade is now evolving into an infrastructure platform with software-defined margins, long product lifecycles, and embedded switching costs.
If this dynamic is recognized by investors, NXT may undergo a valuation re-rating, as happened with other asset-light infrastructure providers in the past. The process is potentially self-reinforcing: tracker adoption increases → project IRRs improve → developers standardize on proven providers → NXT backlog and margins grow → investor recognition expands → valuation multiple rises → NXT scales further, increasing its data advantage and competitive moat.
ANALYTICAL APPROACH
The conventional method of evaluating solar-linked equities—projecting demand growth for solar installations and then applying a valuation multiple based on cyclical earnings—is insufficient in this case. NXT’s trajectory is not merely a function of solar penetration; it depends critically on its ability to convert adoption into infrastructure entrenchment. The valuation multiple itself reflects investor understanding of this transition.
Instead of isolating earnings and then applying an arbitrary multiple, we analyze the self-reinforcing process of tracker adoption, profitability, and recognition. We identify three interlocking drivers:
The effective return on solar projects equipped with tracker systems
The penetration rate of trackers in utility-scale solar globally
Investor recognition of NXT as a long-term infrastructure platform rather than a cyclical solar component supplier
THE SCENARIO
Act One: The Emergence of the Infra Layer (2023–2025)
At present, the effective return on utility-scale solar projects is entering a new phase. While panel prices continue to decline due to Chinese oversupply (falling below $0.16/W in the U.S.), project economics are improving due to two compounding forces: rising electricity demand (particularly from AI, EVs, and data centers) and software-enhanced yield optimization from tracker platforms.
NXT's tracker systems, enhanced by machine-learning algorithms like TrueCapture, are capable of increasing energy yield by 15–25%, a material change in IRR for developers. Meanwhile, the total cost of tracker systems has declined enough to reach mass adoption thresholds, especially in markets like the U.S., where NXT holds a 57% share. Tracker usage in new U.S. projects now exceeds 95%, while global adoption is climbing from 40–45%.
Investor recognition is still partial; NXT trades at ~15x earnings despite 30% EPS growth and a $4.5B backlog. The process has just begun, but the initial indicators of self-reinforcing dynamics are visible.
Act Two: Recognition and Rerating (2025–2027)
As demand for electricity continues to grow and renewable installations scale with it, tracker systems become default components in new builds. Developers now see tracker-equipped plants as the norm, not an upgrade. Projects from 2025 onward increasingly retroactively upgrade from fixed-mount systems.
Investors begin to grasp the role of NXT as a high-margin infrastructure provider. The shift in narrative—from cyclical solar to embedded utility infrastructure—leads to a re-rating. Price-to-earnings multiples begin to reflect platform-like characteristics: recurring software revenue, long product cycles, data network effects, and entrenched customer relationships. The company’s moat, built on both hardware reliability (30-year durability) and proprietary software trained on years of operational solar data, becomes widely recognized.
Investor multiples compress slightly to reflect maturity but remain above historical solar averages due to sticky revenue, data leverage, and infrastructure resilience.
EVALUATION
The shakeout is still years away. Until then, NXT is positioned to benefit from a global shift in energy infrastructure. The real risk at present is not from saturation but from investor miscategorization. If NXT continues to be treated as a cyclical solar stock, it may remain undervalued despite strong fundamentals and compelling growth.
The key vulnerability lies in the macro environment. Should global renewable demand stall due to policy reversals (e.g., rollback of IRA credits), or should Chinese entrants successfully replicate NXT’s software and reliability at scale, the thesis may weaken. However, even in such cases, the cost structure of tracker-enhanced solar remains globally competitive, and NXT’s backlog and historical performance offer downside protection.
Yet, it must be acknowledged that current market sentiment favors nuclear-related equities, driven by political narratives of energy security and bipartisan support for nuclear expansion. Nuclear stocks are being re-rated on the expectation of long-term baseload reliability, even though their LCOE remains higher and their construction timelines are far longer than utility-scale solar. This sentiment bias may delay investor recognition of NXT’s strategic role as an infrastructure platform.
If the self-reinforcing process plays out as expected, NXT could deliver the compound benefits of scale, margin expansion, and multiple re-rating. The capital appreciation potential mirrors the early phases of other infrastructure transitions—cable, fiber, datacenter REITs—where early recognition translated into multiyear equity outperformance.
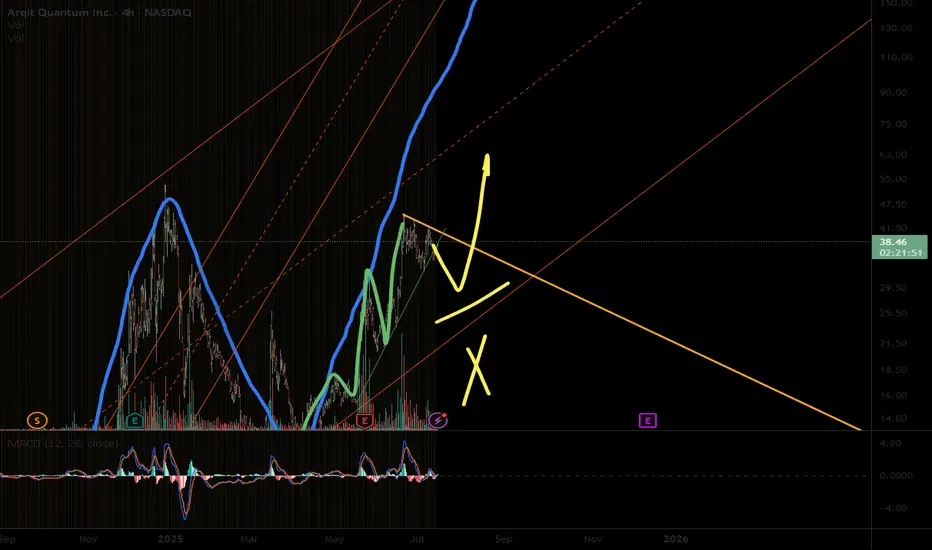
ARQQ setup of mine3 impulses form first bigger,
now the pull back is considered.
Global weakness meets the pullback,
none of first waves cut the prev high,
only second let to pass by,
bottom channel might get nagged
If we make it we will strive,
but only to the (chan) half,
then I see a good bye, not buy.
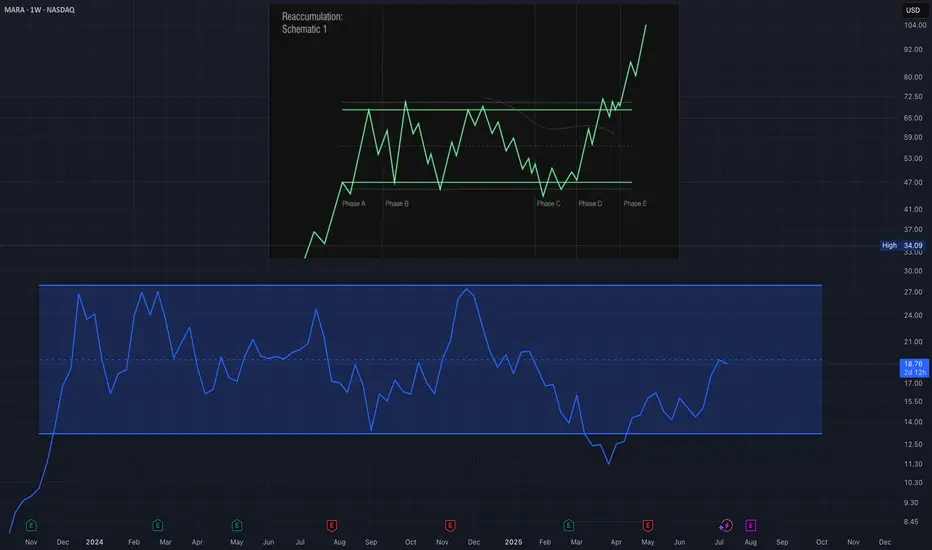
MARA Showing Classic Wyckoff Reaccumulation SetupI’m currently observing what appears to be a Wyckoff Reaccumulation Schematic developing in MARA (Marathon Digital Holdings). After a significant decline, the price seems to have found a floor with a clear Selling Climax (SC), followed by an Automatic Rally (AR) that established the upper boundary of the trading range. The price action since then has remained largely within this range, showing multiple Secondary Tests (ST) that confirm both support and resistance levels. The structure and volume behavior suggest that MARA is likely in Phase C of the Wyckoff reaccumulation process, where we typically anticipate a spring or shakeout to test supply before the next leg higher. If the schematic continues to unfold according to the Wyckoff method, we could see signs of Phase D soon, which would involve a successful test of the spring and a rally back toward resistance with increasing demand. This would set the stage for a potential breakout, marking the beginning of Phase E. I’m closely watching price behavior near the lower range, along with volume confirmation, to validate this scenario. While the structure is still developing, the current formation is consistent with historical reaccumulation patterns seen prior to bullish continuations.
Before the Judge: Turmoil in Silicon ValleyIon Jauregui – Analyst at ActivTrades
Zuckerberg Takes the Stand
This week, Mark Zuckerberg appears as a witness in a civil lawsuit worth $8 billion, in which the governance of Meta Platforms (NASDAQ: META) is under scrutiny following the well-known Cambridge Analytica scandal. The plaintiffs — shareholders of the company — argue that decisions were made without proper board oversight, directly affecting the company’s value and corporate governance.
The trial also implicates other high-profile figures, including former executive Sheryl Sandberg, investor Marc Andreessen, Palantir Technologies (NYSE: PLTR) co-founder Peter Thiel, and former Netflix (NASDAQ: NFLX) chairman Reed Hastings. The central question is whether Meta’s board exercised independent and effective oversight in handling the crisis.
Temasek Reshapes Its Strategy in India
Singapore’s sovereign wealth fund, Temasek, has announced a shift in its investment strategy: fewer deals, but with higher concentration and larger individual commitments. Its current exposure in India exceeds $50 billion, and the fund believes the local market has matured enough to allow for easier entry and exit of capital.
Companies that could attract attention include major players such as Reliance Industries (NSE: RELIANCE) and Tata Consultancy Services (NSE: TCS)—key actors in sectors like technology, telecommunications, and financial services. Temasek values not only India’s economic growth, but also the opportunities for scalability and sector diversification.
Banking Sector Eyes Mergers
In the financial sector, Northern Trust (NASDAQ: NTRS) has drawn market attention amid speculation of a possible approach by BNY Mellon (NYSE: BK). A more flexible regulatory framework from the Federal Reserve has rekindled interest in M&A activity across the U.S. banking industry.
Major banks such as JPMorgan Chase (NYSE: JPM), Bank of America (NYSE: BAC), and Goldman Sachs (NYSE: GS) are closely monitoring the landscape, while regional players like PNC (NYSE: PNC), U.S. Bancorp (NYSE: USB), and Truist (NYSE: TFC) could also engage in strategic transactions aimed at improving efficiency and increasing market share.
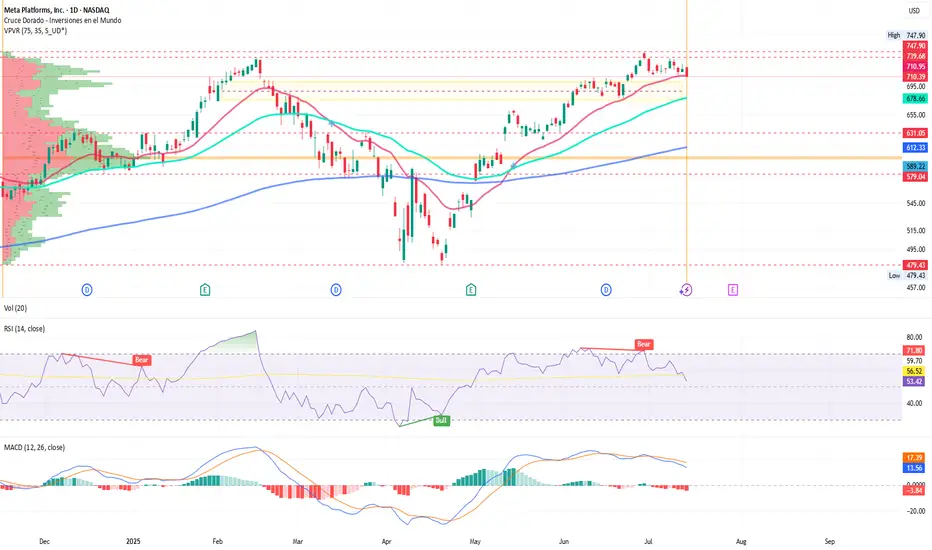
META in Focus: Technical Analysis
After reaching all-time highs in June near $747.90, Meta Platforms shares have slightly corrected, entering a consolidation phase around the 50-day moving average, which now acts as a key technical support level.
From a technical standpoint:
The price remains above the 50-day moving average since the golden cross in May, preserving the medium-term bullish structure.
The RSI stands at 53.42%, indicating a consolidation phase with no clear overbought or oversold signals.
Immediate support: $688 (100-day moving average)
Key support: $631, just above the point of control around $600
MACD: indicates short-term bearish pressure
Resistance: recent highs suggest a potential double top
A breakdown below the current support area could increase downside pressure, while a breakout above the all-time high, supported by volume, would resume the bullish trend toward new highs. The ongoing trial may bring short-term volatility, although much of the reputational risk appears to have been priced in by the market. Over the long term, investors continue to assess Meta’s strategic positioning in artificial intelligence, digital advertising, and virtual reality.
Conclusion
Silicon Valley is navigating a phase of heightened scrutiny—both in courtrooms and financial markets. As tech companies adjust their strategies and international funds recalibrate their positions, sectors like banking are preparing for potential consolidation. In this context, regulatory risk, governance, and strategic efficiency will remain key drivers in the performance of major U.S. corporations in the coming quarters.
*******************************************************************************************
The information provided does not constitute investment research. The material has not been prepared in accordance with the legal requirements designed to promote the independence of investment research and such should be considered a marketing communication.
All information has been prepared by ActivTrades ("AT"). The information does not contain a record of AT's prices, or an offer of or solicitation for a transaction in any financial instrument. No representation or warranty is given as to the accuracy or completeness of this information.
Any material provided does not have regard to the specific investment objective and financial situation of any person who may receive it. Past performance and forecasting are not a synonym of a reliable indicator of future performance. AT provides an execution-only service. Consequently, any person acting on the information provided does so at their own risk. Political risk is unpredictable. Central bank actions can vary. Platform tools do not guarantee success.
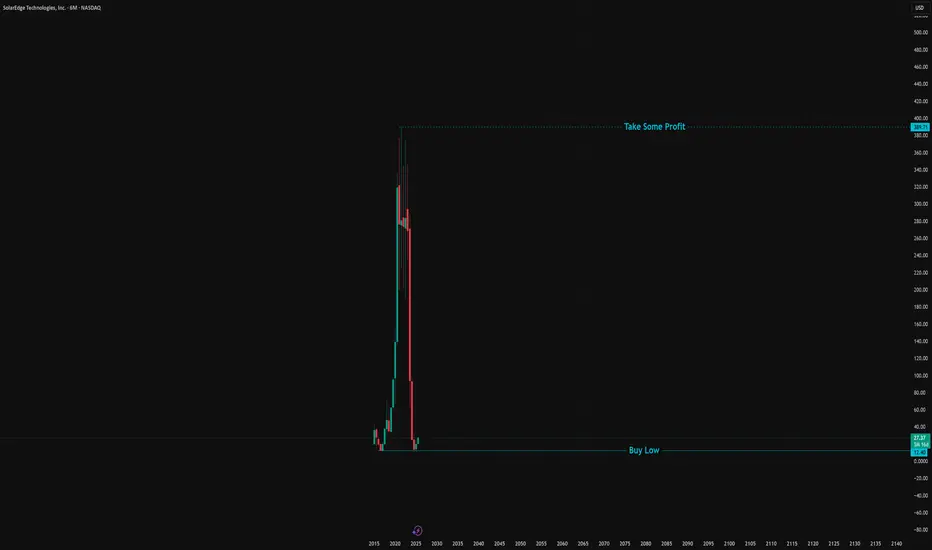
SolarI randomly scrolled through the list of stock selections here at Tradingview and lo' and behold I found a gem. This gem was buried as if by a pirate and I have unearthed it. Just look at it! Now it can function as it was made to. A proper find indeed. Stay tuned!
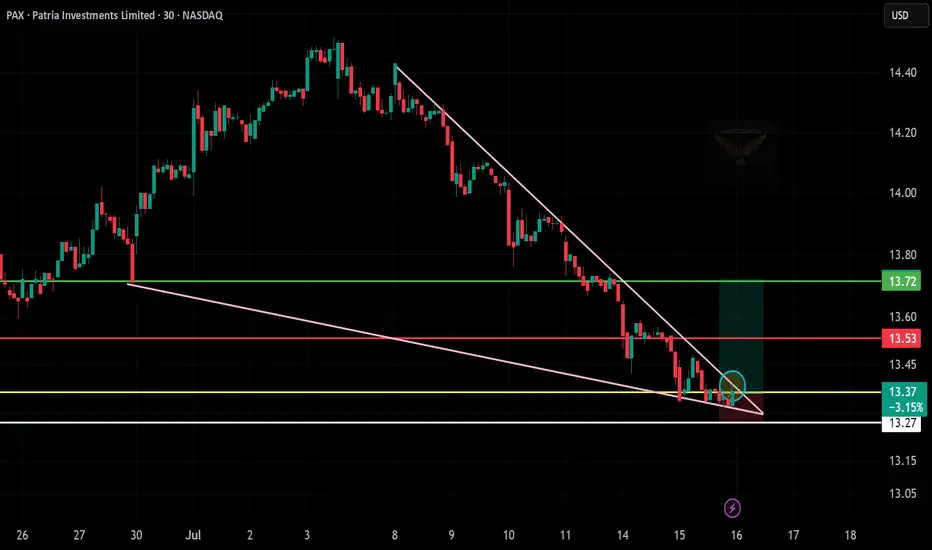
PAX Falling Wedge Breakout – Long Trade Setup
🧠 Chart Analysis Summary:
Pattern: Falling wedge breakout spotted — a classic bullish reversal pattern.
Current Price: $13.37
Support Zone:
$13.27 (white line, holding support)
Breakout Confirmation: Price is pushing out of the wedge with a small green move (circle).
📊 Key Levels:
Entry Zone: $13.35–$13.40
Target 1: $13.53 (red line – short-term resistance)
Target 2: $13.72 (green line – wedge target zone)
Stop-Loss: Below $13.25
🎯 Trade Idea (Bullish Bias):
Entry: $13.35–13.40
Target: $13.72
Stop-Loss: $13.25
WAY Bearish Breakdown – Eyes on $36.79
🧠 Chart Analysis Summary:
Pattern: Breakdown from a symmetrical triangle (pink lines), signaling bearish pressure.
Current Price: $37.96
Breakdown Confirmation: Price broke triangle support with bearish follow-through.
Resistance Zone:
Immediate Resistance: $38.40 (white line)
Support Levels:
First: $37.38 (red line)
Final Target: $36.79 (green zone)
🎯 Trade Idea (Short Bias):
Entry: $37.90–38.00 (after breakdown confirmation)
Target: $36.80
Stop-Loss: Above $38.50

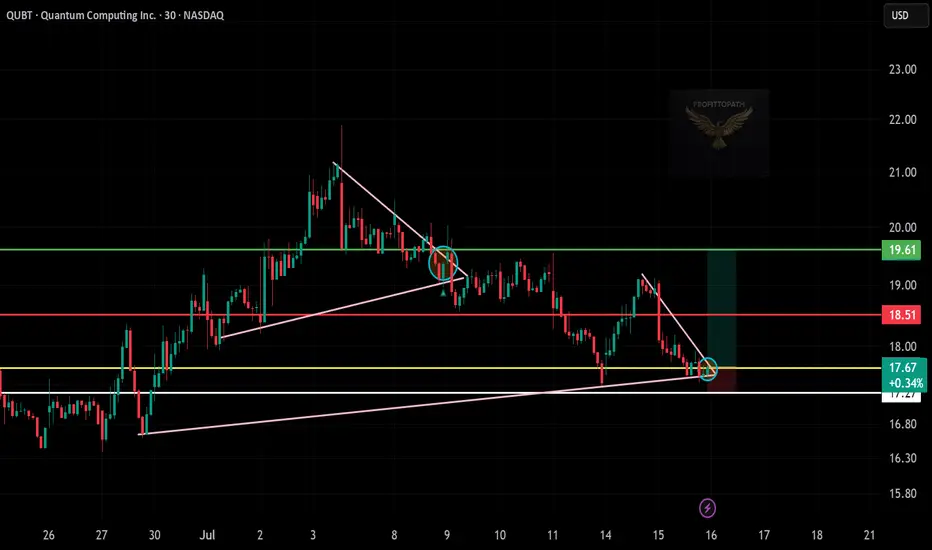
QUBT Bounces Off Trendline – Long Setup!
🧠 Chart Analysis Summary:
Setup: QUBT bounced off a long-term ascending trendline (pink), with potential reversal from support.
Current Price: $17.67
Breakout Zone: A breakout from the small falling wedge/pennant pattern appears underway.
Support Zone: Around $17.25–17.50 (white/yellow lines)
Target Zone:
First Target: $18.51 (red line)
Final Target: $19.61 (green line)
🎯 Trade Idea (Long Position):
Entry: $17.60–$17.75 (post-wedge breakout)
Target 1: $18.50
Target 2: $19.60
Stop-Loss: Below $17.20 (trendline support break)
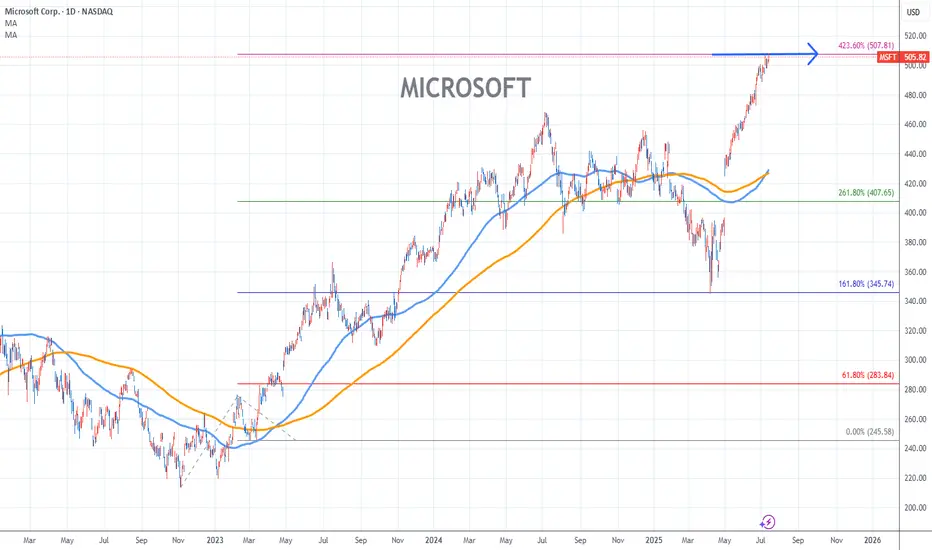
MICROSOFT Stock Chart Fibonacci Analysis 071525Trading idea - Hit the top > 507/423.60%
Chart time frame:D
A) 15 min(1W-3M)
B) 1 hr(3M-6M)
C) 4 hr(6M-1year)
D) 1 day(1-3years)
Stock progress:E
A) Keep rising over 61.80% resistance
B) 61.80% resistance
C) 61.80% support
D) Hit the bottom
E) Hit the top
Stocks rise as they rise from support and fall from resistance. Our goal is to find a low support point and enter. It can be referred to as buying at the pullback point. The pullback point can be found with a Fibonacci extension of 61.80%. This is a step to find entry level. 1) Find a triangle (Fibonacci Speed Fan Line) that connects the high (resistance) and low (support) points of the stock in progress, where it is continuously expressed as a Slingshot, 2) and create a Fibonacci extension level for the first rising wave from the start point of slingshot pattern.
When the current price goes over 61.80% level , that can be a good entry point, especially if the SMA 100 and 200 curves are gathered together at 61.80%, it is a very good entry point.
As a great help, tradingview provides these Fibonacci speed fan lines and extension levels with ease. So if you use the Fibonacci fan line, the extension level, and the SMA 100/200 curve well, you can find an entry point for the stock market. At least you have to enter at this low point to avoid trading failure, and if you are skilled at entering this low point, with fibonacci6180 technique, your reading skill to chart will be greatly improved.
If you want to do day trading, please set the time frame to 5 minutes or 15 minutes, and you will see many of the low point of rising stocks.
If want to prefer long term range trading, you can set the time frame to 1 hr or 1 day.
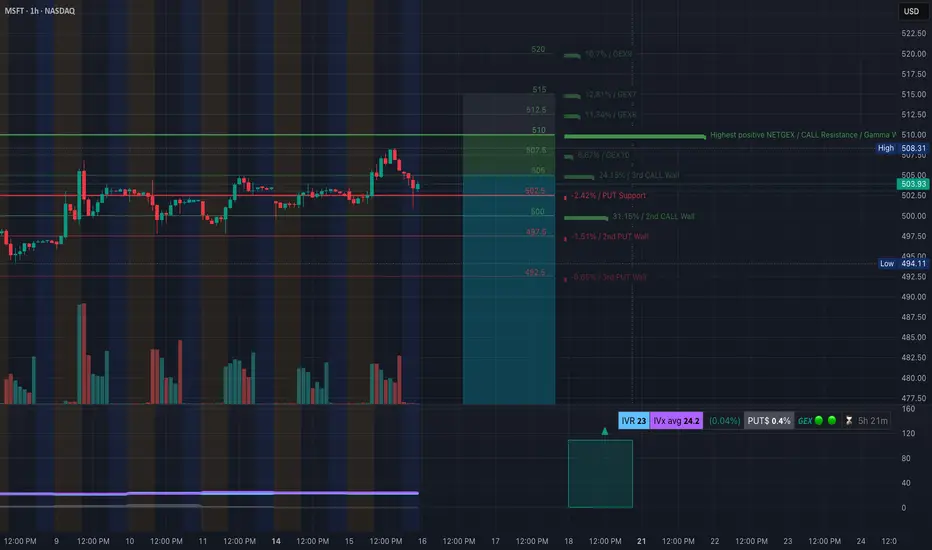
MSFT Setting Up for a Breakdown or Bounce - July 16MSFT Setting Up for a Breakdown or Bounce – Key Option Levels in Play 💥
🔹 Options GEX Analysis (Tanuki GEX View):
* Gamma Resistance (Call Wall):
→ $510 is the highest GEX level, acting as a ceiling.
→ $507.5 is the 3rd Call Wall and minor resistance.
* PUT Walls and Gamma Support:
→ $502.5 = HVL (High Volume Level)
→ $500 = key strike with heavy Put interest
→ $497.5 and $492.5 = deeper support levels
* GEX Bias:
→ IVR = 23, IVx avg = 24.2
→ 0.4% Put Skew → Neutral bias with slight downside lean
→ If MSFT trades below $502.5, dealers may start to hedge short, increasing downside gamma pressure.
🟩 Option Trade Idea:
* Bearish Put Debit Spread:
Buy $505p / Sell $495p for next week
Entry near $503, looking for breakdown to $497.
* Neutral Fade:
Sell Call spread near $507.5–510 if price stays below $504 by open.
🔹 1-Hour Chart Trading Setup (Price Action):
* Structure:
MSFT printed a CHoCH after failing to break the $507 supply zone (order block).
Price lost trendline support and is testing $502 area again.
* Smart Money Concepts:
* BOS occurred into 506s before reversal
* CHoCH confirmed at $502
* Current price is consolidating just above $502. Break below signals weakness.
* Support Zones:
* 502.5 → 500 → 497.5
* Demand at 493–488
* Resistance Zones:
* 504.5 → 506.5 → 510
* Overhead OB rejection seen on last attempt
🟦 Intraday Trade Setup:
Bearish Breakdown Setup:
* Entry: Below $502
* Target: $497.5 → $493
* Stop-loss: $504.50
Reclaim & Squeeze Setup:
* Entry: If holds above $504.5
* Target: $507.5 → $510
* Stop-loss: $502
🧠 My Thoughts:
The failed breakout and CHoCH hint that MSFT may drift down unless it reclaims $504. With options GEX neutral-to-bearish and IV low, a fade toward 497.5–493 could be in play. However, if buyers step in at HVL $502.5 and flip the trendline, we may see a gamma squeeze attempt to $507–510.
This analysis is for educational purposes only and does not constitute financial advice. Always trade with a plan and proper risk management.
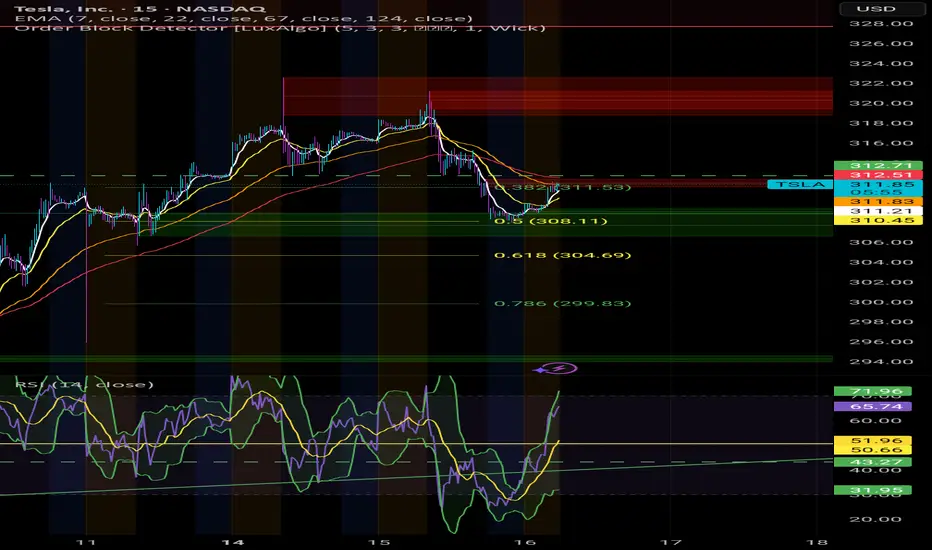
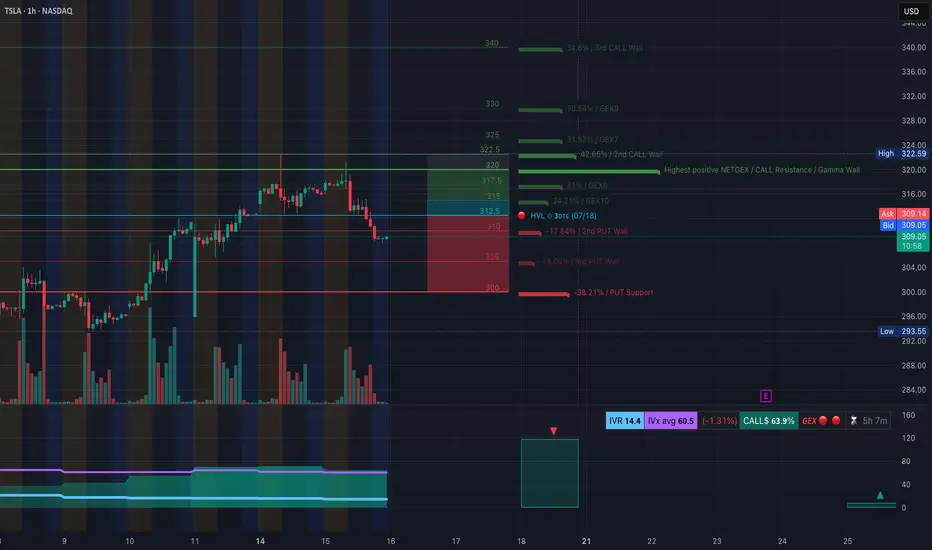
TSLA at a Turning Point. Gamma Flip + Price Breakdown? TAJuly 16🔍 GEX Analysis (Options Sentiment)
* Key Call Walls (Resistance):
* $322.5: +42.65% GEX — Major resistance and 2nd Call Wall
* $325 / $330: More overhead call resistance
* $317.5: Minor resistance
* Gamma Flip Zone (Highest Net GEX / Resistance):
* Around $320–322.5, price is likely to face supply pressure from dealers hedging short calls.
* PUT Walls (Support):
* $305: 2nd PUT Wall (−17.84% GEX)
* $300: PUT Support (−38.21% GEX)
* HVL (High Volume Level):
* $312.5: High-volume strike for this week’s expiration – significant battleground.
* IVR/Flow:
* IVR is 14.4 – low implied volatility.
* Call bias dominates: Calls 63.9% vs Puts.
* GEX sentiment = 🟥 Bearish leaning.
💡 Options Strategy Based on GEX
* Bearish Play:
* Buy 305P or 300P for short-term swing into the gamma void.
* Best risk:reward as dealers are likely to unwind positive gamma, accelerating downside toward PUT walls.
* Neutral-to-Bearish Strategy:
* Bear Call Spread around $317.5–$322.5 (above HVL, inside call wall congestion).
* Expect price rejection below $317.5 if no reclaim happens.
* Avoid CALLs unless price reclaims and holds above $317.5 with strong volume and momentum shift.
📈 1-Hour Chart Technical Analysis
* Structure:
* Bearish CHoCH and confirmed Break of Structure (BOS) below $310.
* Price dropped from the upper OB and failed retest confirms supply zone around $317–$321.
* Trendlines:
* Descending wedge forming with lower highs and current support at $307.97 and $305.
* Watch for bounce-to-fail retests at $312.5 or breakdown continuation.
* Zones to Watch:
* Bearish Order Block (OB): $316–$321 (purple zone) = Sell zone.
* Demand/Support Zone: $293–$296 (green box) – likely bounce zone.
📌 Trade Scenarios
* Bearish Intraday Trade Setup:
* Entry: Below $309 or retest rejection from $312.5
* Target: $305 → $300
* Stop: Above $313 or OB invalidation at $317.5
* Bullish Counterplay (Only if confirmed):
* Entry: Hold above $317.5
* Target: $322.5 → $325
* Stop: Break below $315
🎯 Final Thoughts
TSLA looks weak and in distribution after sweeping local highs. The current GEX map favors bearish continuation, and the 1H BOS confirms breakdown structure. Unless $317.5 is reclaimed, bears have the upper hand.
Disclaimer: This analysis is for educational purposes only and not financial advice. Always do your own research and manage risk before trading.
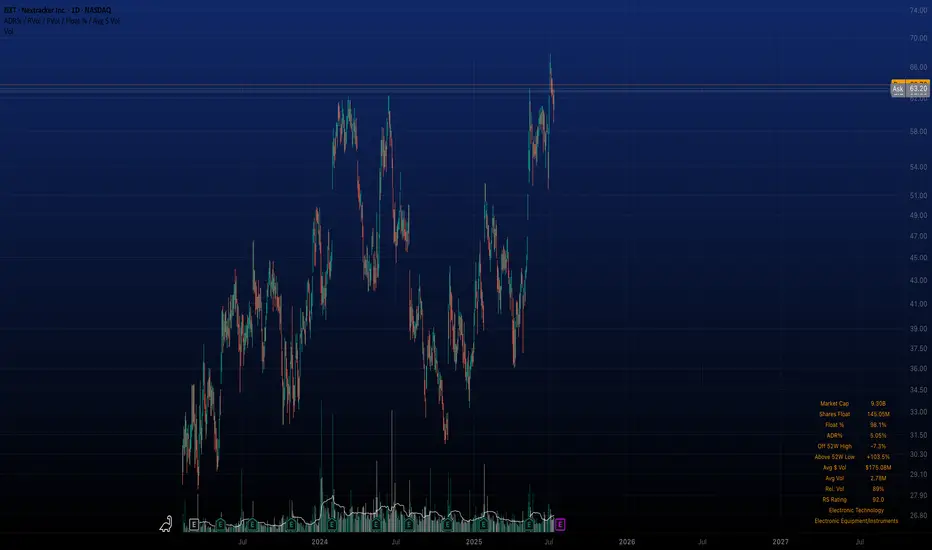
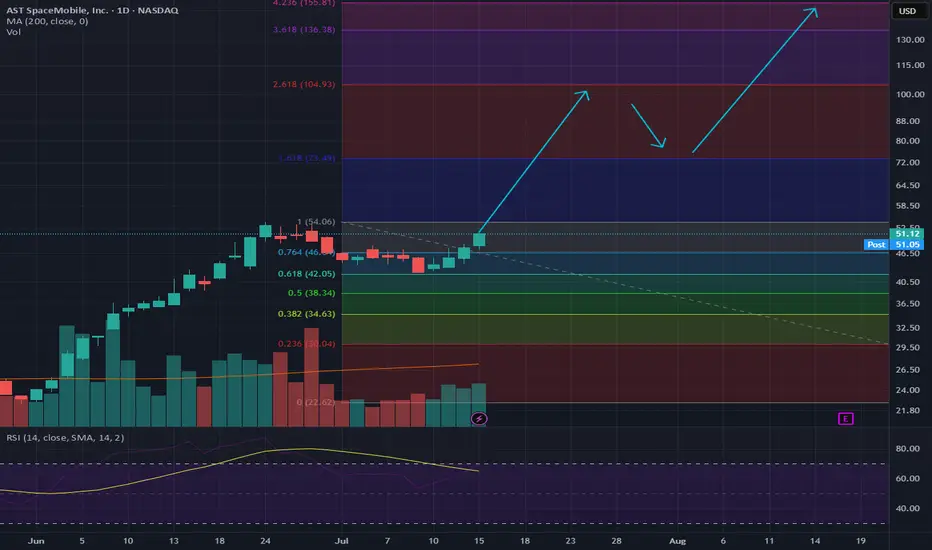
LONG-TERM $ASTSYou can't spell Sats without ASTS
This will be a trillion dollar company - here's the next few years, cheers!
HOOD - Get Great PricingNASDAQ:HOOD and I have had a mixed relationship over the years. I have had my biggest win on the HOOD brokerage (5,000% options trade, $1200 into 60k) and at the same time I was present for the Derogatory removal of the GME button (of which I had sold before they took that button).
After many years and brokerages, I find myself returning to HOOD but this time much more experience... To my surprise, I love the platform, and I still recommend it for new traders for the ease and UI. Honestly, unless you are dealing with BIG Volume or Hot-Keying out of Low float Penny stocks, It will suit you just fine.
Now Let's Talk HOOD.
In this MASSIVE range we are looking at High $67, and a Low of $35. Thats a 47% drop!
Although we have recovered a bit, Many are eager to find a way to get in the range. Here I have put together 2 scenarios to help you play your position with confidence.
Better Price = Better psychology
Whether we are shopping at grocery store, or if we are buying a car. Getting a good deal feels better. But how do you feel when you know you overpaid?
TLDR: The best deals are the lowest purple zone "Extreme Demand" if you are Long, "Reinforced Supply" (at the top) if you are looking to get short or take profit.
Under the HOOD
Currently Robinghood is running into a little bit of a supply zone labelled "Weak Supply"
This is a new player, and we don't yet know how just how big this player is. So far they have absorbed some of that buying pressure coming in, but I would not be surprised if they we overtaken or even gapped above come Monday. This brings us to our first Scenario
Scenario 1: Blue line
With the break above "weak supply", there is headroom all the way until 51.74. This is where we will see some supply initially and maybe a small rejection.
Why would it not reject back down to a demand area like 41? Great question.
If this overtakes that "Weak Supply" zone, this will make a strong case that there is momentum behind the wheels here. I think there will be a new player reinforcing this buying if this happens all the way to the Finale at $58.01. From here I would consider taking some profits, maybe partials, or looking for some Puts.
Scenario 2: Red line
Getting Rejected by "Weak supply" would be evidence that this move was fluff. Those two demand zones may try to hold a bit, but with the lack of buying interest in the
$45 area, this won't make those buyers feel confident.
This is different story when comparing to the "Extreme Demand" zone (lowest purple zone). Buyers here have PROVEN that this is something they are very interested and they are not done accumulating yet. So from this location buyers feel confident that they are getting a good price*( see fn. )
From here this should drive demand up again, crushing shorts, and sending another nice squeeze to test that supply at 51.71
WHEW! if you made it this far, I appreciate your time!
Upvote/Follow if you enjoyed this idea, there are many more to come!
Happy trading!
* (This is a good price, because buyers are showing that it is. Although, if it did come down here, this would be the 4th test of this area. I still think there will be strong demand here, but this isn't the best tests. 2nd and 3rd were stronger.)

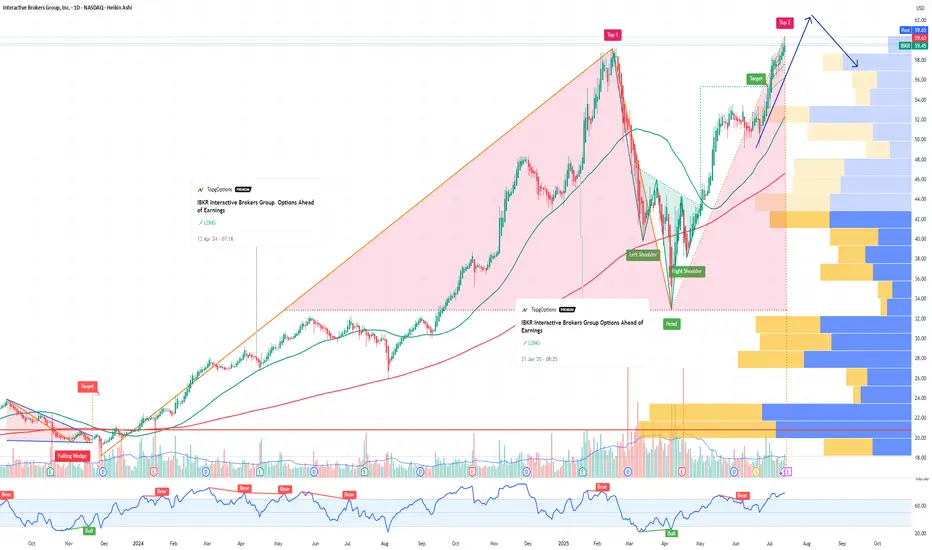
IBKR Interactive Brokers Group Options Ahead of EarningsIf you haven`t bought IBKR before the rally:
Now analyzing the options chain and the chart patterns of IBKR Interactive Brokers prior to the earnings report this week,
I would consider purchasing the 60usd strike price Calls with
an expiration date of 2025-9-19,
for a premium of approximately $3.90.
If these options prove to be profitable prior to the earnings release, I would sell at least half of them.
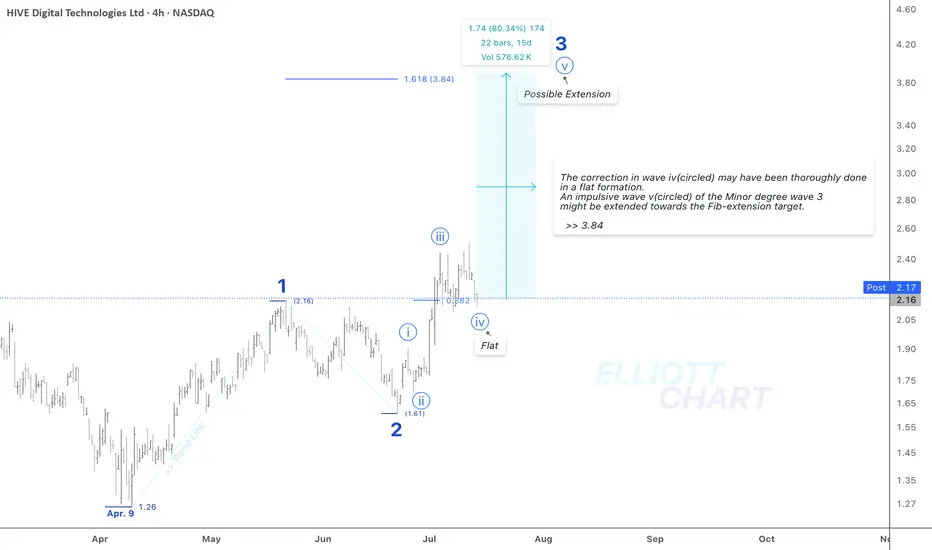
HIVE / 4hAccording to the prior analysis, NASDAQ:HIVE may have developed a sequence of Minor degree waves, in which the waves of 1 and 2 both were completed, and impulse 3 has remained in progress.
Wave Analysis >> The correction in wave iv (circled) may have been thoroughly done in a flat formation. An impulsive wave v(circled) of the Minor degree wave 3 might be extended towards the Fib-extension target >> 3.84
NASDAQ:HIVE CRYPTOCAP:BTC MARKETSCOM:BITCOIN
#CryptoStocks #HIVE #BTCMining #Bitcoin #BTC
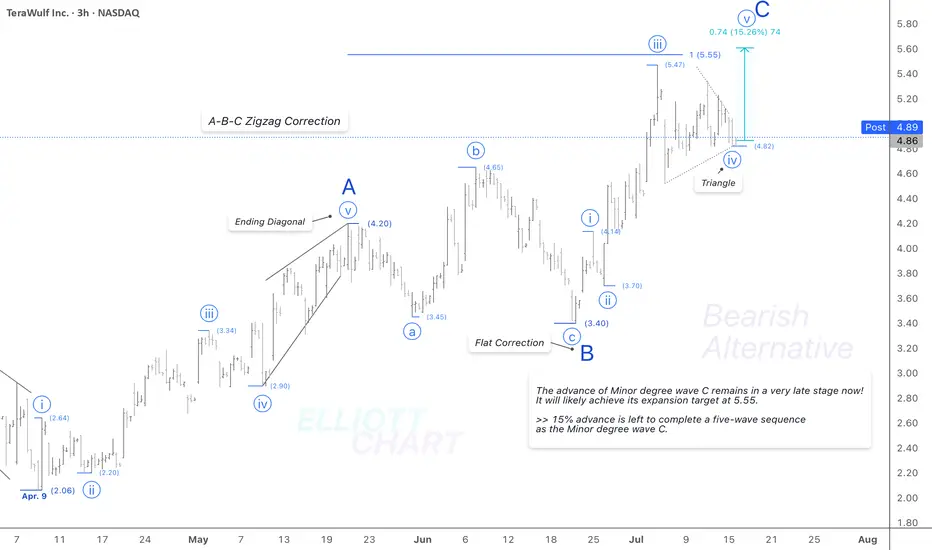
WULF / 3hAs a second alternative, NASDAQ:WULF may have developed a five-wave impulsive sequence as the Minor degree wave C, in which its 4th wave correction in a triangle appears to be over at 4.82.
So, the final advance by 15% in the same degree wave v(circled) lies ahead to conclude the Minor degree wave C of the entire correction in an A-B-C zigzag as a countertrend advance in Intermediate degree wave (B).
Trend Analysis >> The countertrend advance as Intermediate degree wave (B) will probably change to decline in the same degree wave (C) very soon!! And it'll likely last until the end of the year.
#CryptoStocks #WULF #BTCMining #Bitcoin #BTC
NASDAQ:WULF CRYPTOCAP:BTC MARKETSCOM:BITCOIN
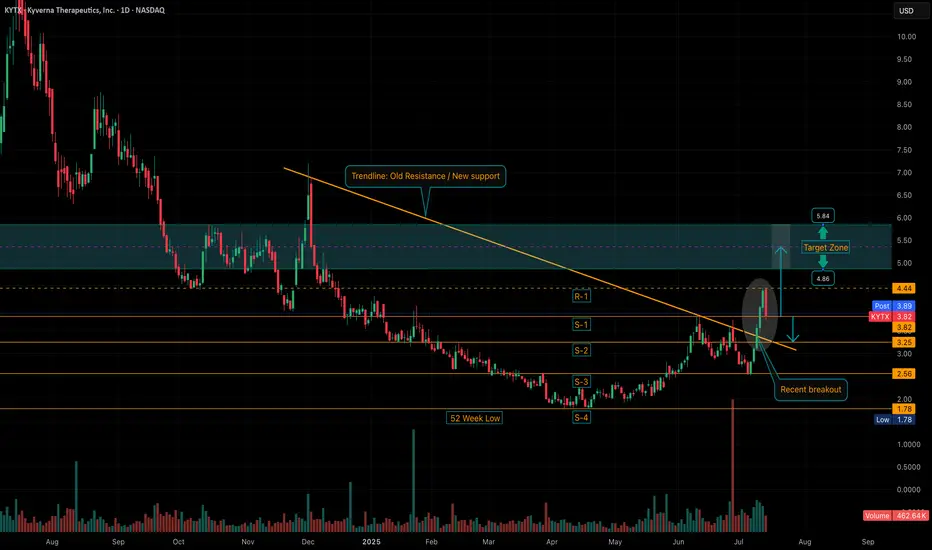
KYTX: Healthy Retracement After Strong Move – Key Support LevelsChart update: We tagged resistance at $4.44 (R-1) before pulling back and closing right at S-1 support ($3.82). After the strong multi-day run from the $2.50 zone, this kind of retracement is normal... even healthy.
If we see further downside, I’m watching $3.25 (S-2), which lines up well with the reclaimed trendline that should now serve as support.
Still viewing this as digestion, not distribution. Setup’s intact, IMO. Stay tuned.
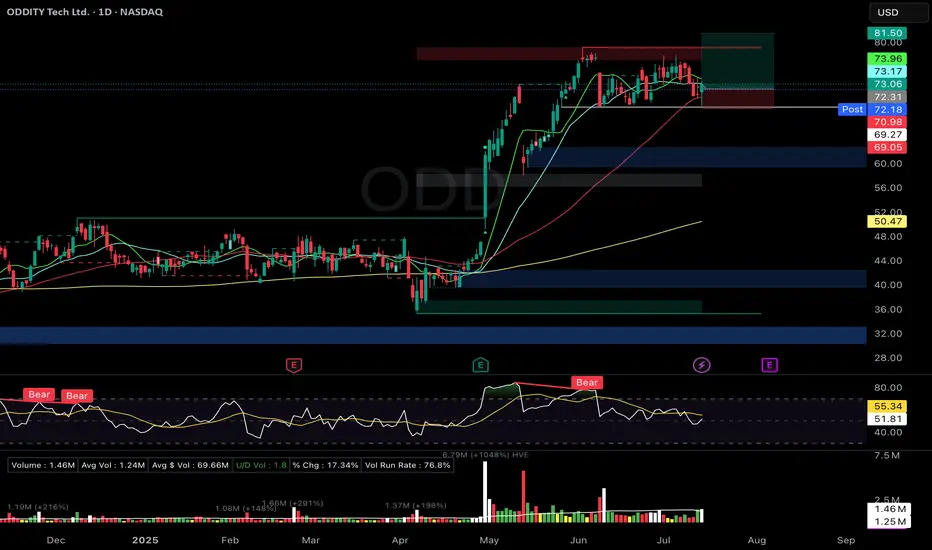
ODD Flat Base (Stage 2) – Support ReversalOddity Tech Ltd. ( NASDAQ:ODD )
🚀 Entry: $72.31
📊 Setup: Flat Base (Stage 2) – Support Reversal
🛑 Stop: $69.05
🎯 Target: $89.50
🔑 Why I Entered:
Solid 6-week flat base (~13% depth) with a bullish hammer candle reversal off the 50-DMA and key support.
Moving averages (10/21/50 DMA) are coiling tightly, indicating a potential breakout.
Strong institutional accumulation signals backed by increasing volume.
Exceptional fundamentals: EPS growth at 79%, RS Rating at 95, Composite at 97 (per IBD).
🎯 What's Next:
Watching for a decisive breakout above the $79.18 pivot on high volume for a potential scale-in.
Earnings due in two weeks—staying vigilant for any unusual volatility ahead of the announcement.
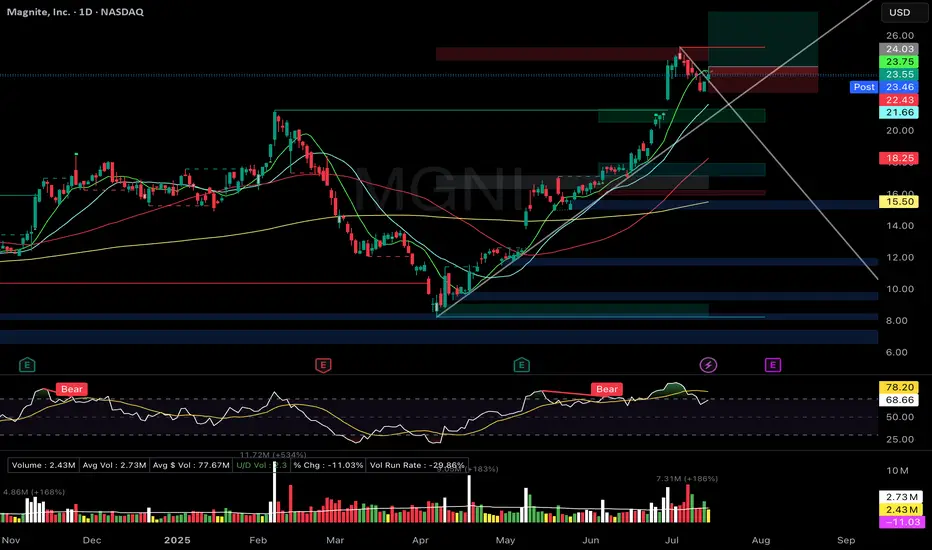
MGNI Zanger-style Bull Flag Breakout PullbackMagnite Inc. (MGNI)
🚀 Entry: $24.03
📊 Setup: Zanger-style Bull Flag Breakout Pullback
🛑 Stop: $22.43
🎯 Target: $27.50
🔑 Why I Entered:
Picture-perfect bull-flag pullback pattern with volume drying significantly, tapping precisely on the rising trendline.
Price action holding strong above rising short-term EMAs (9/21).
Excellent relative strength, reflecting a previous strong-volume breakout move.
🎯 What's Next:
Seeking strong volume surge confirmation to confirm continuation of the breakout.
Earnings report in three weeks—ready to take partial profits if price significantly appreciates ahead of the event.