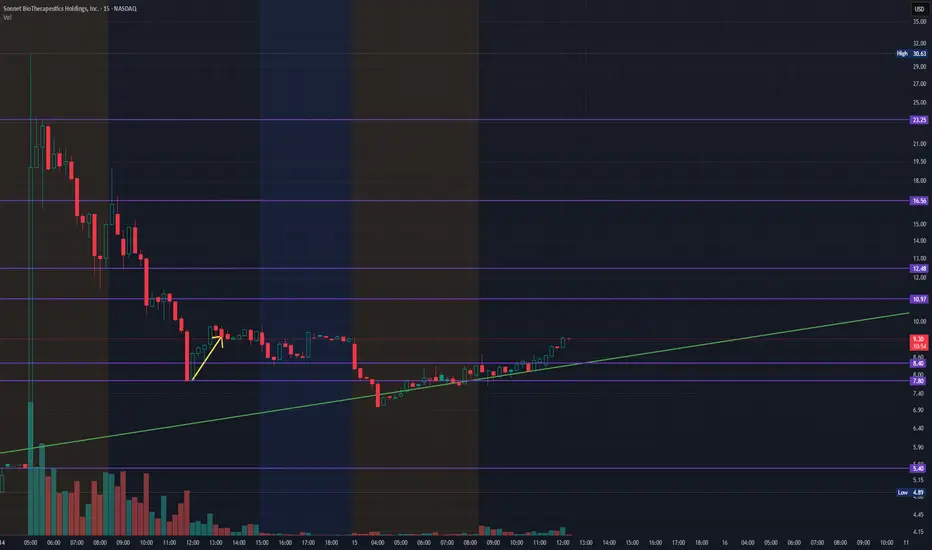
SONN - Sonnet BioTehrapeutics - Continuation to $16 50% FibAfter SONN broke out to $30.63 from $4.20 in yesterday's pre-market, after announcing entering an agreement to become a Public Cryptocurrency Treasury Company. We entered NASDAQ:SONN at $8.28 this morning in's pre-market during the completion of consolidation and convergence on the EMAs from the Consolidation Downtrend. Looking for a $16 PT / 50% Fib Retrace Retest on the 15-Min.
FINANCIAL NEWS:
Sonnet BioTherapeutics shares climbed after the oncology-focused biotechnology company said it entered into an agreement to become a public cryptocurrency treasury company.
Shares more than doubled to $13.50 on Monday. Shares were up 78.5% over the past year.
Sonnet BioTherapeutics , which entered the business combination agreement with Rorschach and other sponsors, said it plans to build a reserve of HYPE, the token of the Hyperliquid Layer-1 blockchain.
Sonnet BioTherapeutics will transform into a new entity called HyperLiquid Strategies at the agreement's close. The new company is expected to hold 12.6 million HYPE tokens and gross cash invested of at least $305 million , for a total assumed closing value of $888 million .
The company will name David Schamis , chief investment officer and co-founder of Atlas Merchant Capital , as chief executive of HyperLiquid Strategies.


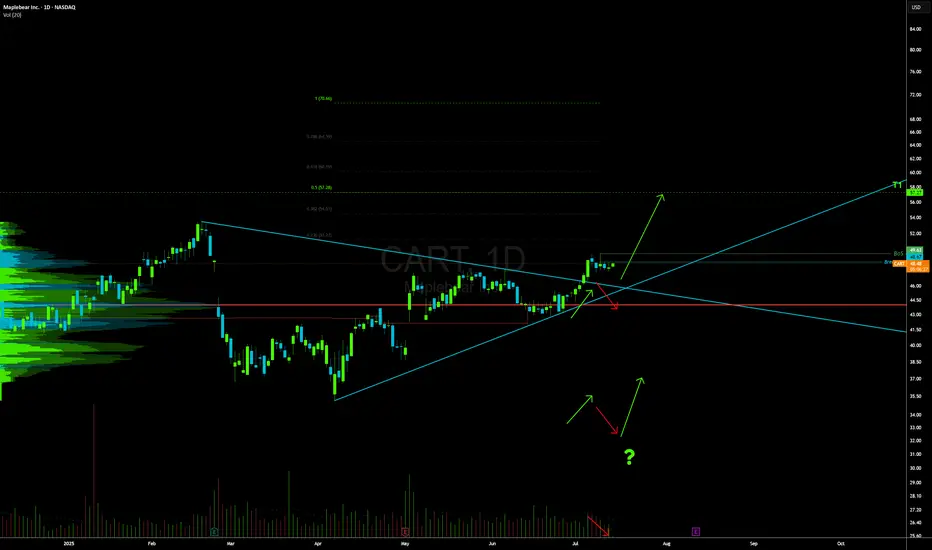
CART LONG
Strong Profits
The company makes solid money on what it sells. It keeps a high percentage of revenue as profit, with strong margins all around. It also generates good returns from the money it invests.
No Debt, Plenty of Cash
The company has almost no debt and a strong cash position. It has more than enough to cover short-term needs and stay financially stable.
Earnings Are Growing
Earnings more than doubled over the last year and are expected to grow again next year. Big investors like mutual funds and institutions are buying more of the stock, which is a good sign.
Business Has an Edge
The company has very high profit margins, which suggests it has pricing power or a business model that’s hard to compete with.
HIGH INSTITUTIONAL OWNERSHIP 66.15%
-Broke Out of a Wedge
The stock recently broke out of a wedge pattern, which often means it's ready to move higher.
-Pulling Back Gently
After the breakout, the stock is easing back on light trading volume INTO THE 8ema. That usually means sellers aren't too aggressive and a move higher could be coming.
Looking Toward the Mid-Fifties
Based on the current setup, the stock looks like it could climb to around 57 if momentum holds up.
-Momentum is Positive
The stock is trending above its key moving averages and has gained a lot over the past year. The trend is still strong.
15 near term?NYSE:ACHR has been consolidating very well in this range, and today we saw a very strong candle with a lot of volume. This can be used as confirmation that it's breaking out of this channel to move higher. My first target is 12.48, then the ATH. After that, we should quickly reach the 14.5-15.8 range.

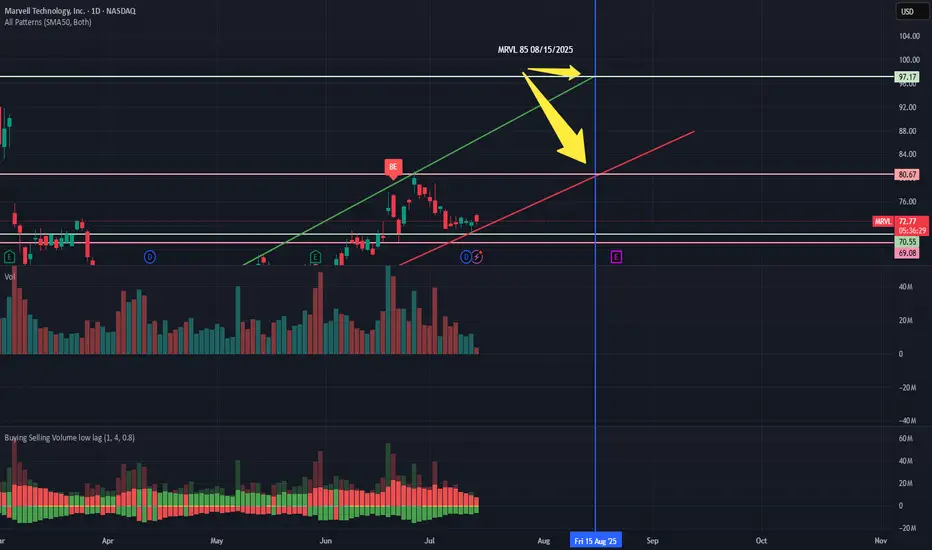
MRVL Trading Idea For Q2 EarningsNFA
I bought a few contracts for Call options for MRVL 08/15/2025 85 C last week.
Let's see how it plays out up to the earnings announcement and a few days beyond. :)
GLTA
Rackspace Technology inc Stock in Triggering level 💯 , 1st Target prices zone between 2.88$ - 3.03$
Stock on Inverted Head and Shoulders pattern at the bottom, And Target prices zone between 5.02$ - 5.76$ ( Resistance level).
Highly recommended for Buy 👌

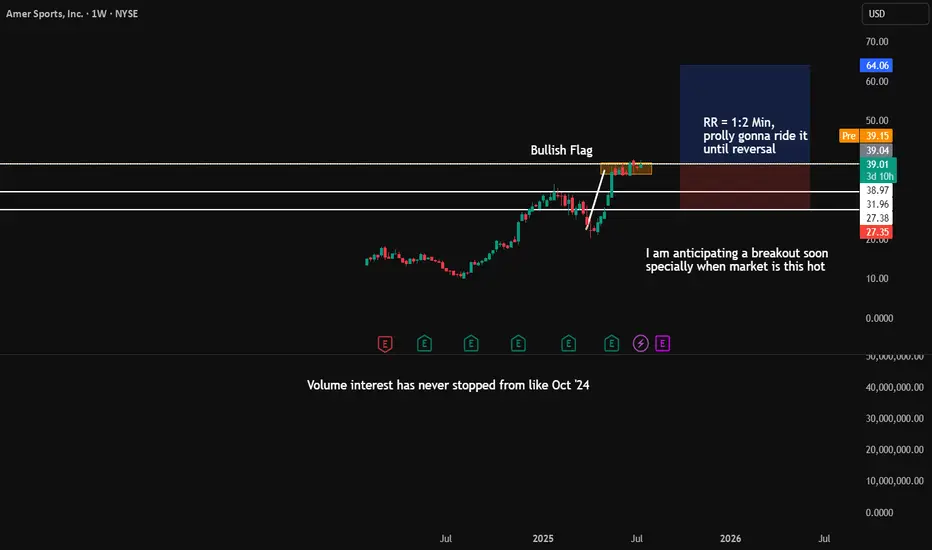
AS breakout anticipationThis company has regularly beaten the estimates.
The Fundamental trajectory is in uptrend.
What I love about this kind of stock is there is constant above average volume, the volume interest is keeping on rising from Oct '24. For me Bullish flag breakout is what's going to happen sooner or later.
Well pullback to $38.97 is possible, but with good risk management it will be easy for me to risk some for the potential huge breakout that I am anticipating.
QuickView : AKAMOn the daily Chart the price is trying to make a move higher without success. Bears are still in control and a new bearish crossover is coming.

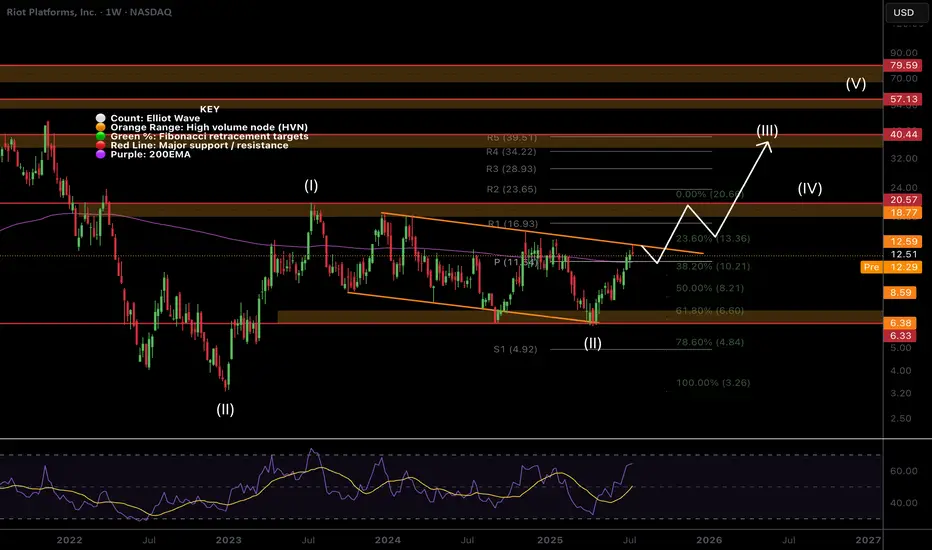
$RIOT Hit The Target Whats Next?NASDAQ:RIOT hit the descending orange resistance were I took partial take profits on my trade this week and it was immediately rejected as expected.
Price is now above the weekly pivot so that is the next support. This level also matches the weekly 200EMA.
Wave (II) hit the 'alt-coin' golden pocket of 0.618-0.786 Fibonacci retracement at the High Volume Node (HVN) support and descending support line which kicked off wave (III).
A breakout above the descending resistance line bring up the the next target of the HVN and previous swing high at $18-20 and $40 following a breakout above that.
Safe trading
Quick View: $AZN- On the daily Chart the price is testing now the lower side of the channel with a new bullish crossover and positive price action. Looks like there is a great chance for a new entry here

3 Reasons Why Cisco Stock Is Ready to Rocket (Bonus Strategy)3 Reasons Why Cisco Stock Is Ready to Rocket (Bonus Strategy Inside)
Cisco is flashing bullish signs from candlesticks to volume. Here's why a breakout could be imminent — with a bonus momentum strategy revealed.
---
Cisco Systems ( NASDAQ:CSCO ) is showing signs of a potential breakout — and savvy traders should take notice. Here’s why this tech giant is gathering bullish momentum across multiple signals:
1️⃣ Long Lower Shadow Candlestick Pattern
A long lower shadow on the recent candle suggests strong rejection of lower prices. This shows that buyers stepped in
aggressively after an intraday dip — a classic bullish reversal sign that often marks the end of a pullback phase.
2️⃣ Volume Oscillator Below Zero
The volume oscillator dipping below zero may seem bearish at
first, but in context, it shows a decline in selling pressure. When paired with other bullish indicators, this can signal the calm
before a strong move upward — especially if bulls take control on the next candle.
3️⃣ High Volume on the 4H Time Frame
Volume doesn’t lie — and it’s surging on the 4-hour chart. This spike in volume at key support levels adds strong confirmation
that institutional players may be stepping in. When volume rises while price action forms reversal candles, it increases the
probability of a sustained upward move.
---
🚀 Bonus Reason: The Rocket Booster Strategy is in Play
Cisco is also aligning with the Rocket Booster Strategy, which requires:
Price trading above the 50 EMA
Price trading above the 200 EMA
A recent gap up confirmed by Parabolic SAR
Strong supporting volume
This strategy acts like ignition for high-momentum trades — and Cisco looks ready for lift-off.
---
📌 Conclusion:
With technicals aligning and volume building, Cisco could be gearing up for a breakout. Traders should keep an eye on confirmation candles and volume spikes to validate the next leg upward.
---
📉 Disclaimer: Trading involves risk. Always conduct your own research and consult a financial advisor before investing.
---

Not too bullish, but one to watch for break outThis trade is still in the consolidation phase, but has a potential break out with volume. Wanting to see price get above $13, before adding more to this position.
For the time being, watch and look for volume and consolidation.
MSFT watch $392.76-394.12: Key Resistance to Tariff RecoveryMSFT testing a well proven Resistance zone $392.76-394.12
This zone rejected twice already, now may be ready to break?
Fib reactions have been precise, so look for Break-n-Retest

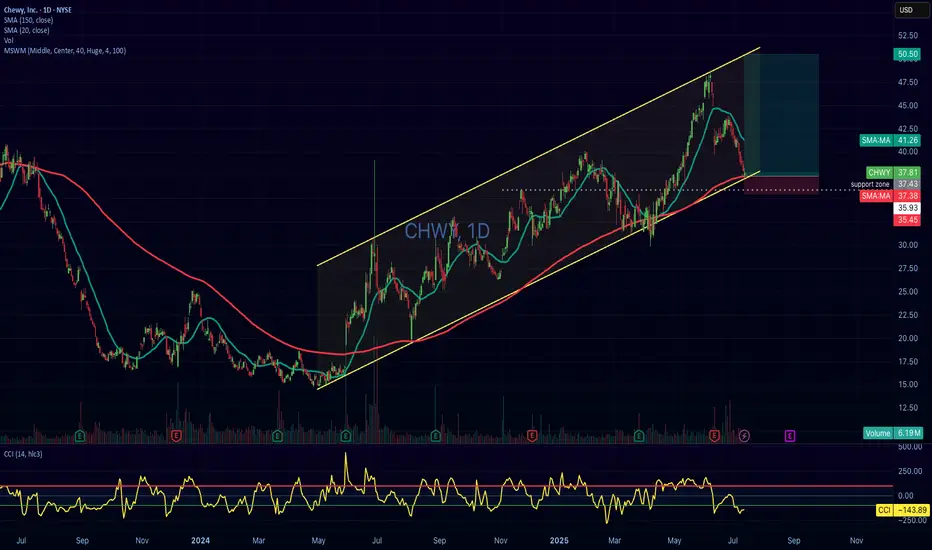
CHWY Long – Swing from 150 SMA Support with Oversold CCI and GapNYSE:CHWY
📅 Entry: July 15, 2025
📉 Price: 37.80
✋ Stop: 35.82
🎯 Target: 50.87
⚖️ Risk-Reward: 1:6.6
✅ Status: Active
🧠 Trade Idea:
CHWY is testing the lower bound of a well-defined ascending channel, while also bouncing from the 150-day simple moving average (SMA150) — a strong technical support area.
Additional bullish signals include:
The price is significantly stretched below the 20-day SMA, suggesting a potential mean-reversion move.
The Commodity Channel Index (CCI) is deeply oversold (around -143), starting to curl upwards — a classic reversal signal.
There's an open gap above near the $47 level, providing a natural swing target.
📌 This trade aims to capitalize on a high-probability reversal setup, with strong confluence of support, momentum shift, and attractive risk-reward.
#swingtrading #CHWY #technicalanalysis #stocks #tradingview #longsetup #riskreward #CCI
SMR heads up at $40.78: Golden Genesis fib may cause a DIPSMR got a strong spike with all nuclear stocks.
It has just hit a Golden Genesis fib at $40.78.
Look for a Dip-to-Fib or Break-n-Retest for longs.
.
See "Related Publications" for previous plots including this BOTTOM CALL:
===========================================
.

FTNT - Precision Swing Trade Setup📈 Symbol: FTNT (Fortinet)
⌛ Timeframe: Daily Chart
⚡ Strategy: High-Conviction Swing Trade (5-10 days)
🎯 Pinpoint Trade Execution
Entry: $103.00 (Key psychological level + SMA 50 confluence)
Stop-Loss: $95.80 (7% risk, below July swing low)
Take-Profit: $118.16 (14.7% upside, pre-earnings resistance)
Risk-Reward: 1:2.1 (Optimized ratio)
📊 Technical Rationale
✅ Triple Confirmation Setup:
Connors RSI2 Signals: Back-to-back buy triggers (July 10-11)
Volume Surge: 30% above 20-day avg on reversal candle
MACD Flip: Bullish crossover at -2.5 (oversold rebound)
Key Levels:
Defense Line (SL): $95.80 (Protects against false breakout)
Profit Zones:
$110.50 (Partial take-profit at 50% Fib)
$118.16 (Full exit at 61.8% Fib + VWAP resistance)
⚡ Smart Trade Management
1️⃣ Entry: $103.00 limit order
2️⃣ Stop Strategy:
Initial SL: $95.80
Adjust to $101.00 if price hits $108.00
3️⃣ Profit Plan:
Sell 30% at $110.50
Trail remainder with 2-bar low exit
🌐 Fundamental Context
Earnings Date: July 25 (Plan exit before)
Short Interest: 8.5% float (squeeze potential)
Institutional Activity: 13F filings show $200M+ inflows
⚠️ Critical Risk Notes
Sector Risk: Tech volatility (monitor SOXX ETF)
Earnings Gap Risk: July 25 event may override technicals
Alternative Scenario: Invalidated below $95.80 → Wait for retest
#PrecisionTrading #Cybersecurity #RiskReward
👇 Like/Comment if you'd take this trade!
🔔 Follow for institutional-grade setups
(Chart: Daily timeframe with Fib levels + volume profile)

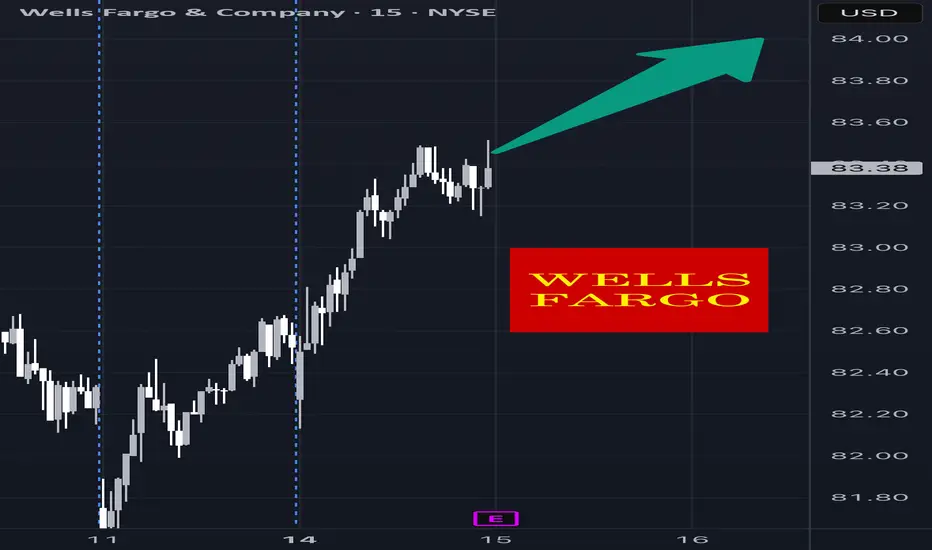
WFC Earnings Setup – 07/14/2025 $86C | Exp. July 18 | Betting on
📈 WFC Earnings Setup – 07/14/2025
$86C | Exp. July 18 | Betting on a Bank Bounce
⸻
🔥 EARNINGS HEAT CHECK
💼 WFC reports BMO (07/15)
📊 Historical move avg: ~3–5%
📍 Current price: $82.53
📈 Above 20D/50D MAs → trend intact
⚠️ RSI = 78.07 = overbought 🚨
💥 Expected move: $2.89
⸻
🧠 SENTIMENT SNAPSHOT
🔄 Call OI stacked at $86
🔻 Put OI focused at $81
⚖️ Balanced flow → slight bullish tilt
🧾 IV is elevated, so IV crush is coming
⸻
🏦 SECTOR SUPPORT
• Financials showing strength 📈
• No major institutional bias
• VIX @ 16.40 → macro calm = earnings-friendly
⸻
🎯 Trade Plan – IV Exploitation Setup
{
"ticker": "WFC",
"type": "CALL",
"strike": 86,
"exp": "2025-07-18",
"entry": 0.81,
"target": 1.62,
"stop": 0.40,
"size": 1,
"confidence": "70%",
"entry_timing": "pre-earnings close"
}
🔹 Call Entry: $0.81
🎯 Profit Target: $1.62 (+100%)
🛑 Stop: $0.40 (-50%)
📅 Expiry: 07/18/25
📆 Earnings Date: 07/14 (BMO)
📈 Expected Move: ~$2.89
🧠 Confidence: 70%
⸻
⚠️ Key Risks
• IV crush = quick decay if WFC doesn’t move
• Guidance could swing the stock either direction fast
• Overbought = short-term pullback risk even on good earnings
✅ Why $86C?
• Just outside expected move
• High OI = liquidity
• Reasonable premium = good risk/reward
⸻
📣 Model Consensus:
“Moderately Bullish” — strong setup but keep it tight around earnings!
Tag your favorite bank stock trader 🏦👇
Who’s playing WFC earnings this quarter?
#WFC #EarningsPlay #OptionsTrading #CallOption #BankingStocks #IVCrush #RiskReward #AITrading #
JPM Breakout in Play – Target $295+
🧠 Chart Analysis Summary:
Pattern: Symmetrical triangle breakout has occurred. Momentum is building.
Current Price: $288.58
Breakout Confirmation: Price closed above resistance trendline (pink), signaling potential bullish move.
📊 Key Levels:
Entry Zone: $288.50–289.00
Resistance/Targets:
Minor Resistance: $291.87 (red line)
Main Target: $295.54 (green line)
Support Zone:
$284.00–285.00 (white zone, strong base)
🎯 Trade Plan (Bullish Setup):
Entry: $288.60
Target: $295.00–295.50
Stop-Loss: Below $284.00

BK Earnings Trade Setup – 07/14/2025 $97.50C | Exp. July 18 | Ri
📈 BK Earnings Trade Setup – 07/14/2025
$97.50C | Exp. July 18 | Riding the Sector Wave
⸻
🔥 BULLISH EARNINGS SETUP
🏦 BK sits at $93.69, just under its 52W high of $95.10
📈 Strong trend + volume rising pre-earnings
📊 RSI = 76.29 → overbought, but could break out on positive earnings
⸻
🧠 Macro + Sector Check
• Financials are strong across the board 🟢
• Analysts bullish on BK 📣
• VIX at 16.40 = market calm = earnings plays viable
⸻
🎯 Earnings Trade Plan – High OI Strike
{
"ticker": "BK",
"type": "CALL",
"strike": 97.50,
"exp": "2025-07-18",
"entry": 0.90,
"target": 1.80,
"stop": 0.45,
"size": 1,
"confidence": "75%",
"entry_timing": "pre-earnings close"
}
🔹 Call Entry: $0.90
🎯 Target: $1.80 (+100%)
🛑 Stop: $0.45
📆 Expiry: 07/18/2025
📈 Expected Move: ~4%
📅 Earnings Date: 07/15 (BMO)
📊 Confidence: 75%
⸻
📌 Why $97.50C?
✅ High OI
✅ Matches expected move
✅ Good leverage near key levels
⸻
⚠️ Risk Note:
• RSI is hot 🔥
• If earnings miss → IV crush hits hard
• Not a diamond-hands trade — manage it tight
⸻
💬 Model Take:
“Moderately Bullish” — everything’s aligned, but keep stops tight due to overbought conditions.
Tag your earnings squad 📢 — BK is in play.
#BK #EarningsPlay #OptionsTrading #CallOption #FinancialSector #BreakoutSetup #

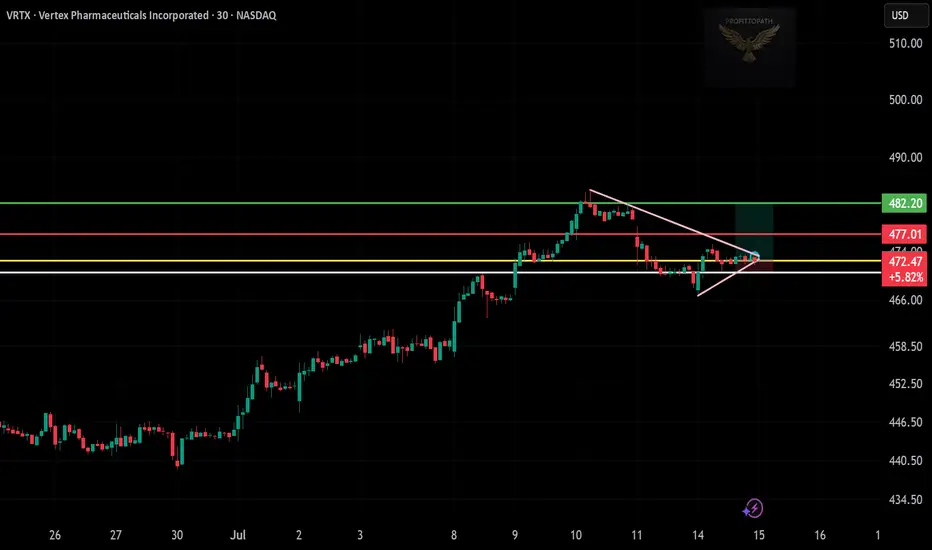
VRTX Tight Triangle Breakout – Watch Closely
🧠 Chart Analysis Summary:
Pattern: A symmetrical triangle is visible, tightening toward the apex with a breakout just forming.
Current Price: $472.47 (breakout near)
Key Levels:
Support Zone: Around $468–470 (white/yellow zone)
Resistance Zone:
First Target: $477.01 (red line)
Major Target: $482.20 (green line)
Volume Confirmation: Suggested to confirm breakout with volume increase.
📊 Trade Idea (Long Setup):
Entry: $472.50–473.00
Target 1: $477.00
Target 2: $482.00
Stop-Loss: Below $468.00