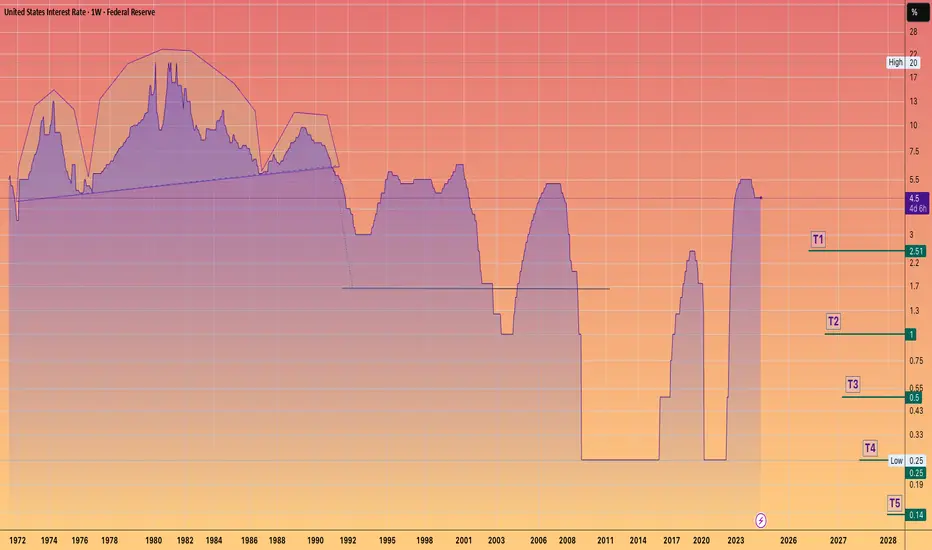
$USINTR -Fed Keeps Rates Uncut (June/2025)ECONOMICS:USINTR
June/2025
source: Federal Reserve
- The Federal Reserve left the federal funds rate unchanged at 4.25%–4.50% for a fourth consecutive meeting in June 2025, in line with expectations, as policymakers take a cautious stance to fully evaluate the economic impact of President Trump’
Economy

Soon find it more expensive to fill up car with gas!Minimum wage earners can soon find it more expensive to fill up their cars with gas.
Breakdowns in this chart have also coincided with tops in the stock market.
Followed by impressive runs for gold, silver, uranium, platinum, copper, and of course... oil!

Mr. LATE drop the RATE!!"Jerome Powell aspires to be remembered as a heroic Federal Reserve chair, akin to Tall Paul #VOLKER.
However, Volker was largely unpopular during much of his tenure.
The primary function of the Federal Reserve is to finance the federal #government and ensure liquidity in US capital markets.
Contr
The FED on June 18 will be decisive for the stock market!Several fundamental factors will have a strong influence on the stock market this week, including trade diplomacy, geopolitical tensions and the FED's monetary policy decision on Wednesday June 18.
1) The FED on June 18, the fundamental highlight of the week
The stock market week will be dominat

US NFCI shows path of BTC this yearThere is still well financial confitions in a financial system so it makes sense to expect this 2 scenarios.
1. BTC 130k from here
2. BTC 130k from 80-100k consolidation.
NFCI shows there is a lot of liquidity so markets should run higher this year.

Small Stocks vs. GoldThis index represents small caps minus big caps, divided by gold. A good representation of how small companies in USA are doing related to gold (hard asset). You could argue that this is more representing of real economy and it's health.

Global M2 Money SupplyWith more money than ever before in circulation available. Asset prices should go up..
Do you agree or disagree?

Mid-Week Outlook Update: US CPI- Trade TalksCPI day today. Scheduled to be released at 7:30 AM CT.
CME:6E1! CME_MINI:ES1! CME_MINI:NQ1! CME_MINI:MNQ1! CME_MINI:MES1! COMEX:GC1! CBOT:ZN1!
ES futures edged slightly higher after positive commentary from US-China trade talks. The delegations from both sides agreed on a framework

Another Population Led Economic Boom?Chat GPT thinks this will be an immigration and AI led boom:
Cycle MACD Trend Period Interpretation
1950s–1970s Rising MACD Post-WWII boom Baby Boom generation, industrial expansion, housing booms, high productivity.
1970s–early 1990s Flattening / declining MACD Stagnation, inflation Oil shocks, sta

**** Market Trading Strategy Idea SP500 ***Key Chart & Economic Insights:
- Current Market Position
- The S&P 500 is around $6000, showing positive momentum (+1.03%).
- Upward trend visible, indicating strong buying interest.
- Economic tailwinds support continued growth.
- Projected Price Movements
- 6800 USD: Key resistance level wh

See all popular ideas
GDPGDP GrowthReal GDPGDP Per CapitaGDP Per Capita PPPInflation RateInterest RateUnemployment RateGovernment Debt to GDPPopulationAverage Hourly EarningsHouse Price IndexManufacturing Production YoYIndustrial Production YoYCurrent AccountCurrent Account to GDPBalance of TradeEconomic Activity IndexCrude Oil ProductionSee all