Jobs, Gold, Spx and Rate Cuts!Initial jobless claims breaking out have a tendency to pressure the @federalreserve to start a rate cutting cycle.
Those puzzle pieces falling into place increase odds for a NEW precious metals complex bull era.
#jobless #recession #fomc #gold #silver #miners #spx
Economy

Lets Make This A Time Capsule of SortsThis is shaping up to be the biggest distrust in long term lending in the United States in history.
As we all know the yield curve is highly inverted and its always a great indicator that short term lending is encouraged more then long. Cant wait to see the short term bag holders that did the minimum down payment HAHAHHAA

Global Net LiquidityGlobal net liquidity is described by Fed Balance Sheet - RRP - TGA + BoJ Balance Sheet + PBOC Balance Sheet + ECB Balance Sheet

No rate cuts in 2024?This is a chart similar to one that Martin Pring published last month. This suggests that there is less likelihood that the Fed will need to cut rates in 2024.

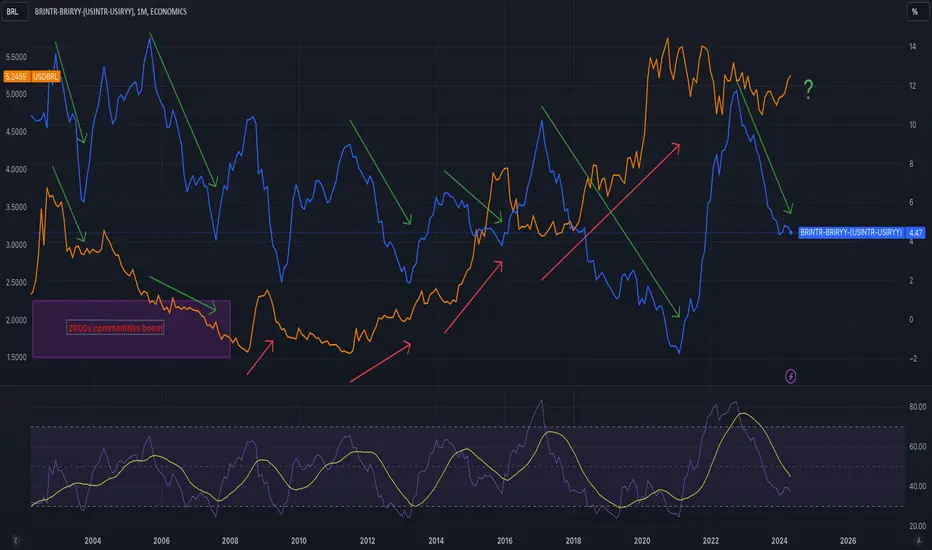
USDBRL impact due net real interest rates BR/USUSDBRL is going higher due net interest rates difference beteween US FED FUND and BRAZIL SELIC
UNEMPLOYMENT % correlation with bull/bear marketsI saw a Alessio video some years ago about this correlation :
low and falling unemployment rates as an indicator of incoming crash.
Now unemployment rates are climbing from historic lows, as this is bad for the unemployed individual, it is an indicator of better times coming for soc eco

70's V2While I think we'll see a rate cut cycle start soon, I anticipate it will only restoke inflation.

Euro Area Interest Rate Reduction a signal? Euro Area Interest Rate
◻️Reduced from 4.5% to 4.25% as expected
◻️We can acknowledge the pattern & recognize its significance without jumping to any immediate conclusions
◻️Chart will need to be combined with others to make assertions, such as the 10Y/2Y Yield Spread
U.S. 10Y/2Y Yield Spread with U.S. Unemployment rate
The amount of months that have passed prior to recession initiation after the yield curve makes its first turn back up towards 0% level
◻️ Historical Average timeframe is April 2024
◻️ Historical Maximum timeframe would be Jan 2025
No guarantee that history will repeat. Again, just a chart and some data that is worth keeping an eye on. Some people state the bond market is now broken and manipulated, we should know within 12 - 18 months, or sooner.
PUKA

Inflation Vs. Interest Spread in Major CurrenciesShows the inflation vs interest spread across major western currencies that could provide the opportunity for investment.

Canada Interest RateThere you have it, Canada cuts for the 1st time in over four years!
There isn't always a recession after a cut, but the last 4 US recessions started with a rate cut...
#recession #inflation #fomc #boc #fed #rates

Brutal Truth: War is Good for Biz across the M.I.C.Reflecting on war through industrial eyes. Ukraine's never ending conflict has been good for business across the Military Industrial Compex, across the globe. The threat of an expansionist China has led to wholesale changes in the historically sidelined Japanese military base www.perplexity.ai and business is booming from Mitsubishi Industrial to Rolls Royce to GE Aerospace down the line to various ETF's shown here. Since Jan 2022, pre-Ukraine 2.0 war, you can see the outperformance of these stocks vs. the broadest Wilshire 5000 price index. Expect more. And that includes the laggard that most people don't realize is 50% government/military----- Boeing!

Macroeconomic Update (Income, expense, consumer credit)Real income is experiencing a steeper rate of change than real disposable income. This coupled with increased productivity and a declining quit rate is disinflationary, but frustrating for workers. This tends to translate to pessimistic economic outlook.
Spending is slightly up to relatively flat while implied savings is decreasing. Don’t be surprised if we see media call this out as alarming. However, this is something that we see in the middle of economic cycles, not at the end.
Sharply increasing savings and sharply decreasing spending are traits of downturns, while depleting savings and continued spending favors market continuation.
Credit card delinquencies get a lot of press. However, credit card delinquencies pulling away from delinquencies in secure loans is also something that we see in the middle of an economic cycle.
Additionally, the relationship between the rate of change for real income, consumer credit, and card delinquencies is similar to the middle of a cycle. After downturns incomes begin to recover, and the consumer borrowing closely follows. The rates of change for each increase and then normalize. Consumers begin to realize a flattening rate of change for income, and then we see credit card delinquencies increase and level off.


canada house pprice indexcurrently at 3rd wave top , can go for abit more but not much left. time to sell

Baa corporate bond risk premium vs Ethereumas soon as the perceived risk in corporations ability to repay debt stops falling
as soon as people became fully bullish on corporations
then crypto stops rising!

US VS EU UnemploymentUpdate on the US versus Euro Area unemployment rate.
US trending upwards, while the EU Area is quite stable.
US came in at 3.9%
While EU Area is hovering between 6.4% - 6.5%

Rolling 5-Year InflationInstead of using the monthly inflation print, a 5-year (60-month) SMA is used to chart US inflation.
The SMA is used to cut back on noise from “transitory” inflation, giving a better view of the broader inflation environment realized over the past half-decade. Said differently, it illustrates the inflation environment which policymakers and central bankers are/were “dealing with.”
For a more short-term-oriented view of regime change, an EMA might be used in place of an SMA. A shorter-term view is likely to be more useful in the context of near-term interest rate cuts.
Historically, inflation tends to evolve from one “regime” to another. The implications of a regime change are enormous, and I am growing in my conviction that we are now in a new regime, as evidenced by the SMA breaking through a key level (explained below).
Since inflation prints (or, any macro data, for that matter) are a fool’s game to predict with a high degree of precision, I used a pseudoscientific approach which yielded 3.25% as the key level for inflation to “break through” to a new regime. Using 3.25% also gives us a “round” number, making it easier to quickly put inflation prints in context (for me, at least).
My commentary and some ideas to consider:
Why 3.25% is important: it had not been “breached” since 1996.
Put another way: the prevailing inflation environment has reached a level not seen in 28 years.
Why is 1996 important? A look back over the past century provides hindsight of when prior inflation regimes began and ended. After the “1970’s” (colloquially), we entered a new era which realized a prolonged downtrend in inflation worldwide. 1996 became a clear demarcation point upon identifying waves of “lower highs and lower lows” in the years since. Further, 1996 roughly coincides with the end of a series of markedly higher “waves” of inflation.
I feel it is relevant to also point out the dramatic changes in the world since we last saw 3.25% in 1996.
1. Internet
In 1996, the internet as we know it today was in its infancy. This is obviously a change of biblical proportions in the way we live, and never before in human history has the entire world been connected in this manner (i.e., we are the guinea pigs of computing). Entire libraries could be filled with commentary on the internet’s impact on the economy, so I will defer to the experts for opinions. That said, it has generally been disinflationary.
2. Tech Giants
Today, the 6 highest weighted S&P 500 stocks account for ~25% of the index. In 1996, of these six, only MSFT and AAPL were “established” companies, and even then, AAPL was in the midst of an identity crisis and was nowhere near the trillion dollar behemoth it is today. As for the remaining four: NVDA was founded three years prior in 1993, and in 1996 laid off ~1/2 of its then-100 employees. GOOG was still a research project of a pair of PhD’s and wouldn’t launch for another two years. AMZN was still in its first year of operations as an online bookstore, a far cry from its monstrous scale today. And, finally, the founder and brainchild of META, Mark Zuckerberg, was 11 years old, and the term social media was still about a decade away from entering even the fringes of society’s lexicon.
This is all to say, nearly 1/4 of the proxy for the “equity market” - the S&P 500 - is driven by ENTIRELY NEW “inventions” (or products, services, goods, etc.). In the context of inflation, NONE of these “inventions” have EVER existed in an economy with inflation “above 3.25%.” There is a mammoth amount of capital that is put towards tracking the S&P 500, and in order to balance weights when tracking, it involves the buying and selling of all its constituents together. Having been untested in a transition to a “higher” inflation regime, it remains to be seen how the heavyweights of the S&P will hold up. Should they demonstrate an inability to “absorb” inflation, it would likely result in a broader sell off of the S&P, and would be exacerbated by a rotation to fixed income should interest rates remain elevated and offer yield which is more attractive than uncertainty as to when the “absorption” will occur, if it does at all.
3. China
In 1996, China was still in its second stage of economic reforms, privatizing SOE’s, and would not enter the WTO for another five years. The consequences of China’s reforms have been enormous, and are potentially the most important influencer of inflation over the past thirty or so years. Again, this is another topic that could fill a library, and I will not elaborate more. That said, the effects of China’s reforms have been largely disinflationary. It is uncertain whether this trend will continue, as China is now facing a host of serious financial issues which could reach a boiling point. In particular, China is now the dominant player in commodity markets, virtually controlling the supply and/or demand for many of the world’s raw materials. How this interacts with China’s navigation of financial issues is uncertain, but has potential to be highly disruptive to global supply chains, which would push inflation higher.
4. Government Debt
The US’ prolonged wars in Afghanistan and Iraq, on which the country spent several trillion dollars over nearly two decades, were still several years from occurring. Unlike other wars in the 20th Century and in recent history, these wars were largely financed through government debt. In the opinion of many, these wars were considered to be failures. Largely agreeing with this notion, the expansion of deficit spending to finance “lost” wars not only diverted monies from useful purposes such as infrastructure and education, but also hastened the government’s need to “inflate away” its debt. According to a paper by Brown University’s Watson Institute, the interest expense alone on the debt used to finance these wars will likely exceed $2 TN by 2030. To put this in perspective, when considering the 2022 federal outlay for highway spending amounted to $47 BN, these interest payments on war debt are roughly equal to FIFTY YEARS worth of federal highway spending.
To make matters worse, the debt from the US’ wars pales in comparison to the bonanza in government spending in response to COVID. A whopping $5 TN in stimulus was doled out in a matter of months. It will take years to determine the ultimate effect the stimulus money will have had on the economy’s “intangibles”. For now, it is clear this spending spree has bloated the government’s debt, and input can be argued the US is running a dangerously high Debt/GDP ratio - a bellwether of inflation.
How does the government plan to dig itself out of this hole? Logic points towards the path of least resistance, which in this case means “inflating away the debt.” We very well may have already begun to see this process set in motion.
Inflation, by its nature, carries political implications, which has often led to charged discourse and sensationalized media headlines. This rings particularly true in election years (this year) and in times of collective struggle (the COVID era). Unfortunately, this can muddy the waters when trying to make sense of the data prints. My aim was to make a simple illustration which can uncover a regime change in inflation. It is up to the user to determine whether the regime change signal holds validity.

Economic Overview | The "Yellowstone Bubble"On Thursday, May 16th, I was sipping coffee and watching The Today Show , when a guest appeared on the program to talk about how much money YOU are supposedly making in your 401(k). Oddly enough the commentator - who was identified as the "chief business correspondent for CNN" - then reminded viewers that "you really should only look at your 401(k) once or twice a year"....
What?....WHAT?
My first thought: we don't need to be lectured on how often we should be checking on our retirement funds.
But this got me thinking, WHY do these "professional money managers" insist that working people not pay attention to their money??
I am speculating here, but I assume it is because retirement fund managers (large investment institutions) are also in the business of making money and therefore TAKING PROFIT.
Is there any evidence for this?... Well, yes:
Now factor in all of the nonsense that is constantly pumped by television commentators, meme stock pumpers, crypto fantasies, immature CEOs, and more recently - celebrities and professional athletes.
Have you ever stopped to think about the fact that there is a television commercial for $QQQ... Things have become so obscene that money managers are paying for airtime to deceptively lure regular people into buying their securities, so they can take profits, after already receiving bailouts. You've seen it, there are several versions of the same commercial and the narrative goes something like "I'm investing in QQQ for the future".
The Unemployment Rate has bottomed - there is no more growth to be had and even if we were to see unemployment trend below 3%, we can go back to the early 1950s and 1960s to see that financial markets really DON'T return much more below 3% unemployment; again this is because there is no more growth below 3% and therefore marginally less return.
Credit card delinquency is rising rapidly, thanks to inflation from Covid helicopter money.
And Household Debt-to-GDP has also bottomed. This one is particularly concerning because as we just explained, there is no more growth to be achieved from here (UNRATE). So, ask yourself: what happens if GDP falls ? Answer: household debt as a proportion of GDP rises by at leas that amount (it's a ratio - it has no choice). Expanding on this question, ask yourself: what happens if household debt continues to rise, amid maxed out unemployment? Answer: the already record profit-margins of investment banks increase to highly unstable levels, thereby further incentivizing profit-taking.
Anyway, I am calling this market the Yellowstone Bubble . Everyone is a rich tough-guy cattle rancher, everyone is a crypto professional, everyone thinks "Tesla is the future" (LOL), everyone is an AI expert, everyone is a pro because they scroll forums and listen to some podcast.
In a world that runs on "users" and "clicks" and web traffic, you must remain vigilant!
Take care!

Peak Inflation-Resistance trendline unbroken
-Bearish divergence on the Wolfpack
-"Overbought" on the RSI
-Curling price action

Inflation has Peaked-Multi-decade resistance trendline unbroken
-Bearish divergence on the Wolfpack
-"Overbought" on the RSI
-Curling price action

Will the 1970s second inflation wave repeat in this cycle?🤔Will the 1970s second inflation wave repeat in this cycle?🤔
We have many similarities today with the 1970s.
Will history repeat and we see another inflationary wave?

ISM Manufacturing PMI is below recession range of under 50The ISM Manufacturing PMI is below recession range of under 50, pointing to a contraction in the US manufacturing sector.
Market is not yet as healthy as the equity market would elude to.
Something to keep an eye on to check in on the health of the US economy

Inverted Yield Curve longest inversion to dateUsually when we have an inverted yield curve usually a recession follows.
This has been the longest inversion to date.
Is this time different?
Usually the countdown to a incoming recession is when the inversion un-inverts which means goes back up to zero.
Something to put on the back burner but keep an eye on
