Macro Monday 14~Unemployment Rate Rise Macro Monday 14
US Employment Rate Pre-Recession Indications
The Unemployment Rate tells us how many people in the United States are currently without a job and actively looking for one. The U.S. Bureau of Labor Statistics calculates and reports the unemployment rate. In basic terms it consists of the following;
Survey: The Bureau of Labor Statistics conducts a regular survey of a sample of households across the country. They ask people whether they are working or actively trying to find work.
Calculation: Based on the survey results, the Bureau calculates the percentage of people who are unemployed (those without jobs but actively seeking employment) compared to the total number of people in the labor force (those who are either employed or actively looking for work).
Reporting: This percentage is then reported as the unemployment rate. For example, if 5 out of every 100 people in the labor force are unemployed, the unemployment rate would be 5%. At present the Unemployment rate is 3.8%.
In simple terms, the unemployment rate is a way to gauge how many people are struggling to find jobs in the United States. In this respect it is an important economic indicator that helps us and policy makers understand the health of the job market.
The Chart
In today’s chart I will be analysing the history of the Unemployment Rate and how it has behaved both before and during recessions. The aim of the analysis is to help us understand the distinct pre-recession patterns and levels that occur prior to recession so that we can prepare ourselves should these levels be breached or these patterns play out again. These historic levels will be placed on the chart for you to monitor from today forward.
Chart Outline:
1. Recessions are the red zones (also numbered & labelled 1 – 12 and on the chart itself)
2. Increases in the Unemployment Rate prior to recession are in blue.
- These blue zones start at the lowest level the Unemployment Rate established prior to the
recession periods in red.
- Basis points (bps) have been used to show the change in the value within the blue zones
(pre-recession zones) e.g. recession No. 2 The Great Financial Crisis had a pre-recession
Unemployment Rate increase from 4.39% - 5.00% which is a 0.61% increase in the
unemployment rate or a 61 bps increase.
- Peaks: I have also included peak bps increases within these pre-recession periods (within
the blue zones). These are times that the Unemployment Rate peaked higher but reduced
thereafter but a recession still followed.
Chart Findings:
1. In 10 out of 12 of the recessions outlined the Unemployment Rate increased in advance of the on-coming recession (in the blue zones) demonstrating that initial early increases to the Unemployment Rate can act as an early recession warning signal:
- An average increase of 33.5 bps over an average timeframe of 7.3 months is observed pre-recession.
- The maximum increase in the pre-recession blue zones was 71bps over 8 months. This max increase was observed prior to 1980 Volcker/Energy Recession no. 6 on the chart (this increase was from 5.59% to 6.30% in the Unemployment Rate itself – a 71bps increase). This recession was induced by Fed Chair Paul Volcker’s sudden increase to interest rates much like those that have been imposed by Jerome Powell over recent months (Volcker was appointed in Aug 1979 and got to work quick).
- The max timeframe for a rising Unemployment Rate prior to recession was 16 months. This was prior to the The Gulf War Recession, no. 4 on the chart (which was considered a short 8 month softer recession). This max 16 month pre-recession timeframe has been marked on the chart to May 2024 in correspondence with today’s pre-recession blue zone timeline – so we know where a max timeline would put us (not a prediction).
- 2 out of 12 times the Unemployment Rate did not increase prior to recession however it did not decrease either, it based at 0 bps or no change (No.1 COVID-19 Crash and No. 5 The Iran/Energy Crisis Recession). Whilst the Unemployment Rate did not increase, they did temporarily peak higher within the blue zones by 10 bps (No. 1) and 31 bps (No.5) demonstrating the importance of peaks and bases formed prior to an Unemployment rate ramp up and recession.
I found the peak increases interesting to include because they illustrate that the Unemployment Rate can oscillate peaking higher temporarily only to form a higher low or return to its starting point, but a peak, if significant enough could be a telling indicator. The most notable peaks are the following; 62 bps (no. 12), 61 bps (no. 9), 60 bps (no. 10), 30 bps (No. 8), 31bps (No. 5) and only 10 bps (No. 2) for the COVID Crash. All of these peaks reduced thereafter within their pre-recession blue zones but a recession still ensued. A sudden increase in the unemployment rate should be taken seriously. I will include a subsequent data table chart that outlines these peaks and all other data utilized for Chart 1’s illustration and findings.
We are currently in dangerous territory as we have passed the average timeframe of 7.3 months of increases to the Unemployment Rate and the Unemployment Rate increased by 40 bps over that period which is higher than the historical average of 33.5bps. We have surpassed both averages. The max historical pre-recession increase is 71 bps (No. 6) so this is a level to watch going forward. This translates to a level of 4.11% in the Unemployment Rate (marked on the chart).
Similar to today’s Unemployment Rate level, there are two very similar instances in the past where the Unemployment Rate increased from c.3.4% to c.3.8% prior to recession (See RED ARROWS on chart). These both took 7 – 10 months to play out with a 10 – 42 bps increase to be established before recession hit. This is very similar to today’s levels which are at 7 months and 40bps of an increase with the 8th month being released this Friday 6th October 2023 which should be very revealing.
We are now well armed with an historical chart as a reference point for any upcoming Unemployment Rate figures released in coming months. We know we have surpassed the averages in terms of timeframe (7 months) and the 40 bps increase is above the avg. 33.5 bps. We can refer back to this chart using Trading View, press play and see if we are breaching the max pre-recession level of 4.11% (the 71bps move) or other extreme pre-recession levels such as the dot.com and GFC Unemployment Rates (both marked on the chart). And if you don’t frequent the chart on trading view I will update you here regardless.
Lets see what Friday brings….
PUKA
Economy

10 year yields and jobless claimsHas US initial jobless claims (adjusted for total population) ever been this low?
Precious metals will flip current head winds into tail winds once US initial jobless claims enter their secular bull cycle.
Still very early.
#Gold #Silver #CrudeOil #Uranium #Miners #Inflation

Market double topInteresting how Total Market formed a double top in a rising wedge formation, which we know has to correct. So the massage is probably more downside coming.

This time will be different“The investor who says, ‘This time is different,’ when in fact it’s virtually a repeat of an earlier situation, has uttered among the four most costly words in the annals of investing.”

🏘 Housing Bubble v 2.0: What Does It Mean for US Stock MarketMuch to the chagrin of would-be homebuyers, property prices just keep rising. It seems nothing - not even the highest mortgage rates in nearly 23 years — can stop the continued climb of home prices.
Prices increased once again in July, according to the latest S&P CoreLogic Case-Shiller home price index , with 19 out of 20 markets measured showing month-over-month gains. In another reflection of ongoing increases, the National Association of Realtors (NAR) says more than half of U.S. metro areas registered home price gains in the second quarter of 2023.
So much for the idea that a "housing recession" would reverse some of the outsized price gains in homes. The U.S. housing market had finally started slowing in late 2022, and home prices seemed poised for a correction. But a strange thing happened on the way to the housing crash: Home values started rising again.
NAR reports that median sale prices of existing homes are near record highs. Home prices in August 2023 rose 3.9 percent year-0ver-year to reach $407,100 — near the all-time-high of $413,800, and only the fifth time any monthly median has eclipsed the $400,000 mark since NAR began keeping records.
The housing recession is essentially over, or has just began!?
Home values have held steady even as mortgage rates have soared past 7 percent, reaching their highest level in more than 20 years in August. The culprit is a lack of housing supply. Inventories remain frustratingly tight, with NAR’s August data showing only a 3.3-month supply.
30-Year Fixed Mortgage Interest Rates Turn Higher, as 200-Month SMA Key Resistance was broken earlier in 2022.
Average Annual Mortgage Interest. 30 000 U.S. Dollars Rubicon is at the hands.
After the Federal Reserve’s meeting in June, Fed Chairman Jerome Powell told reporters he was keeping a close eye on the housing market.
"Housing is very interest-sensitive, and it’s one of the first places that’s either helped by low rates or held back by higher rates," - Powell said in the press conference.
"We’re watching that situation carefully."
Housing economists and analysts agree, regardless, that any market correction is likely to be a modest one. No one expects price drops on the scale of the declines experienced during the Great Recession.
Is the housing and stock markets are going to crash?
The last time the U.S. housing market looked so frothy was back in 2000s. Back then, home values crashed with disastrous consequences. When the real estate bubble burst, the global economy plunged into the deepest downturn since the Great Depression. Now that the housing boom is threatened by skyrocketing mortgage rates and a potential recession so buyers and homeowners are asking a familiar question: Is the housing market about to crash?
5 reasons ("cast in bronze") there will be no housing market crash
1. Inventories are still very low.
2. Builders didn’t build quickly enough to meet demand.
3. Demographic trends are creating new buyers.
4. Lending standards remain strict and impose tough standards on borrowers.
5. Foreclosure activity is muted: In the years after the housing crash, millions of foreclosures flooded the housing market, depressing prices, and it’s nothing like it was two decades ago.
Funny, but all of that adds up to the one only consensus: Yes, home prices are still pushing the bounds of affordability. But "Ooh not", this boom shouldn’t end in bust. 😏
History does not repeat itself. But often rhymes.
Technical graph for ECONOMICS:USSFHP - U.S. Single Family Home Prices illustrates there has been a while, without new all time highs in Top Four U.S. Stock market indices while Housing Bubble was exist in 2000s.
So lets see, will be the same in 2020s or not, while 2023 is a second straight year without new all time peaks in S&P500 SP:SPX , in Nasdaq-100 NASDAQ:NDX , in Dow Jones Index AMEX:DJIA as well as in Russell 2000 Index TVC:RUT

Qualitative Fundamental Analysis of US Economy Oct.2023The most important factor for the economy is the behaviour of GDP. Several economic indicators are tracked to determine the overall economic situation and GDP growth.
A technical recession is defined as 2 consecutive quarters of negative real GDP.
If GDP grows less than 3% on average for the year, the economy is not growing fast enough and this will lead to unemployment.
At its core, the Federal Reserve has dual mandate policy: price stability(2% inflation for a year) and maximum employment (max Unemployment rate 4%) .
CPI Inflation projection: inflation is forecast at 4.7% in 2023 and is expected to further slow down to 3.0% in 2024.
Actual CPI : 3.7 %
PCE Inflation projection: inflation to be 3.3 percent in 2023, 2.6 percent in 2024, and 2.2 percent in 2025, and the Federal Reserve expects a similar outlook of 3.3 percent, 2.5
Actual PCE : 3.5%
Unemployment rate projection: The unemployment rate reaches 4.1 percent by the end of 2023 and 4.7 percent by the end of 2024 before falling slightly, to 4.5 percent, in 2025.
Actual: 3,8%
GDP Growth projection: Real GDP increases by 1.5 percent in 2024 and by 2.4 percent in 2025.
Actual: 2,4%
Interest rates projection:The Fed now expects its benchmark federal funds rate to close out 2024 at an effective rate of 5.1%, which is higher than its June forecast of 4.6%
Interest rates: 5.5%
MONEY MARKET
Yields
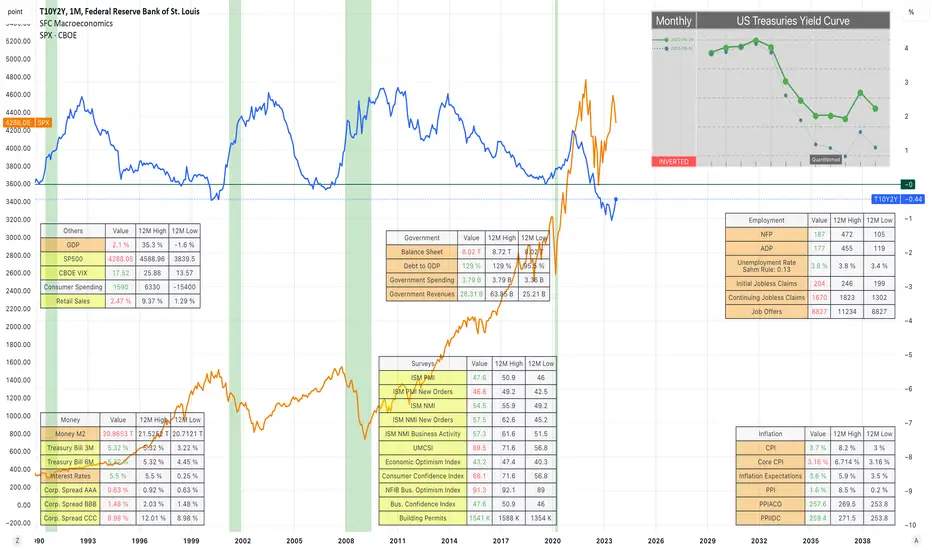
From the chart above we can see when the recession is coming. The 10Y-2Y has already fallen below 0 and we should prepare for a recession when it comes above 0.
The yield curve (all yields) is slightly inverted, but only because of the 20-year yields. The overall curve is normal, which means that investors are not worried about the future, at least for now and they invest more in long-term bonds.
According to the FED, we should expect a mild recession at the end of this year.
The SP500 seems to be consolidating for the next few months.
Corporate Bonds and Credit Spread
Spreads are relatively stable. They do not point to a recession.
Money Supply M2
The money supply is also stable, which means that the printer is not running. This is a good sign considering the banking crisis.
interest rates
The last time IR was so high was during the last recession in 2008. History could repeat itself. At the last FOMC meeting, the FED paused rates but said they would remain high. This could be exactly what happened in 2007. FED paused after aggressive hike and recession came.
SERVEYS
ISM PMI, NMI
The historical correlation between real GDP growth and the ISM PMI/NMI is 85%. PMI/NMI are leading indicators and they will predict how GDP will move. It is a short to long term prediction (within 12 months).
The reading continued to point to another albeit smaller deterioration in the manufacturing performance, as contractions in output and new orders softened. Meanwhile, sufficient stocks of inputs and finished items, alongside still subdued demand, led firms to reduce their purchasing activity sharply again and firms continued to work through inventories in lieu of expanding their input buying, which contributed to a further improvement in supplier performance.
Consumer Sentiment Index(UMCSI)
The level of consumer confidence in stability and future prospects can be used to understand the overall trend in the economy.
Still, consumers are unsure about the trajectory of the economy given multiple sources of uncertainty, for example over the possible shutdown of the federal government and labor disputes in the auto industry.
From a technical perspective the chart looks very suspicious. Like bullback before the new swing. Will see.
Building Permits
The jump in permits suggested that new construction continues to thrive, driven by a shortage of homes available in the market, despite the dampening effect of rising mortgage rates on housing demand.
NFIB Business optimism index
Twenty-three percent of small business owners reported that inflation was their single most important business problem, up two points from last month. Also, the number of small business owners expecting better business conditions over the next six months declined (seven points from July to a net negative 37%). “With small business owners’ views about future sales growth and business conditions discouraging, owners want to hire and make money now from strong consumer spending,” said NFIB Chief Economist Bill Dunkelberg. “Inflation and the worker shortage continue to be the biggest obstacles for Main Street.
Overall the business is not optimistic for the near future.
Leading Economic Index
The Leading Economic Index provides an early indication of significant turning points in the business cycle and where the economy is heading in the near term.
The US LEI continues to signal a recession. Combined with the yield curves, it looks like a recession could be coming very soon.
INFLATION
Total Inflation = 30% CPI (demand) + 40% PCE(supply) + 30% other factors)
CPI
The FED's target may be 2%, but the reality is that inflation is between 2-4%. Inflation has risen again in recent months and current oil prices suggest that it will remain high.
Investors are worried about future prices. The same thing happened in the 80s. The FED does not want the same to happen today, which is why they have been so hawkish recently.
Core CPI
This projection is very scary, but if the economy goes crazy, it can happen, just like in the 80s. I am not predicting that core CPI will rise that much, just pointing out the similarity.
PCE Inflation
The US personal consumption expenditure price index rose 3.5% year-on-year in August 2023, the most in four months, after an upwardly revised 3.4% rise in July and in line with market expectations.
PPI / Core PPI
The producer price inflation in the United States accelerated to 1.6% year-on-year in August 2023. This is the second consecutive month.
GOVERNMENT
Balance sheet
The balance sheet is falling, which is deflationary. On the one hand, this is good and gives us an indication that inflation should be contained, but on the other hand, it is a sign of recession.
[b ]Cyclical Commodities
Trade weighted US Dollar Index
Rising trade indices are actually deflationary for the economy.
Commodities
They stable prices do not give us a clear picture of the near future.
Stocks
The benchmark indices are falling. The failed to make new HH, suggesting that the will consolidate or fall.
Sometimes they are seen as a leading indicator of future GDP and recession.
Summery
The current pause in interest rates, with the hawkish narrative that rates will stay high for a long time, could be the second phase of the business cycle. The next one is recession.
Yield curves have also suggested that the recession is not as far away as we think.
The surveys are relatively stable, but the overall picture is not so optimistic.
Inflation is on the rise again, which may lead the FED to be more aggressive. They have said many times that they would rather have a recession than a price explosion. They have even warned about a mild recession, how mild we will see.
The unemployment rate is still below 4%, but in recent months it has risen from 3.5% to 3.8%. Rising unemployment is a sign of recession.
Stock indices have risen in recent months, but future expectations of a new recession, combined with high interest rates and business optimism, are bearish factors for the stock market.
Adding a few more equations to the mix.
Now, if M2SL increases and M2V... guess where #GDP will go?
But remember, when #Wages go up, #Yields go up, #PurchasingPower goes down, this fuels nominal GDP.
Rate of change for those three is same as late 1960 & 1970s.
#gold #crudeoil

Important Index for investorsImportant index for investors
This index will show you interest rate, world food price, US Oil, unemployment rate, inflation rate

Finally Figured out how to make the 10Y-2Y yeild curve inversionLink: www.tradingview.com
your welcome! #WAGMI

Higher US Interest & Lower Dollar, Why?higher US rates, the US dollar should be trading higher. But inversely, the US dollar became weaker since September last year.
In today’s tutorial, we will discuss what is the cause of a weaker US dollar and the future of the US dollar; despite US interest rates could go higher than expected.
Bond trading:
• US Treasury Bond futures
Minimum fluctuation: 1/32 of one point (0.03125) = $31.25
Code: ZB
• 10-Year T-Note
Minimum fluctuation: 1/2 of 1/32 of one point (0.015625) = $15.625
Code: ZN
• 5-Year T-Note
Minimum fluctuation: 1/4 of 1/32 of one point (0.0078125) = $7.8125
Code ZF
• 2-Year T-Note
Minimum fluctuation: 1/8 of 1/32 of one point (0.00390625) = $7.8125
Code ZT
Disclaimer:
• What presented here is not a recommendation, please consult your licensed broker.
• Our mission is to create lateral thinking skills for every investor and trader, knowing when to take a calculated risk with market uncertainty and a bolder risk when opportunity arises.
CME Real-time Market Data help identify trading set-ups in real-time and express my market views. If you have futures in your trading portfolio, you can check out on CME Group data plans available that suit your trading needs www.tradingview.com

Yield curve prediction for 2024I feel we have 107 days to ride the bull market starting next week, if govt. shutdown is not happening. Lets ride the bull. :)

Money Supply Contraction Means What?If you have seen the general news that M2 Money Supply is contracting at the greatest rate in 50 years, then you may be wondering why it is happening and what it means. I hope you do, at least.
Money Supply is a general term that means the total money available to an economy in the form of cash money in the bank plus loans and short term deposits sitting in banks. It is the purest measure of "gas in the tank" for the economy.
If you are going on a long trip (economic growth), it is also helpful to have a tankful of gas to get you there. If you don't have it now, then clearly you will have to stop and get gas along the way.
The economy needs money the way we need air to breath, unless we revert to trading goods and services with each other and we all know that isn't easy at all. It is hard to "make change" in case the trade doesn't balance perfectly.
Either way, the amount of money in the system turns over a certain amount of times per year and that is called "velocity". The velocity of money is the fudge factor to figure the size of the economy and the amount of money in the economy. Obviously, it is very difficult to track as some money gets spent a hundred times or more and other money gets spent once or twice. It is constantly changing.
Net-net though, the quantity of money is the most common way of understanding what inflation "will do" in the future and has been extremely helpful. For now, the indicator points to lower inflation if not deflation in the coming months and quarters. It will take care of itself.
Cheers,
Tim
2:16PM EST Sep 27, 2023

Federal Reserve Balance Sheet SnapshotFederal Reserve Balance Sheet Snapshot
- Between the 11 - 18th Sept 2023 we had the Largest
one week decline of approx. $74.7 billion since the
balance sheet reduction started in April 2022
- We are currently approx. $50 billion away from a
1 trillion reduction 👀
We are in for an interesting Quarter end to the 2023 year, that is to say the least.
Stay Nimble
Puka

SRILANKA TOURIST ARRIVALS PROJECTION FOR 4TH QUARTERTourism has recently played a significant role in Sri Lanka's economy, particularly following the country's default and economic crisis. After experiencing a dramatic decline in tourist arrivals during lockdowns and the pandemic, there has been a steady increase in visitors since September 2022. The winter season has historically been a crucial driver of Sri Lanka's tourism, with the fourth quarter of each year consistently achieving peak levels of visitors over the past decade.
Between 2013 and 2019, the country witnessed strong tourism peaks, ranging from 153,000 to 253,000 arrivals, with a consistent mid-range of approximately 180,000 to 224,000. Considering this historical performance, it is reasonable to assume that the fourth quarter of 2023 will once again reach peak levels within the range of 180,000 to 224,000 visitors.
This projection and the anticipated performance numbers will provide valuable support to the tourism sector and contribute to the overall economic recovery of Sri Lanka in the fourth quarter of 2023.

Turkey's big housing problemTurkey is selling real estate for a passport, you could be a Turkish citizen If you bought 400.000$ It was 250.000$ at the beginning and you only need this flat for 3 years.
Right now, Turkey is might be most expensive place in Europe due to interesting economic decisions, expats even leaving Turkey because of that, rents are expensive, food is expensive, energy is expensive.
Turkey is no more a holiday destination because of that, Egypt took that this year.
Turkish is plunging against the dollar, central bank doesn't have even a penny.
Interest rates are 30 right now even low when you compare with real inflation.
There will be huge regrets till USA started to print money but Turkey's problems might not so easily.

US Housing flashing a warning Lower Low in price First time since the doldrums in 2011
The cost of a 30 year mortgage is astronomical
Mortgage demand has frozen ...
Refinancing has also fallen off a cliff
I'm looking for sellers to start capitulating soon ... (as in within the next few quarters)
As we start to see the consumer at breaking point.

Month on Month US Inflation Harmonically Set to Rise to 1.94%This is a followup to this year-on-year inflation chart idea posted back in June 2022:
The YoY US Inflation rate has been on a trend of going down since it tested the 1.414 PCZ of the Bearish Butterfly above, but recently we have seen the MoM rate slow its descent and form a bottoming pattern with MACD Hidden Bullish Divergence at the 200-Month SMA and now we can see that the MACD has crossed positively as the inflation rate has broken out of its recent range. This harmonically puts it into position where we will likely see it at least hit the 0.886 retrace to complete a small bat pattern, but it could go out of control and go as high as the 1.618 Fibonacci Extension area all the way at about 1.94%.
One reason I suspect for the sudden stop of the inflationary decline is due to the Fed not raising rates high enough, fast enough, and then keeping them the same for the last few months. It would also seem that the year-on-year inflation rate is setting up for a similar rise, showing Hidden Bullish Divergence at the Moving Averages and likely one that will result in it going to test higher highs to around its 1.414-1.618 PCZ once area once more before ultimately crashing back down from these highs once the Fed starts to go heavy on rate hikes again. Though the timeframe may be shorter than how it is presented on the chart, I do still suspect we will have action resembling what is projected on the chart below until the Fed starts rising rates aggressively again:
This does not mean I think stocks will go up, that the dominance of the dollar will go down, or even that I think the consumer credit situation will improve. Instead, I think the rise in inflation will be fueled by energy, import, and export costs, and that this will be very bad for: Stocks, Consumers, REITs, and Banks overall, and that the Bond Yields will continue to rise at an accelerated rate.

Choosing Your Inflation Tracker: Core CPI or CPICore CPI vs CPI - Some say core CPI is a better benchmark compare to CPI data to track inflation.
Knowing which way CPI inflation is going, it will sharpen our investment decision?
If CPI inflation is still trending up, majority of stocks will be under pressure. However, there will be other sectors will benefit from a rising inflation.
In this tutorial, we will discuss what are these inflation sectors and how we can invest or trade in them? And core CPI vs CPI, which one, we should be spending our time tracking.
3 types of crude oil for trading:
• Crude Oil Futures
0.01 per barrel = $10.00
Code: CL
• E-mini Crude Oil Futures
0.025 per barrel = $12.50
Code QM
• Micro WTI Crude Oil
0.01 per barrel = $1.00
Code MCL
Disclaimer:
• What presented here is not a recommendation, please consult your licensed broker.
• Our mission is to create lateral thinking skills for every investor and trader, knowing when to take a calculated risk with market uncertainty and a bolder risk when opportunity arises.
CME Real-time Market Data help identify trading set-ups in real-time and express my market views. If you have futures in your trading portfolio, you can check out on CME Group data plans available that suit your trading needs www.tradingview.com

LIQUIDITY MATTERS! Global liquidity vs #BitcoinLook at how the bullish green arrows and bearish red arrows show how global liquidity correlates HEAVILY with the direction of Bitcoin. T
You don't have to be a genius to see how beautiful this correlation is.
And how sensitive #BTC is to excess capital in the system.
As a risk on asset
When ppl have easy money to gamble with , a portion of that ends up in the #Crypto markets.
Currently you can see how aggressive the withdrawal of liquidity is across the globe
In the USA, EU, China & Japan.

MACRO MONDAY 10~ Interest Rate & S&P500MACRO MONDAY 10 – Historical Interest Rate hike Impact on S&P500
This chart aims to illustrate the relationship between the Federal Reserve’s Interest rate hike policy and the S&P500’s price movements.
At a glance the chart highlights the lagging effects of the Federal Reserves Interest Rate hikes on the S&P500 (the “Market”). In all four of the interest rate hikes over the past 24 years the S&P500 did not start to decline until 3 months into an interest the rate pause period (at the earliest) and in 3 out of 4 of the interest rate pauses there was a 6 – 16 month wait before the market begun to turn over. The move to reducing interest rates (after a pause period) has been the major warning signal for the beginning or continuation of a major market decline/capitulation. We might have to wait if we are betting on a major market decline.
In the chart we look particularly at the time patterns of the last two major interest rate hike cycles of 2000 and 2007 as they offer us a framework as to what to expect in this current similar hike cycle. Why is this cycle similar to 2000 & 2007?.. because rates increased to 6.5% in 2000, 5.25% in 2007 and we are currently at 5.50% in 2023 (sandwiched between the two). These are the three highest and closely aligned rate cycles over the past 24 years. The COVID-19 crash is included in this analysis but has not been given the same attention as the three larger and similar hike cycles 2000,2007 & 2023.
The Chart
We can simplify the chart down to FIVE key points (also summarised hereunder):
1. Previously when the Federal Reserve increased interest rates the S&P500 made significant
price gains with a 20% increase in 2000 and a 23% increase in 2007.
- Since rates started increasing in February 2022 we have seen the S&P500 price make a
sharp decline and then recover all those losses to establish an increase of 5% at present
since the hiking started.
- This means all three major interest hike cycles resulted in positive S&P500 price action.
- For reference, a more gradual rate hike pre COVID-19 also resulted in 20%+ positive price
action.
2. When the Federal Reserve paused interest rates in 2000 it led to a 15% decline in the
S&P500 and then in 2007 it led to a 28% increase in the S&P500. It is worth noting that a
lower interest rate was established in 2007 at 5.25% versus 6.5% in 2000. This might
indicate that this 1.25% difference may have led to an earlier negative impact to the
market in 2000 causing a decline during the pause phase. Higher rate, higher risk of
market decline during a pause.
- At present we are holding at 5.5% (between the 6.5% of 2000 and the 5.25% of 2007).
3. In the event that the Federal Reserve is pausing rates from hereon in, historic timelines of
major hike cycles suggest a 7 month pause like in 2000 or a 16 month pause in line with
2007 (avg. of both c.11 months). For reference COVID-19’s rate pause was for 6 months.
- 6 - 7 months from now would be March/April 2024 and 16 months from now would be
Nov 2024 (avg. of both Jun 2024 as indicated on chart).
4. As you can see from the red circles in the chart the initiation of Interest rate reductions
have been the major and often advanced warning signals for significant market declines,
including for COVID-19.
5. It is worth considering that before the COVID-19 crash, the interest rate pause was for 6
months from Dec 2018 – Jun 2019. Thereafter from July 2019 rates begun to reduce (THE
WARNING SIGNAL from point 4 above)…conversely the market rallied hard by 20% from
$2.8k to $3.4k topping in Feb 2020 at which point a major 35% capitulation cascaded over
6 weeks pushing the S&P500 down to $2,200. Similarly in 2007 the rates began to decline
in Aug 2007 in advance of market top in Oct 2007. A 53% decline followed. The lesson here
is, no matter how high the market goes, once interest rates are decreasing it’s time to be
on the defensive.
Summary
1. Interest Rate increases have resulted in positive S&P500 price action
2. Interest rate pauses are the first cautionary signal of potential negative S&P500 price action however 2 out of 3 pauses have resulted in positive price action. The higher the rate the higher the chance of a market decline during the pause period.
3. Interest rate pauses have ranged from 6 to 16 months (avg. of 11 months).
4. Interest rate reductions have been the major, often advanced warning signal for significant and continued market decline (red circles on chart)
5. Interest rates can decrease for 2 to 6 months before the market eventually capitulates.
- In 2020 rates decreased for 6 months as the market continued its ascent and in 2007
rates decreased for 2 months as the market continued its ascent. This tells us that
rates can go down as prices go up but that it rarely lasts with any gains completely
wiped out within months.
September – The Doors to Risk Open
We now understand, as per point 2 above, that an Interest rate pause is the first cautionary signal of potential negative S&P500 price action. Should the Fed confirm a pause in September 2023 we will clearly be moving into a more dangerous phase of the interest rate cycle.
Based on the chart and subject to the Fed pausing interest rates from September 2023 we can now project that there is a 33% chance of immediate market decline (within 3 months) when the pause commences with this risk increasing substantially from the 6th and 7th month of the pause in March/April 2024.
I have referenced previously how the current yield curve inversion on the 2/10 year Treasury Spread provided advance warning of recession/capitulation prior to almost all recessions however it provided us a wide 6 - 22 month window of time from the time the yield curve made its first definitive turn back up to the 0% level (See Macro Monday 2 – Recession Timeframe Horizon). Interestingly September 2023 will be the 6th month of that 6 – 22 month window.
Both todays chart and Macro Monday 2’s chart emphasize how the month of September 2023 opens the door to increased market risk. Buckle up folks.
March/April 2024 – Eye of the Storm
On Macro Monday 2 – Recession Timeframe Horizon our average time before a recession after the yield curve starts to turn up was 13 months or April 2024 (average of past 6 recessions using 2/10Y Treasury Spread).
From today’s review of the Interest rate hikes impact on the S&P500, we have a strong indication that March/April 2024 will be key high risk date also.
Now we have two charts that indicate that the month of Mar/Apr 2024 will come with significantly increased risk.
Its worth noting a pause could last 16 months like in 2007 lasting until Nov 2024, at which point we would be pretty frustrated if we had been preparing defensively since Mar/Apr 2024. Just another scenario to keep in mind.
The Capitulation Signal
Based on today’s chart, should interest rates at any stage decline we should be prepared for significant market decline with immediate effect or within 2 months (at worst). Regardless of any subsequent increases in the market, these would likely be wiped out within 6 – 9 months by a capitulation. An optimist could run a trailing stop and hope it executes in the event of.
Bridging the Gaps
Please have a look at last week’s Macro Monday 9 – Initial Jobless Claims if you would like to measure risk month to month. The chart is designed so that you can press play and have an idea of the risk level we are entering into on an ongoing basis. In this chart we summarised more intermediate risk levels with Sept-Oct 2023 as Risk level 1 (yield curve inversion time window opens and potential rate pause risk increase) and Nov-Dec 2023 as stepping into a higher Risk Level 2 (as increase in Jobless claims average timeframe will be hit). Should the yield curve continue to move up towards being un-inverted and should Jobless Claims increase then Jan 2024 forward this could be considered a higher Risk level 3 leading the path to our Risk level 4 defined today which is March/April 2024.
Final Word
It is worth noting that the Fed could surprise us and start increasing rates again, they may also not pause interest rates in Sept 2023. For this reason I included the small black and red arrows that provide a general timeline across different rate periods to help us gauge a market top (red arrows) and a market bottom (black arrows). The black arrows suggest a time window of 27 – 32 months from now being the market bottom. A lot of people are focused on when a recession or capitulation will start, we may want to start thinking a step ahead and prepare for the opportunity that will present itself at a market bottom. Having a time window can help us plan and be psychologically prepared to consider taking a position in a market of pain and fear should the timing window align. If we are expecting this bottom in between Oct 2025 and Mar 2026, we can make more rational decisions when the streets are red.
We can try to make more definitive calls and decisions on an ongoing bases so please please do not take any of the above as a guarantee. We know the risk is increasing now and a lot of charts indicate incremental increases in risk up to Mar/Apr 2024, Nov 2024 and even January - March 2025. All of theses dates are possible trigger events but ultimately we don’t know. We are just trying to prepare and read the warning signs on the road as we drive closer to a potential harpin turn.
If you have any charts you want me to look at or think would be valuable to review in the context of the above subject matter please let me know, id love to hear about it.
PUKA

[STUDY] Bond Rates VS Real RatesSplit view showing the previous real rate of Bonds study along now with the actual Bond Yields. This is to gain insight into Demand dynamics for Bonds and what happens to yields when real yields are positive (expectation is that positive real yields will increase demand, reducing supply, and allowing Treasury to increase Bond prices and reduce yields.

[STUDY] Real Rates of BondsA study showing the real rate of returns on the various US Treasuries. Calculated by subtracting the YoY Inflation Rate (released monthly) from the Yield of the Bond. Real Fed Rate also shown for reference. Above 0 makes Bonds and Savings more attractive, aka more Demand for them. Price may increase and yields decrease, encouraging selling. Below 0 provides negative real return, making Bonds and Savings accounts unattractive, reducing demand. Price may decrease and yields increase to stoke demand.

[STUDY] Inflation, Fed Rates, Bond Yields, GDP, OILOverlaying US Inflation, Fed Rates, Bond Yields, GDP, and Oil Price to determine any relationships between them
