Inflation (CPI) - A Battle Already LostInflation ( CPI ) - A Battle Already Lost
I've recently shared my outlook on CPI and where I think its headed in the months ahead but after further review, it seems that I've previously overlooked certain signals which should have altered my perspective in a way that it did not. Based on discovery of those signals, I have now updated my anticipatory CPI chart to highlight certain levels of interest.
As we can see on the wavemap, the Consumer Price Index (a measure of inflation) has broken above its 40+ year bearish trend line. The breakout was very strong and should be considered as very significant. The format of the wave during this breakout has developed as what seems to likely be a zig-zag formation. Noticeably, the upside zig-zag wave has retraced 90% of the 40 year long bearish drawdown. Therefore, leaving little probability of it being a truly corrective wave. Aside from the macro bear trend-line, I have also highlighted the newly respected bullish trend-line.
Finding resistance near 6.77, Fibonacci measurements suggest that the pending action will fall to retest the former price containing trend line and maybe even drop below it. Specifically, Elliott Wave Theory suggests that 0.99-1.01 should be the downside target range. Over the past 20 years, this level has also supplied nearly unbeatable support. If support is once again discovered near 1.00, the currently active wave could then be sent to retest the red bullish trend, at a level near 9-10.
Ultimately, completion of the blue diagonal will signify that the CPI (and inflation) area headed for upside levels that the American economy has never witnessed. Personally, I believe that inflation is a byproduct of capitalism and there is no true containment possible. The next decade will prove to show if this is on point or simply farce.
Economy

Inflation ratelooking back at historical inflationary support levels...inflation remains sticky and you can see why.

SELL S&P 500Only stating to SELL S&P 500 your choice to execute. ONLY EXECUTE IF YOU SEE THIS POST EARLY ENOUGH AS THE PRICE STILL IS AROUND THE SAME PRICE MORE OR LESS. Check out my previous posts to check my accuracy in the comment section.
Comment down below to get notified when to close the trade.

Inflation takes timeInflation has come down from its (FOMC QE, covid legislation, geopolitical unrest) peak. But how long will it take to get back to its baseline since (FOMC QT, divided congress, geopolitical containment) started? Well let's see what the USIRYY chart has to say. USIRYY was 2.6% for March 2021 & peaked in June 2022 at 9.1% so that upside move took 14 months to show up on the chart. But since it was a delayed reaction from the macroeconomic factors that started from covid March / April 2020, that equals 12 months for monetary stimulus to work its way through everything. So, by using simple arithmetic, inflation could come down to its baseline as soon as 13 months from June 2022. Which would mean that at its earliest, USIRYY gets back to its 100 - 200 month moving average by July 2023. Obviously, it seems like it will take a few months longer, but inflation will definitely get back to 3% in 2023 at the very worst.
USIRYY 1 month chart moving averages:
SMA100 = 2.71%
SMA200 = 2.42%

Present and On-Going Forecast Real Estate Market The formula that I worked on for weeks, finally I can put the puzzles together a chart of an ongoing real estate chart and what I provided is an economic formula that's used to adjust the median sales price of houses sold in the US for inflation and mortgage rates. Here's what each part of the formula means in more detail:
MSPUS: This variable represents the median sales price of houses sold in the United States. The median sales price is the price at which half the houses sold for more and half sold for less.
MORTGAGE30US: This variable represents the average 30-year fixed rate mortgage in the United States. A mortgage is a loan that people take out to buy a house, and the interest rate on the mortgage can affect the overall cost of the house over time.
USCPI: This variable represents the United States Consumer Price Index, which is a measure of inflation. Inflation is the rate at which the general level of prices for goods and services is rising, and it can affect the value of money over time.
The formula itself is a bit complicated, but it's essentially using these variables to adjust the median sales price of houses sold in the US for inflation and the impact of mortgage rates. Here's how the formula works:
1+MORTGAGE30US/100 calculates the interest rate on the mortgage, expressed as a decimal.
^0.08333 raises this interest rate to the power of 0.08333, which represents the monthly interest rate.
1+MORTGAGE30US/100)^0.08333-1 calculates the mortgage payment factor, which is the amount by which the median sales price of houses sold needs to be adjusted based on the mortgage interest rate.
1/(1+MORTGAGE30US/100)^0.08333 calculates the present value of the mortgage payments.
(1-(1/(1+MORTGAGE30US/100)^0.08333)^360) calculates the total value of all of these mortgage payments by taking the present value of each payment, summing them over the 360 months of the mortgage, and then subtracting that sum from 1.
USCPI*300 adjusts the value of the expression by the consumer price index multiplied by 300, which accounts for the effects of inflation over time.
MSPUS is then multiplied by the result of steps 3, 5, and 6 to calculate the adjusted median sales price of houses sold.
When you put it all together, the formula is a complex expression that takes into account mortgage rates, inflation, and a value in US dollars, and calculates a value that has been adjusted by these factors, By using this formula, you can get a more accurate picture of the real cost of buying a house over time, which can help them make more informed decisions about the housing market.
The formula that I worked on for weeks, finally I can put the puzzles together a chart of an ongoing real estate chart and what I provided is an economic formula that's used to adjust the median sales price of houses sold in the US for inflation and mortgage rates. Here's what each part of the formula means in more detail:
MSPUS: This variable represents the median sales price of houses sold in the United States. The median sales price is the price at which half the houses sold for more and half sold for less.
MORTGAGE30US: This variable represents the average 30-year fixed rate mortgage in the United States. A mortgage is a loan that people take out to buy a house, and the interest rate on the mortgage can affect the overall cost of the house over time.
USCPI: This variable represents the United States Consumer Price Index, which is a measure of inflation . Inflation is the rate at which the general level of prices for goods and services is rising, and it can affect the value of money over time.
The formula itself is a bit complicated, but it's essentially using these variables to adjust the median sales price of houses sold in the US for inflation and the impact of mortgage rates. Here's how the formula works:
1+MORTGAGE30US/100 calculates the interest rate on the mortgage, expressed as a decimal.
^0.08333 raises this interest rate to the power of 0.08333, which represents the monthly interest rate.
1+MORTGAGE30US/100)^0.08333-1 calculates the mortgage payment factor, which is the amount by which the median sales price of houses sold needs to be adjusted based on the mortgage interest rate.
1/(1+MORTGAGE30US/100)^0.08333 calculates the present value of the mortgage payments.
(1-(1/(1+MORTGAGE30US/100)^0.08333)^360) calculates the total value of all of these mortgage payments by taking the present value of each payment, summing them over the 360 months of the mortgage, and then subtracting that sum from 1.
USCPI*300 adjusts the value of the expression by the consumer price index multiplied by 300, which accounts for the effects of inflation over time.
MSPUS is then multiplied by the result of steps 3, 5, and 6 to calculate the adjusted median sales price of houses sold.
When you put it all together, the formula is a complex expression that takes into account mortgage rates, inflation , and a value in US dollars, and calculates a value that has been adjusted by these factors, By using this formula, you can get a more accurate picture of the real cost of buying a house over time, which can help them make more informed decisions about the housing market.

Gold lagging overall money supplyJust a quick comparison between the gold price and overall money supply. Seems like there may be some catching up to do.

How to Chart Fed LiquidityI'm going to be clearing out some of my half baked ideas.
I don't have a lot of time to write full ideas about them so enjoy the charts and feel free to ask any questions about them if you have any.
I'm going to integrate my TV charts into the website with a daily, weekly, monthly analysis.
website is in my TV profile or find me on twitter.
-----
The Fed Liquidity used in Master of Markets Idea
What is Fed liquidity?
To determine Fed Liquidity you can simple use this ticker
FRED:RESPPANWW-FRED:RRPONTSYD-FRED:WDTGAL
The Total Assets of the Federal Reserve Balance sheet at 8.382 Trillion.
Subtract The Treasury General Account at 451 Billion
Then Subtract the 2.142T Overnight Reverse Repo
You get 5.789 Trillion in Net Liquidity which hasn't come down a heck of a lot since the last time I tallied up 5.9T

The National Debt a generation inheritsWhen I tell my son how much National Debt his generation will inherit.
I have to tell him 31.5 Trillion so far.

TREASURY YIELDS AND THE FED FUNDS RATEThis chart shows the effective federal funds rate in comparison to the 30 year and 3 month yield over the past five years. There are 5 interesting times to look at:
1. Late 2018 long term yields began to peak right before the fed stopped their hiking cycle. Yield curve began to flatten.
2. They then stayed put for about 6 months with the 3MY hovering right around the EFFR. Suddenly, the 3 month yield dips below the fed rate quickly - and they begin dropping their benchmark rate again .
3. Early 2020 the panic of the COVID-19 pandemic caused rates to nose dive and the fed to slash their rate all the way to 0% very quickly.
4. Fed did not raise rates for two years . In early 2022 they began to hike for the first time since 2018. This also coincides with the beginning of the Ukraine conflict.
5. Half a year of steady rate hikes makes it so the EFFR finally passes it's 2018 peak in mid 2022. The 30Y and 30M invert fairly soon after while the fed funds rate overtakes the 30Y yield.
Feel free to discuss what you think of these relations and what your predictions are for the future. In my opinion, the more the yield curve inverts the more problems there will be in the financial system. Eventually, term risk will not outweigh the high short-term yields especially once the benchmark rate gets over the inflation rate. I see the fed doing what they are best ate - acting too late.

10's-2's will be resolved next week. How?Could be 10 yr moves higher and the stock market takes a dive.

Big investor confidence in BBB-rated corporate bondsA tight spread between BBB-rated corporate bonds and government bonds signifies that investors are demanding a lower premium to invest in BBB-rated corporate bonds relative to government bonds. it can be interpreted as a sign of bond investors confidence in the creditworthiness of BBB-rated corporate bonds. From past historical observation a tight spread tend to end badly for the BBB rated corporate bond investors since they have co-aligned with the onset of recessions in the US stock market and an increase of BBB-rated companies who default on their debt.
The spread can provide insight into the credit risk of BBB-rated corporate bonds relative to government bonds and can also indicate the demand for corporate debt by investors. Central banks may monitor this spread as part of their assessment of credit conditions in the economy and the potential risks to financial stability.

Bearish Markets for next 24 months.This idea is based on a recent Kitco News Interview with Harry Dent. If are not familiar with Harry, he is an Contrarian Investor and Author. I have respected Harry's opinion, and more times than not, he is on the money. Pun intended.
From this interview I put together a chart of the S&P 500 with an attempt to convey his forecasts.
He is forecasting an everything bubble burst, and it going to get ugly over the next 24 months. Even Gold wont be a safe haven.
Forecasting Bitcoin to hit a low of $3000. He suggest long term treasury bonds might be the only place to be when it gets ugly.
Buckle up kids, the long term BULL market has officially ended. Its Bear season now!
I put up my trusty fib overlay. If SP500 breaks that the typically strong 61.8 fib resistance, it will likely keeping falling to a full 100 or 110% retracement, based on my interpretation of Harrys Comments. We should begin to see a once in a generation buy zone in late 2024 or early 2025. Until then, go cash, BOND, or short the market. Harry Suggested Credit Investments, which I assume he means banking, credit card and credit industry stocks, and Bonds. He did specifically name 35 year Treasury bonds as an example.
The US economy has been artificially pumped up using the magic of printing currency, trillions of dollars in fact. Which means the dollar has been watered down significantly. History has shown many time over, that this strategy will always eventually fail, 100% of the time! It always ends badly with high inflation, supply issues, countries begin to become very polarized in political opinions, and no one is willing to meet in the middle. The US economy has not been that great, but using smoke and mirrors, and a running the printing presses non-stop, has made it seem otherwise. Eventually it all works it self back to the median. Time to let go of your bullish sentiment and rethink were all the markets and economies are now heading. Time to get ahead of this.

Will Jobs data have to suffer in order to get inflation down ?In the 80's it looks like it took very high interest rates to combat the high inflation in the 1980's. With the GOP looking into stopping Bidens spending habits we may possibly be ready for the unemployment to move up and our economy will do some suffering.
Still, Unemployment is low, and inflation is hot. If the jobs data stay sideways this holds the door open for a more hawkish fed.
The large difference in the 80's is we had Reagan in office, and he was not a senile wimp.
I think the Feds are about to step up their game. So get ready traders!

Brazil gdpGrow up until 2011, decreasing until today, i have a theory, poberty create the perfect scenario for more vertical authoritarian government

Quantitative Tightening. We Have A Long Way To Go.I have previously calculated that it would take the Fed's until 2031 to roll off all of their balance sheets. Based on projected trend, the M2 money supply will continue to go down to levels we haven't seen since 1985. By the time the job is done, there will be only 2.3T of USD in circulation, a decline of 88% in money supply.
Ladies and gentlemen. If this happens, the US dollar would become the best deflationarly asset in history. Even though the cryptomarket, stock market, real estates, bonds and other equities will be crushed into oblivion, you can appreciate that the dollar has redeemed its glory days. In 1985, a new car is around $10,000. A new house is around $82,000. A 2 L bottle of soda is less than a dollar. The great days are coming back! Sell everything and long USD for wealth and prosperity!

Reverse repo is breaking bullish trendThe Overnight Reverse Repos is breaking the bullish trend and slowly coming down.
This means liquidity is coming back to the markets and the overnight FED fixed interest rates is no longer that attractive for the parked capital.

Historical Producer Price Index Monthly Log ChartProducer Price Index (proxy for inflation).
Round 1 is done. Waiting for start of round 2.
Buckle up!
#fintwit #gold #silver #crudeoil #inflation #recession

Total Public Debt versus Debt Held by Foreign InvestorsGuys, if I may chime in. Whenever I see 2 instruments overlaid on a chart, my reflex is to see how they perform vs each other.
You'll often find out that ratio is the Rosetta Stone you were looking for!
#debt #dxy #usdollar #fintwit

Eggs priced in SilverEggs priced in silver breaking out.
Targeting all-time highs.
#EggShortage #Silver #Fintwit

STILL 100 % of track NEXT LEG OF THE BEAR IS ABOUT TO START I am now getting another major sell model long term sp 500 to total Long term bonds is been given in my models I personally have moved into 6 month and 1 year till bills today I manage six large trusts And told my group to shift All funds into insured accounts I will be moving to 50 to 75 % % short on any rally into 4183 and 100 % at 4212/4222 or on a stop of 3988 . sp 500 to bonds ratio is near BELL RINGING now as of today I see the lows of dec and oct taken out I have two targets based on the cycle low projection 3510/3490 . . I came up with in dec 2021. target is 3390/ is the alt the main target is 2785/2985 the decline should be in time cycle march low 2024 and should unfold in another clear 5 waves .. BEST OF TRADES ! WAVETIMER
UK Inflation drop to 5 month low at 10.10% - Still crazy high!The UK inflation rate has dropped to a 5-month low of 10.1%.
This tells us that the peak inflation may be behind us.
The decrease in transport costs, as well as restaurants and hotels, were the main drivers of the lower inflation rate.
However, if we compare it to other developed nations like the US, France, and Germany - the UK's inflation rate is still quite a bit higher.
Now we need to see the Bank of England (BoE) to keep taking action to drop the inflation and interest rates.
I mean an inflation rate of 10% or higher is still crazy!

8 year rate of change for Shelter component of CPICPI "Shelter" Monthly Log Chart seemingly just keeps going up... but the rate of change gives better clues to what is actually happening.

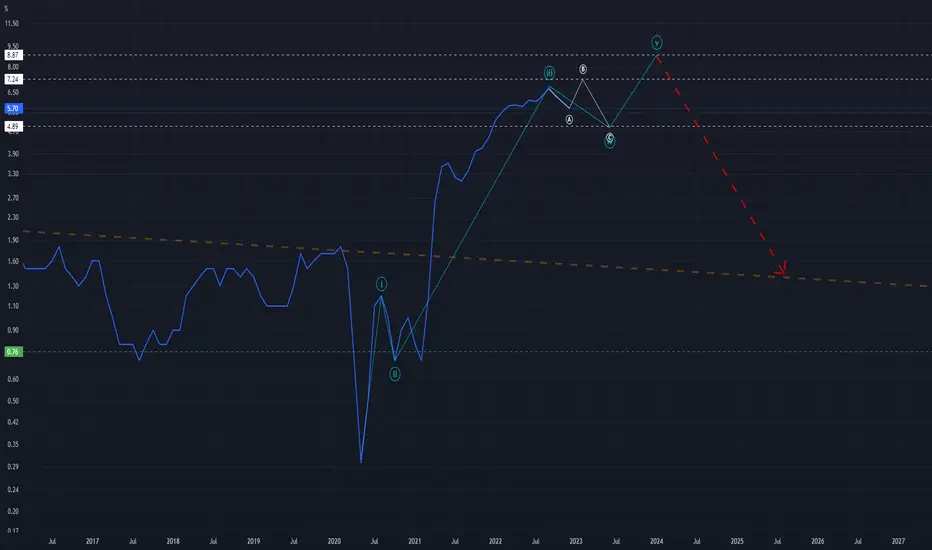
Elliott Wave Science Meets the Consumer Price IndexIt would be awesome if TradingView offered a candlestick chart for CPI but considering its only updated once per month, maybe the line graph/chart is the best option (not sure how that works). As for the data available to me, I've done a best effort markup using the science of Elliott Wave Theory. Considering the fluctuations seen on the M(onthly) chart, I believe its possible that CPI is sitting in the midst of a shallow Wave 4 correction. With this in mind, I find it possible that the number stretches into the low-mid 7.xx range between now and March. From there we may see a 2023 low within the 4.xx level.
I will share my thoughts here as I know there is much interest in "what will the CPI numbers be?"... Being that this CPI data is directly based on the actions of humans and the habits that we act on, it should work pretty well with Elliott Wave Theory. I will keep this post fluid and apply analytical updates as monthly results are publicly announced.
Remember these three important things: 1) trade the chart instead of the news and 2) stay safe /3) don't drown!