$USIRYY -United States CPI (March/2025)ECONOMICS:USIRYY
(March/2025)
source: U.S. Bureau of Labor Statistics
- The annual inflation rate in the US eased for a second consecutive month to 2.4% in March 2025, the lowest since September, down from 2.8% in February, and below forecasts of 2.6%.
Prices for gasoline (-9.8% vs -3.1%) and fuel oil (-7.6% vs -5.1%) fell more while natural gas prices soared (9.4% vs 6%).
Inflation also slowed for shelter (4% vs 4.2%), used cars and trucks (0.6% vs 0.8%), and transportation (3.1% vs 6%) while prices were unchanged for new vehicles (vs -0.3%).
On the other hand, inflation accelerated for food (3% vs 2.6%).
Compared to the previous month, the CPI decreased 0.1%, the first fall since May 2020, compared to expectations of a 0.1% gain.
The index for energy fell 2.4%, as a 6.3% decline in gasoline more than offset increases in electricity (0.9%) and natural gas (3.6%).
Meanwhile, annual core inflation eased to 2.8%, the lowest since March 2021, and below forecasts of 3%.
On a monthly basis, the core CPI edged up 0.1%, below expectations of 0.3%.
Economy

$CNIRYY -China's CPI (March/2025)ECONOMICS:CNIRYY
March/2025
source: National Bureau of Statistics of China
- China's consumer prices fell by 0.1% year-on-year in March 2025, missing market expectations of a 0.1% increase and marking the second consecutive month of drop, as the ongoing trade dispute with the U.S. threatens to exert further downward pressure on prices.
Still, the latest drop was significantly milder than February’s 0.7% fall, supported by a smaller decline in food prices as pork prices accelerated and fresh fruit costs rebounded.
Meanwhile, non-food prices rose by 0.2%, reversing a slight dip of 0.1% in February, driven by increases in housing (0.1% vs 0.1%), healthcare (0.1% vs 0.2%), and education (0.8% vs -0.5%), despite a continued decline in transport costs (-2.6% vs -2.5%).
Core inflation, which excludes volatile food and fuel prices, rose 0.5% in March, rebounding from a 0.1% decrease in February. On a monthly basis, the CPI declined by 0.4%, a steeper fall than a 0.2% drop in February, marking the second straight month of contraction.

4/8/25 - one more i keep staring at. i'll keep it short!One more from me tonight, friends,
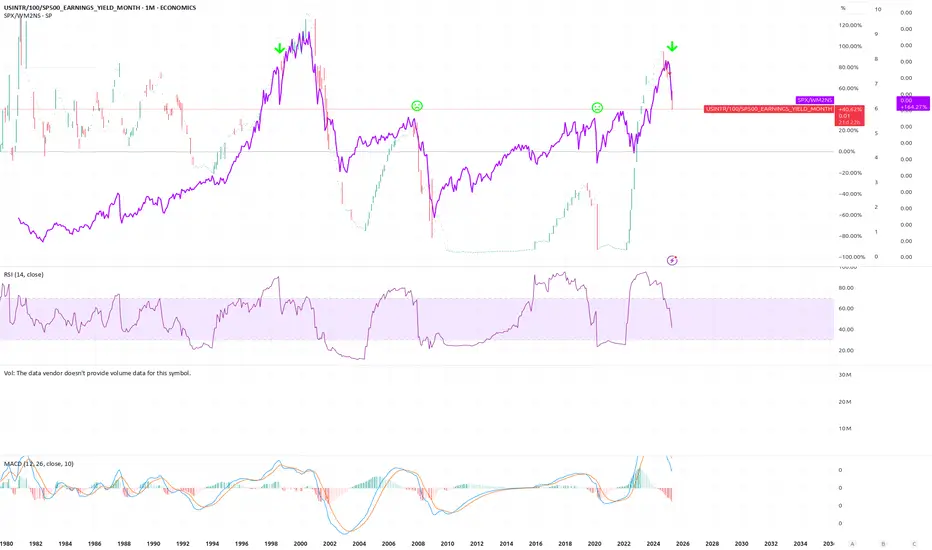
I keep staring at this chart which plots (the scatter-like print) ST rates vs. S&P earnings yield and also shows the S&P adjusted by M2 (purple).
I believe one or the other is likely true.
1/ we're in the middle of a mega bull run that began in '09 and never really ended, given low rates, tons of tech-led innovation (with cash flows) and the current correction is a pause (similar to the GREEN ARROW in '98) before continuing much higher and with rates remaining high and potentially even headed incrementally higher as stocks climb the wall of worry.
2/ we're undergoing a WTF growth scare, a geopol reordering, inability to look through for many months (or even a year) and causing such a financial meltdown that rates will be forced to head back to zero and stocks maybe undergo another 20-30% lower (the FROWNY FACES).
My guess is it's #1.
- the current spat is Trump-induced.
- it's not a meltdown of credit markets (well... yet...)
- there's not a fake _____ (event of any sort) causing freak out
- and also... unlike dotcom, which ran HARD, we've had some pullbacks along the way in this recent multi-year run, testing the thesis... notably mar '20 and end '22. these tech leaders are v cash generative and there's a good reason to believe they'll continue to gain strength
all this would translate into a massive run into '28, if #1 is correct.
so now that we're in pure correlation 1, margin call territory etc. etc. we have the "can't look through, need help or some resolution event"
so once that resolution comes. we probably boot, rally, retest. and rip.
hard to do this on leverage b/c V might not be the shape of recovery (at least that's not how i'd play it, i still prefer to use deep ITM LEAPS for some flex)
but let's see.
this chart has my attention once again.
V
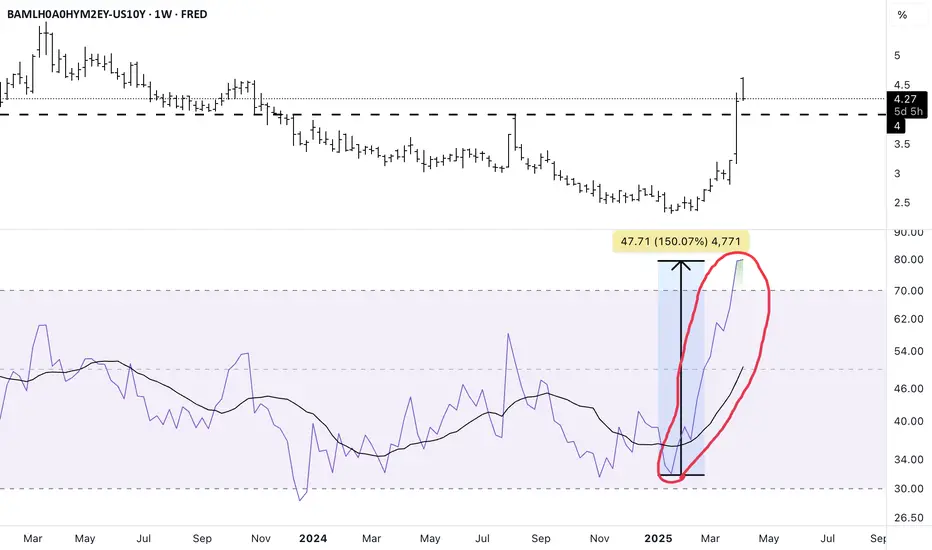
The strength in the move in credit spreads is thought provokingThe strength of the move in credit spreads since the week of Jan 20th is really unusual. Even during Covid when spreads really widened in a short amount of time the "strength" of the move doesn't compare to what we are witnessing right now with this move.
One comparable timeframe Is June 2007-July 2007. The move in the RSI in credit spreads is what STARTED the great financial crisis. After this huge move happened spreads rose for the next 73 weeks or a little under a year and a half making higher highs and higher lows.
Another comparable timeframe is May 2002-July 2002; Spreads had already been making higher highs and higher lows; were already above 4; and then this move is what ENDED the dot.com bubble.
It is not the absolute values in debt that matter.It is not the absolute values in debt that matter.
It is the accelerations and decelerations that create capital rotation events (or are seen at capital rotation events).
Right now, the rate of change is nothing out of the ordinary, ready for its next acceleration.

Recession indicatorUS Federal Fund's Rate - US 2-Year T-Bond Yield
Only two times since 1989 this indicator has hound a ceiling at 2. We've been living the third time for some months now.
However, no indications of an incoming recession whatsoever (?)

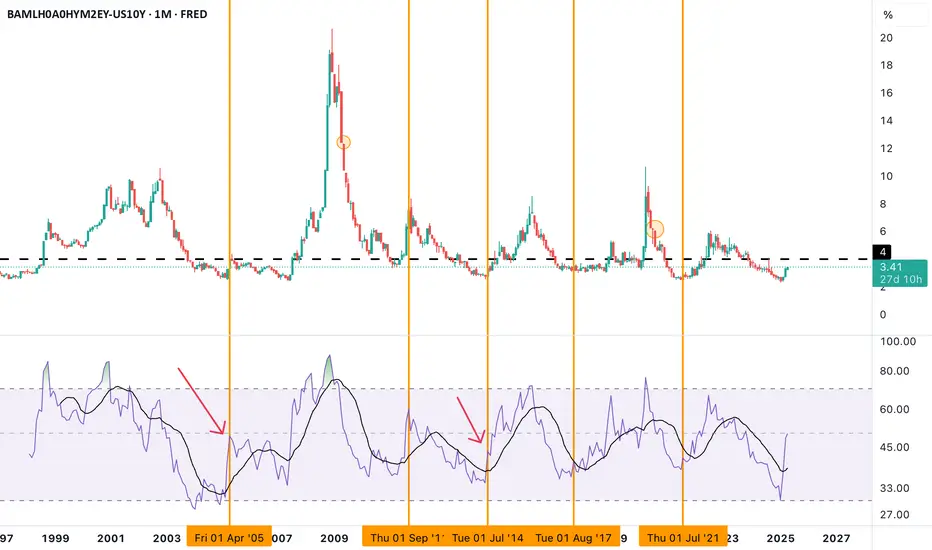
Spike in Credit Spreads continues...As I wrote on March 4th after February monthly closing...the RSI on credit spreads made a higher high with Feb closing which indicates a change from a down trend in credit spreads to an uptrend; which is not good for risk assets.
Now that March has closed; you will see yet another spike in the RSI to close at another higher high. This spike in RSI is actually rather large even though credit spreads are still less than 4.
I've seen a lot of people on X laughing at people who have mentioned that credit spreads are "spiking" because when you look at the graph of credit spreads they still below 4 and do not appear to be spiking.
Here's the thing...when spreads do spike you will be late to the party!
So what happens when spreads get to 4? Do they do what they did in 2005 or 2014? The answer to this question will dictate how the market will react in the short term.
Eventually however spreads will blow up...it's not an if but a when once RSI changes over to an uptrend.
$EUIRYY -Europe CPI (March/2025)ECONOMICS:EUIRYY
March/2025
source: EUROSTAT
- Annual inflation in the Euro Area eased to 2.2% in March 2025,
the lowest rate since November 2024 and slightly below market expectations of 2.3%.
Services inflation slowed to a 33-month low (3.4% vs. 3.7% in February),
while energy costs declined (-0.7% vs. 0.2%).
However, inflation remained steady for both non-energy industrial goods (0.6%) and processed food, alcohol & tobacco (2.6%), and unprocessed food prices surged (4.1% vs. 3.0%).
Meanwhile, core inflation, which excludes volatile food and energy prices, fell to 2.4%, slightly below market forecasts of 2.5% and marking its lowest level since January 2022.
On a monthly basis, consumer prices rose 0.6% in March, following a 0.4% advance in February.

Tweet and ideaYou can use tweet and idea on ideas. For example, you can use Elon Musk tweets and ideas GameStop’s Bitcoin Bet Fails to Wow Traders.

Tweet and ideaYou can use tweet and idea on ideas. For example, you can use Elon Musk tweets and ideas GameStop’s Bitcoin Bet Fails to Wow Traders.

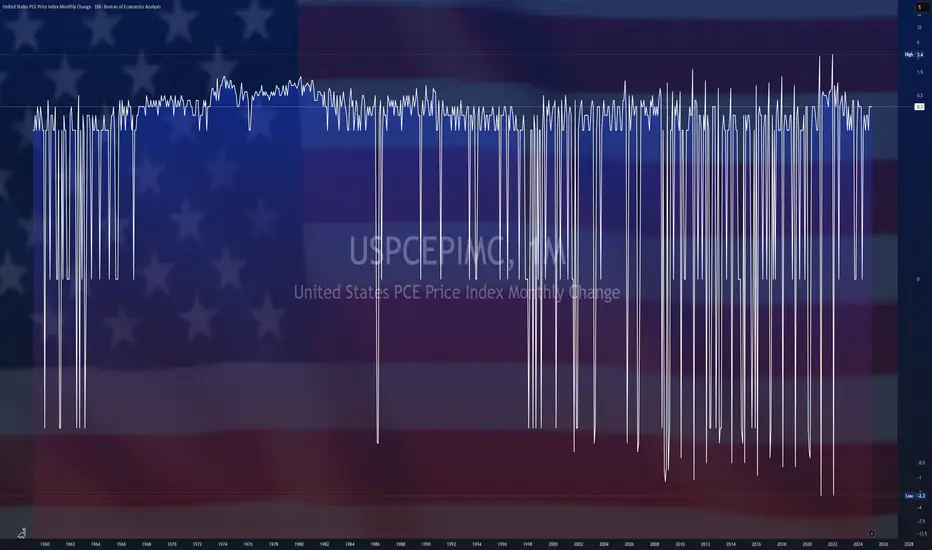
$USPCEPIMC -U.S Core PCE Inflation Rises More than ExpectedECONOMICS:USPCEPIMC
(February/2025)
source: U.S. Bureau of Economic Analysis
- The US PCE price index rose by 0.3% month-over-month in February, maintaining the same pace as the previous two months.
The core PCE index increased by 0.4%, the most since January 2024, surpassing the forecast of 0.3% and up from 0.3% in January.
On a year-over-year basis, headline PCE inflation remained steady at 2.5%, while core PCE inflation edged up to 2.8%, above the expected 2.7%.

$GBIRYY -U.K Inflation Rate (February/2025)ECONOMICS:GBIRYY
February/2025
source: Office for National Statistics
- The annual inflation rate in the UK fell to 2.8% in February 2025 from 3% in January, below market expectations of 2.9%, though in line with the Bank of England's forecast.
The largest downward contribution came from prices of clothing which declined for the first time since October 2021 (-0.6% vs 1.8%), led by garments for women and children's clothing.
Inflation also eased in recreation and culture (3.4% vs. 3.8%), particularly in live music admission and recording media, as well as in housing and utilities (1.9% vs. 2.1%), including actual rents for housing (7.4% vs. 7.8%).
In contrast, food inflation was unchanged at 3.3% and prices rose faster for transport (1.8% vs 1.7%) and restaurants and hotels (3.4% vs 3.3%).
Meanwhile, services inflation held steady at 5%.
The annual core inflation rate declined to 3.5% from 3.7%.
Compared to the previous month, the CPI increased 0.4%, rebounding from a 0.1% decline but falling short of the expected 0.5% increase.

How to Track Inflation NumberHow to track inflation number?
When the Fed mentions their 2% inflation target, are they referring to the commonly published CPI that we often read about, or are they referring to Core CPI or Core PCE?
10-Year Yield Futures
Ticker: 10Y
Minimum fluctuation:
0.001 Index points (1/10th basis point per annum) = $1.00
Disclaimer:
• What presented here is not a recommendation, please consult your licensed broker.
• Our mission is to create lateral thinking skills for every investor and trader, knowing when to take a calculated risk with market uncertainty and a bolder risk when opportunity arises.
CME Real-time Market Data help identify trading set-ups in real-time and express my market views. If you have futures in your trading portfolio, you can check out on CME Group data plans available that suit your trading needs www.tradingview.com
Trading the Micro: www.cmegroup.com

$GBINTR - U.K Interest Rates (March/2025)ECONOMICS:GBINTR
March/2025
source: Bank of England
- The Bank of England voted 8-1 to keep the Bank Rate at 4.5% during its March meeting,
as policymakers adopted a wait-and-see approach amid stubbornly high inflation and global economic uncertainties. The bank highlighted that, given the medium-term inflation outlook, a gradual and cautious approach to further withdrawal of monetary policy restraint remains appropriate.
CPI inflation increased to 3.0% in January, and while global energy prices fell,
inflation is expected to rise to 3¾% by Q3 2025.
Also, the MPC noted that global trade policy uncertainties and geopolitical risks increased, with financial market volatility rising. source: Bank of England

$JPIRYY -Japan's Inflation Rate (February/2025)ECONOMICS:JPIRYY
February/2025
source: Ministry of Internal Affairs & Communications
- The annual inflation rate in Japan fell to 3.7% in February 2025 from a 2-year high of 4.0% in the prior month, amid a sharp slowdown in prices of electricity (9.0% vs 18.0% in January )and gas (3.4% vs 6.8%) following the government's reinstatement of energy subsidies.
Also, food prices rose slightly slower after hitting a 15-month high in January (7.6% vs 7.8%).
Further, inflation eased for healthcare (1.7% vs. 1.8%), recreation (2.1% vs. 2.6%), and miscellaneous items (1.1% vs. 1.4%).
At the same time, education costs continued to fall (-1.1% vs. -1.1%).
In contrast, inflation remained steady for housing (at 0.8%) and clothing (at 2.8%), while accelerating for transport (2.4% vs. 2.0%) and furniture and household items (4.0% vs. 3.4%), and bouncing back for communications (0.1% vs. -0.3%).
The core inflation rate dropped to 3.0% from January's 19-month top of 3.2%, above forecasts of 2.9%.
Monthly, the CPI dropped 0.1%, the first fall since September, after a 0.5% gain in January.

$USINTR - U.S Interest Rates (March/2025)ECONOMICS:USINTR
March/2025
source: Federal Reserve
- The Fed keep the funds rate unchanged at 4.25%-4.5%,
but signaled expectations of slower economic growth and rising inflation.
The statement also noted that uncertainty around the economic outlook has increased, but officials still anticipate only two quarter-point rate reductions in 2025.

$JPINTR -Japan's Interest Rates (March/2025)ECONOMICS:JPINTR
March/2025
source: Bank of Japan
-The Bank of Japan (BoJ) kept its key short-term interest rate at around 0.5% during its March meeting, maintaining it at its highest level since 2008 and in line with market expectations.
The unanimous decision followed the central bank’s third rate hike in January and came before the U.S. Federal Reserve’s rate announcement.
The board took a cautious stance, focusing on assessing the impact of rising global economic risks on Japan’s fragile recovery.
The BoJ pointed to ongoing uncertainties in the domestic economic outlook amid higher U.S. tariffs and headwinds from overseas conditions.
While the Japanese economy had recovered moderately, some weaknesses remained.
Private consumption continued to grow, helped by wage hikes, even as cost pressures persisted.
However, exports and industrial output were mostly flat.
Inflation ranged between 3.0% and 3.5% yearly, driven by higher service prices.
Inflation expectations increased moderately, with underlying CPI projected to rise gradually.

Descending channel on the yield curveI spotted a descending channel on the yield curve which it never formed before in it's entire history.. So if this one plays out then we will break out to the upside..

Rising money supply DOESN'T always equate to stock markets riseRising money supply DOES NOT always equate to stock markets going up.
Includes Bitcoin & Crypto.
Using liquidity (m2) to anticipate stock market reaction is a dangerous game

Trump Tariffs: Strategic Impact and Investment ImplicationsIn the short to medium term, equity markets will experience significant volatility due to new tariff implementations. However, in the long term, these tariffs could lead to a stronger domestic economy, benefiting the working class and middle class while revitalizing industrial production in the U.S.
Macroeconomic Impact
Depreciation of the U.S. Dollar
A depreciating USD acts as a natural tariff, making imports more expensive while simultaneously boosting U.S. exports. Countries with weaker currencies relative to the dollar, such as Mauritius (where our currency has depreciated by nearly 40% against the USD), already experience higher costs when purchasing from U.S. retailers like Amazon.
Inflation Trends and Precious Metals
Despite widespread fears of inflation—reflected in gold prices reaching all-time highs—actual inflation remains relatively stable (~2%). Factors such as import/export balances, currency devaluation, and consumer demand will likely offset inflationary pressures. Once investors recognize this, precious metals may undergo a correction.
Federal Reserve Policy and Interest Rates
The Federal Reserve's traditional mechanism of recession control—interest rate adjustments—is currently ineffective. With reports of declining payroll numbers, the Fed is expected to cut interest rates to prevent a mass exodus of aging investors (boomers) from the stock market. However, this time, rate cuts may not drive asset inflation as they did during COVID-19.
Investment Strategy: Navigating Market Changes
Short-Term: Uncertainty leading to stability
Bear Market Risks: Until tariff negotiations stabilize and currency depreciation takes effect, expect equity market volatility.
Investment Approach:
Buy high-quality corporate bonds in consumer staples with exposure to multiple currencies.
Hold cash reserves across multiple currencies to mitigate risk.
Prioritizing fixed-income securities (bonds, term deposits).
Consider real estate in stable emerging markets, where high-net-worth investors may shift investment focus.
Mid-Term: Seeds start to reap
Sector Focus: multinational companies benefiting from U.S. exports, particularly in non-tariff-heavy industries.
Stock Selection: Identify firms that continued capital investment during the downturn and are now positioned for growth.
Long-Term (2028+)
Monitoring Indicators:
Track interest rate trends and their impact on asset accumulation by wealthy investors.
Observe precious metal prices as an indicator of capital reallocation to assets.
Investment Approach:
Consider REITs and undervalued real estate investments.
Double down on assets if economic policies shift under a Democratic administration.

Credit Spreads - About to Blow?While credit spreads, which reached near-historic lows in 2024, remain tight, they have widened notably since the beginning of 2025. If this trend accelerates, it could put substantial pressure on the bond market, resulting in tighter financial conditions and corresponding headwinds for the domestic economy. The last 2-3 weeks have seen risk assets come under pressure, but the below chart suggests that the risk-off sentiment shift may still be early-stage... Whether viewed through a traditional technical lens or supply/demand, current levels could be considered supportive - risk is to the upside.
A few impacted ETFs: NASDAQ:IEF , NASDAQ:TLT , AMEX:HYG , AMEX:JNK
Jon
JHartCharts

Inflation rate vs FED FUNDS RATEThe inflation rate and the Federal Funds Rate are deeply interconnected, with the Federal Reserve using the latter as a primary tool to manage the former. When inflation rises above the Fed's target (typically around 2%), the Fed often increases the Federal Funds Rate to tighten monetary policy. Higher rates make borrowing more expensive, which can reduce consumer spending and business investment, thereby slowing economic activity and helping to curb inflationary pressures. Conversely, when inflation is too low or the economy is sluggish, the Fed may lower the Federal Funds Rate to stimulate borrowing, spending, and investment, which can help boost economic activity and push inflation toward the target. However, this relationship is influenced by external factors such as supply chain disruptions, energy prices, and global economic conditions, which can complicate the Fed's ability to control inflation solely through rate adjustments. For example, during periods of supply-driven inflation (like during a oil price shock), raising rates may have limited immediate impact on inflation but could still be used to anchor inflation expectations. Thus, the Fed's management of the Federal Funds Rate in response to inflation reflects a balancing act between stabilizing prices and supporting sustainable economic growth.
