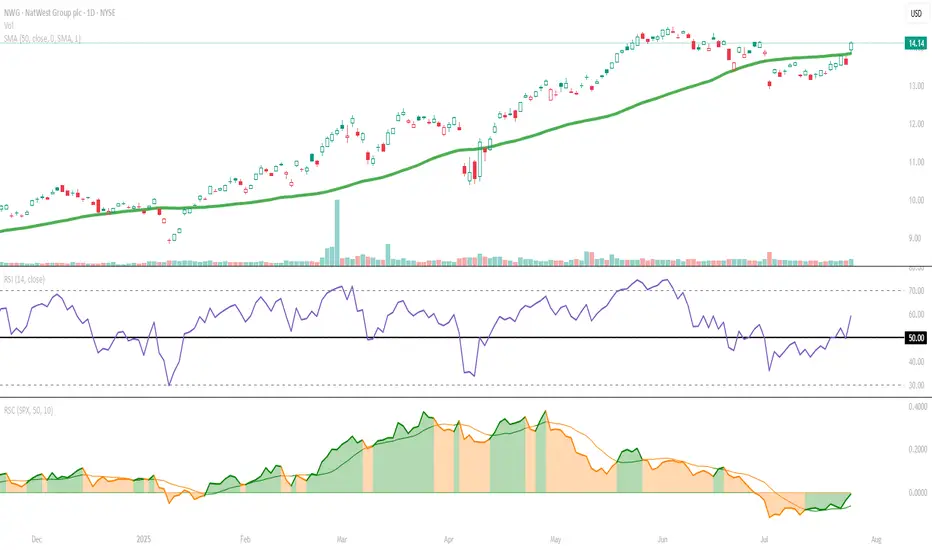
NatWest Group (NWG): A Kicker Setup Is BrewingKicker-like Surge Shifts Tone
The latest daily candle resembles a bullish kicker, gapping above the previous day's range with strong follow-through—a possible sign of sentiment shift. Notably, this move came with an RSI jump from the equilibrium zone of 50 to near 60, suggesting growing momentum. P
BKNG: Catalyst for the drop - EarningsBKNG has completed a super cycle 5 wave structure beginning at the completion of the March 2020 COVID drop. First target is 4030 by EOY to early next year. Many other stocks are showing a similar structure, so expecting selling volume to greatly increase over the next 90 days.

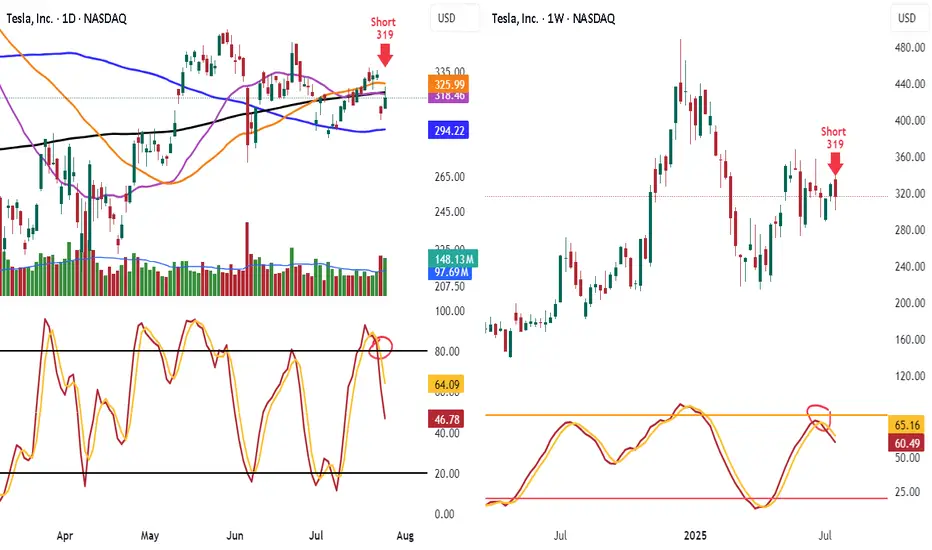
Shorted TSLA 319 Look at TSLA hit 50 day and 200 day MA and failed and know under them
Look at the lower highs and see the stoch heading down
Know lets look weekly stoch heading down and lower highs
Target is 100 day ma 294.22 take some off. When it breaks will add back on
Have trailing stop in place
META CANT KEEP THE HULK DOWN!!!!META has been consolidating for a few weeks now, but it's still in this bull flag that looks like it might break out soon, hopefully before earnings on Wednesday, July 30. I love technical analysis on charts, and this inverse head and shoulders pattern has been effective on most semiconductor names

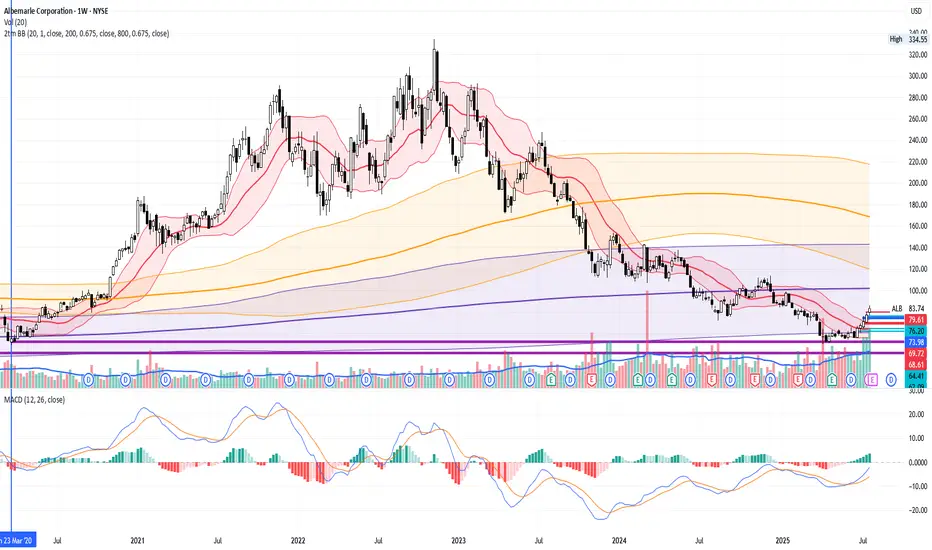
ALB Long, Resurrection of lithium trendALB have started to rise in recent weeks. It's price stays near 5-year lows.
Long-term Price Levels already have worked to bounce the stock by around 50%+.
Most likely funds have started to trade it in Mean Reversion strategies. So, the movement back to 200MA and 800MA on Weekly time-frame is qui
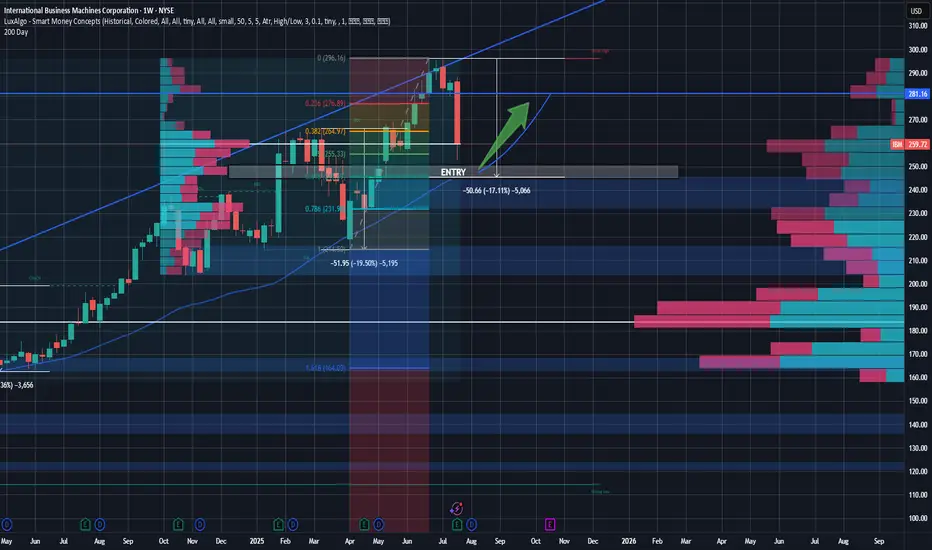
IBM Rebound Trade - Buying the Pullback at Key ConfluenceSetup:
IBM is setting up for a potential high-conviction long entry around the $245 level, a price zone marked by multiple layers of technical confluence and volume-based support. Over the last 18 months, IBM has seen two notable pullbacks—both in the 17–20% range, often around earnings events. The
2025 Is a Big Year for Bitcoin Miners—Who’s Winning the Hash War
Bitcoin’s resurgence in 2025 has reignited the mining race. The halving came and went, hashprice bounced from the abyss, and a fresh wave of capital is pouring into the space. So we figured: time to catch you up on who’s making real moves and pulling ahead — both in market cap and megawatts.
⚡

99% of people buying $NVDA don't understand this:🚨99% of people buying NASDAQ:NVDA don't understand this:
NASDAQ:GOOGL : “We’re boosting AI capex by $10B.”
Wall Street: “Cool, that’s like $1B or 0.06 per share for $NVDA.”
So from $170.50 at the time of news to $170.56 right?
No.
NASDAQ:NVDA trades at 98× earnings. So that $0.06? Turns in

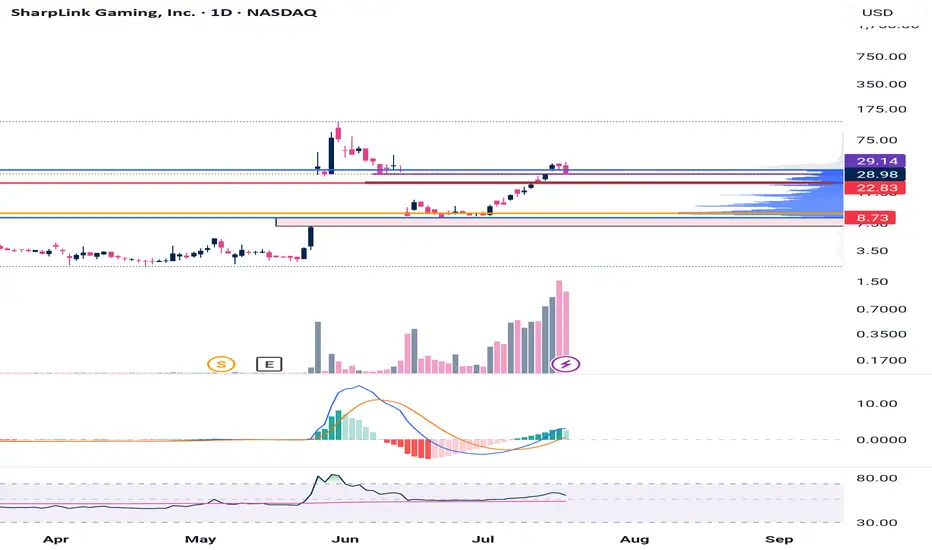
$SBET - look out down below. CRYPTOCAP:ETH is the asset
NASDAQ:SBET is the stock
Some gaps to fill below. Will keep loading.
Could be life changing!
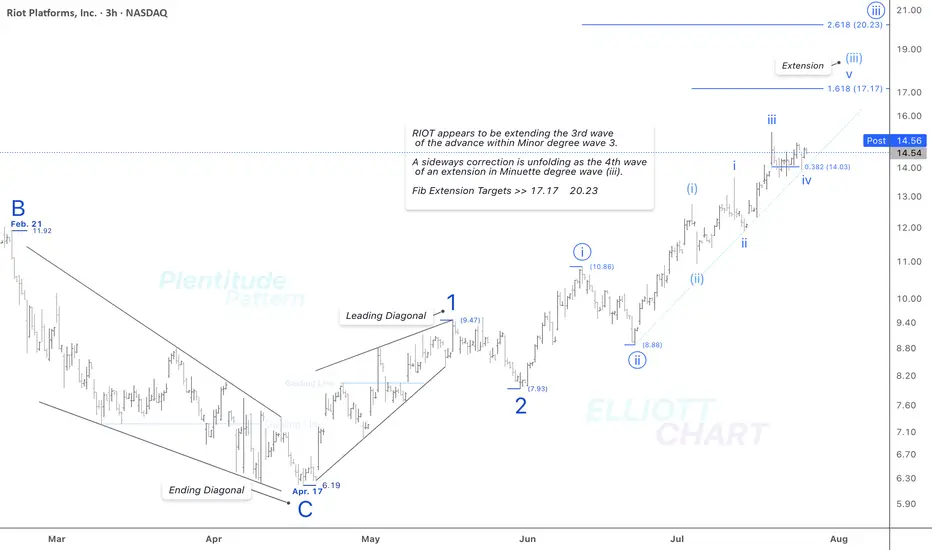
RIOT / 3hAs illustrated on the 3-hour chart above, NASDAQ:RIOT appears to be extending the third wave of an impulsive advance within Minor degree wave 3.
And as anticipated, a sideways correction is unfolding as the fourth wave of the ongoing extension in Minuette degree wave (iii).
Fib Extension Targets
See all popular ideas
SymbolPrice & chgMarket cap
SymbolMarket cap / Price
SymbolPrice & chgEmployees
SymbolEmployees / Price
Stock collections
Tomorrow
BSLRAFFLES MEDICAL
Actual
—
Estimate
—
Tomorrow
HEIOHEINEKEN HOLDING
Actual
—
Estimate
—
Tomorrow
HEIAHEINEKEN
Actual
—
Estimate
2.46
USD
Tomorrow
NDX1NORDEX SE
Actual
—
Estimate
0.14
USD
Tomorrow
6961ENPLAS CORP
Actual
—
Estimate
—
Tomorrow
FRVIAFORVIA
Actual
—
Estimate
—
Tomorrow
RVTYRevvity, Inc.
Actual
—
Estimate
1.14
USD
Tomorrow
EPDEnterprise Products Partners L.P.
Actual
—
Estimate
0.64
USD
See more events