NATURAL GAS - Who can Predict this wild beast?Natural gas got demolished today, down over 8%.
The one headline we saw hitting the tape that is having some partial influence:
"Vessel Arrives at LNG Canada to Load First Cargo, Strengthening Global Supply Outlook – LNG Recap"
Today, we did hedge our core long UNG position with a short dated $56 put on EQT.
We are already green on that trade and looking for $56 level to come into play.
Natural gas volatility sure trades in a world of its own which is why it is key to size accordingly.

7/1/25 - $oscr - Dip buying AH at mid 17s7/1/25 :: VROCKSTAR :: NYSE:OSCR
Dip buying AH at mid 17s
- stock running for good reason
- NYSE:HIMS of insurance type
- NYSE:CNC is pee'ing in the narrative, but NYSE:OSCR guide unaffected
- I'd expect to pick up a MSD gain here
- I have limits into the 16's tn where i'd rather own more
V

TESLA I Its not only EV Cars. Elon Musk predicting 1000% growthThis is not a short-term trade as you know from me on FX, Crypto and Indices. This is buy and hold investment. I got already good bag of share and Im still adding without trying to time if perfectly, but now I think its time to buy bigger positions.
Tesla is my 3rd biggest position after the Bitcoin and Strategy (MicroStrategy). Many people see it only as an EV cars company, but it's not all what they do, just read bellow to see why I see a huge potential in this company.
📍 Why Tesla is Considered a Top Investment
Tesla stands out as a leading player in the EV market, with a strong brand and a history of delivering innovative products. In 2024, it produced about 459,000 vehicles and delivered over 495,000 in the fourth quarter alone, showcasing its ability to meet growing demand Tesla Fourth Quarter 2024 Production, Deliveries & Deployments.
💾Financially, Tesla reported $97,690 million in total revenue for 2024, with the automotive segment contributing $87,604 million and energy solutions adding $10,086 million Tesla, Inc. Annual Report on Form 10-K for 2024. This diversification into energy, alongside investments in autonomous driving, positions Tesla for long-term growth, making it attractive for investors seeking exposure to future trends in sustainability and technology.
📍 What Tesla Does Beyond EV Cars
Beyond EVs, Tesla is deeply involved in energy solutions:
📍 Solar Products: Offers solar panels and solar roofs for clean energy generation.
📍 Energy Storage: Provides Powerwall for homes and Megapack for large-scale projects, helping stabilize grids and manage energy costs.
📍 Charging Infrastructure : Operates a network of Supercharger stations, increasingly open to other EVs.
Services: Includes vehicle maintenance through service centers and body shops.
📍 Robotaxi: Plans to launch a fully autonomous ride-hailing service in June 2025 in Austin, Texas, potentially opening new revenue streams Tesla's robotaxis by June? Musk turns to Texas for hands-off regulation.
📍 Tesla Optimus: Developing a general-purpose robotic humanoid for tasks like household chores or industrial work, which could lead to new markets.
This expansion into energy and services, along with unexpected ventures like Robotaxi and Tesla Optimus, enhances Tesla's role in the transition to sustainable energy and technology, offering benefits like grid stability and potential robotics applications.
The growth in the energy segment, with a 67% increase from 2023 to 2024, highlights Tesla's expanding role in sustainability, potentially attracting investors focused on long-term trends. Additionally, Tesla's commitment to innovation, particularly in autonomous driving technology, is noteworthy. The company is developing features like Full Self-Driving (FSD), which could open new revenue streams, such as robotaxi services, enhancing its investment appeal.
🤔I think Optimus and Robotaxi will exceed rapidly exceed their EV cars revenue. Elon musk is predicing over 1000% growth in 5 years. Which would be way above $2900 without stocks splits.
I m a bit conservative and I think we can go somewhere between 3 - 4 standard deviations.
Wishing you continued success on your trading journey. May this educational post inspire you to become an even better trader!
“Adapt what is useful, reject what is useless, and add what is specifically your own.”
David Perk ⚔

6/30/25 - $qubt - short... AGAIN. lol6/30/25 :: VROCKSTAR :: NASDAQ:QUBT
short... AGAIN. lol
- it's pretty simple
- 1/ the recent "dilute me harder" gap on June 23rd gets filled
- 2/ the CFO leaves, gets paid a pile of shares on the way out (lol)
- 3/ no product
- 4/ index inclusion means... real money will underweight this hardcore
- 5/ and it remains the gift that keeps on giving
i love donuts
V

Tesla Bullish Breakout Setup: Entry at $295.54 Targeting $488.87Entry Point (Buy Zone): Around $295.54
Stop Loss: Between $272.94 – $295.54 (lower purple support zone)
Target (TP): $488.87
Current Price: $315.33 (as of the latest candle)
📈 Strategy Summary:
Setup Type: Long (Buy)
Risk-Reward Setup:
Reward: ~$193.33 per share (from $295.54 to $488.87)
Risk: ~$22.60 per share (from $295.54 to $272.94)
Reward:Risk Ratio ≈ 8.6:1 — a high potential payoff if the trade works out.
📊 Technical Context:
Support Zone: Price recently bounced off the support region (marked in purple).
Moving Averages:
Red Line (Short-Term MA): Price just crossed back above.
Blue Line (Long-Term MA): Price reclaimed this level — bullish signal.
Price Action: After a corrective phase, a possible reversal is forming at support, confirming bullish interest.
✅ Bullish Signals:
Bounce from support zone with a strong bullish candle.
Price closing above the 200-day MA (bullish trend resumption).
High reward-to-risk trade setup with clear stop loss.
⚠️ Considerations:
Confirmation with volume or a second bullish candle would add confidence.
Watch for earnings or macro events that could disrupt the trend.
Tight stop is essential to avoid drawdowns if the setup fails.
🔚 Conclusion
This is a well-structured long setup with a high potential reward. If price maintains above the entry zone and breaks recent highs, a push toward the $488.87 target is plausible.

The price will drop to at least $230The price will drop to at least $230. after that can goes to $200. but i have to re-check at $230
If you are thinking of investing, this is not a good place to buy at all.
I recommend entering in the $200 range after getting the necessary confirmations.
If you would like to follow me to see the rest of my analysis.

MUSK on TRUMP's Bill | "outrageous, disgusting abomination"Elon Musk’s sided against the latest Trump-backed tax-and-spending package, in a plot twist between the recent partners turned enemies.
Musk called the legislation a “massive, outrageous, pork-filled Congressional spending bill” and a “disgusting abomination,” publicly shaming senators and representatives who backed it.
With such a strong opinion against it one may wonder, is this going to negatively affect Tesla?
Together with this strong reaction, the price has already been trading lower for the past few days.
The administration has defended it as the “One Big Beautiful Bill,” insisting it will stimulate growth, even though Elon Musk warned the bill would swell the U.S. budget deficit by roughly $2.3–2.5 trillion over the next decade, calling the added debt “crushingly unsustainable”.
When I first read this, it made me think of Tesla's long generated “green credits”, which in 2024 alone, brought in roughly $2.76 billion. “green credits” (officially, zero-emission or regulatory credits) work by building more clean vehicles than required and selling the excess allowances to other automakers that need them to comply with emissions mandates.
Now I'm no expert on US policy, and so I roped in GPT to help me explain how this new bill implicates TESLA's profit:
Under the Senate’s “big, beautiful” tax-and-spending bill, Tesla’s regulatory-credit business faces two assaults:
❗ Repeal of CAFE- and ZEV-mandates
The bill would eliminate penalties for automakers missing Corporate Average Fuel Economy targets and roll back zero-emission vehicle mandates that currently force legacy manufacturers to buy credits if they fall short. Remove those penalties and mandates, and there’s no structural need for credits—undercutting the very market that funds Tesla’s $2–3 billion-a-year credit-sales business
❗ End of consumer EV tax incentives
By phasing out the $7,500 new-EV credit (and the $4,000 used-EV credit) within months of enactment, the bill dampens U.S. EV demand overall. A smaller EV market means fewer opportunities for Tesla to leverage fleet-wide ZEV regulations against higher-emitting rivals—further squeezing credit prices and volume
Bottom line: Without CAFE/ZEV obligations and with EV purchase subsidies gone, Tesla’s “green-credit” line—a major profit driver in recent quarters—would likely collapse, removing a key buffer against manufacturing and pricing pressures.
This could be the beginning of a bear market for Tesla lasting throughout the rest of the Trump administration.
________________________
NASDAQ:TSLA

QS heading a lot higherFor those that have been following me for a while know I have been a long time holder of QS and have been accumulating even up until yesterday. Its been a long painful hold but I believe we are finally ready to begin the upward trajectory that many expected. I pointed out in the chart where most retail give up after holding for years but that is exactly where big money accumulate. They send the price below a support trend line fooling retail into selling as retail expect a water fall to the downside. In this instance it seems they were accumulating for almost 3 months before the news came out which sent the price higher recently. I expect this to be the start of a new rally.
Hold tight.
Not investment advice, please do your due diligence. Please like and share.

NFLX (Netflix Inc.) on the 1-hour chart (NASDAQ)NFLX (Netflix Inc.) on the 1-hour chart (NASDAQ) using price action, trendlines, and Ichimoku Cloud.
Observations:
There's a strong uptrend with higher highs and higher lows.
Price recently pulled back and is currently testing the Ichimoku cloud support, possibly forming a bullish continuation pattern.
A trendline from June is acting as dynamic support.
I have a yellow resistance zone drawn at the top, signaling the next potential bullish target.
---
🎯 Target (Short-Term):
Primary Target Zone: $1,335 – $1,340
(This is the previous swing high and resistance area you've marked.)
Secondary Target (if breakout succeeds): $1,350+
---
🛑 Suggested Stop Loss:
Below $1,270, or below the trendline/Ichimoku cloud for safer risk management.
---
📝 Summary:
Bias: Bullish continuation.
Buy zone: Near current price (~$1,290–$1,295) or on confirmation candle.
Target: $1,335–$1,340
Invalidation: Break and close below $1,270 trendline.
Let me know if you'd like a breakdown for a swing or intraday trade.

Alibaba on the lower upward trend lineAlibaba is on the upward trend line after years of a downward trend. The AI business is booming. The fundamentals speak for themselves. The price/earnings ratio for 2025 is around 12 and is on Value level. The conflict with the Chinese party seems to have improved. The company is buying back shares. I have therefore increased my long position today

AIH stockUfff, What a chart man. This stock was in a downtrend for over 7 years. Then for a whole year is in this triangle as its accumulate. And so far it didnt take the liquidity @0.668, it did make an attempt, but failed. Then it will try again in the coming period.
I think to trade this one we should be patient as hell, as a one year accumulation, will definitely be followed by a manipulation then to the intended direction. When i say manipulation is the one as you see on 9, 10 of April.
For now i would take short trades between the triangle upper and lower legs. If the price breaks below 0.45, and closes below it, then we are testing the trendlines below, if it breaks above 0.55, then we will move higher to 0.668.
Do your own research. This is only a TA, NEWS is very important to be tracked alongside the TA.

MVST - Bearish Head & Shoulders Breakdown Targeting $2.25–$2.75A classic Head and Shoulders pattern has formed on MVST's daily chart, with a clear neckline break to the downside. This technical setup suggests bearish momentum in the short term, with a likely price target between $2.25 and $2.75.
This zone also aligns with a prior consolidation area and dynamic support. I expect the stock to potentially find a bottom in this area. If MVST can deliver strong Q2 earnings in August, a bullish reversal from that demand zone could follow.

7/2/25 - $sbet - Another way to juice sbet orange7/2/25 :: VROCKSTAR :: NASDAQ:SBET
Another way to juice sbet orange
- in this giddy money printer go brr expectation tape and back to ATH on the index, it's an interesting point to look for names where you'd own it... but where it might be non-obvious and where IV is high
- as a point of reference, take $sbet. 1.5x mnav ETH treasury w/ some gaming ops, biggest treasury outside of eth foundation, eth is probably actually underwrite-able (not a word i know) from a convert/ perferred perspective, where a treasury *really* gets yield on it's stack
- I can sell the $10 strike aug 15 calls for $1.8 rn (and have started doing this, most of that volume today is me lol)
- point here is...
1/ i think in the next 6-18 mo. ETH will be probably $4-5k. does this mean it doesn't go to $1.5-2k in the meanwhile? and this thing could trade at 1x mnav in the immediate term? if that were the case, say $2.5k eth (so -20% plus or minus) and then 1.5x mnav to 1x mnav = another 30% on top of this. so you're looking at -50% (or more) so a $5/shr stock. would i buy it there? hell yeah. bottom w/ upside leverage w/o any expiry. it's like a call option that never expires at that point
- but in the meanwhile... do i have conviction this thing apes higher to the teens? 20s? no way jose.
- so i can buy a pile of shares here at $9.5, "sell" $10 strike for $1.8/shr and collect about 20% (1.8/9.5) for a month and a half. if thing goes to 20s... oh well, i am able to take bigger size at this stage than i'd otherwise be willing to take... bc my basis goes to $7.7/shr (9.5-1.8) and therefore my "downside" is a more reasonable 35%
- "V 35% downside is horrendous"
- lol - welcome to my probability mindset. I don't mind 20-40% max drawdown if i have visibility to multiple X's and also believe i would be adding in that drawdown instead of saying "shoot need to cut" ... and thinking it could do -60% or more on my basis. i don't ever like putting myself in a situation where i require more than 1x to breakeven
- therefore, let's play the market marker game. sit on our hands for the next month and a half. collect some premium. wish the best to our friends at SBET but be a bit unconcerned about the ST price action
V

Bullish patterns & Monthly Breakouts in Alkyl AminesGood afternoon Folks, This stock has given us a breakout from falling wedge pattern and from inverse H & S pattern and with a strong green candle
- The next step is either you can enter now as a big green candle without rejection shows bulls strength.
- Next is to wait for the 2nd green candle closes around high which acts as confirmation and the classical way to trade breakouts.
- Now as per the John Murphy's book the target for Inverse H&S Breakout will be the size of head which I have marked in yellow which suggest 44% upmove or else you can use pivots which gives you support and resistance which can help you to understand from where price is taking support or where it is facing rejection.
- it will also helps you with target and stoploss.
THIS ARE MY PERSONAL VIEWS OR ANALYSIS NOT ANY RECOMMENDATIONS.

Abbvie please go man lolNYSE:ABBV has tested my patience
has been in a downtrend for a while now and has finally broken out, is now above all MAs on the daily and above 50 SMA on the weekly
193 is a high volume node to cross and after that there is not much volume
targetting 200
ER coming up and expecting a very good quarter and guidance

Comparative Analysis of Triggers - 5D, TD, AD, pattern w UT-Bot5D, Top Dog , SD and pattern analysis and trigger compared to UT BOT indicator strategy.
Looking to fine tune and back test with TV.

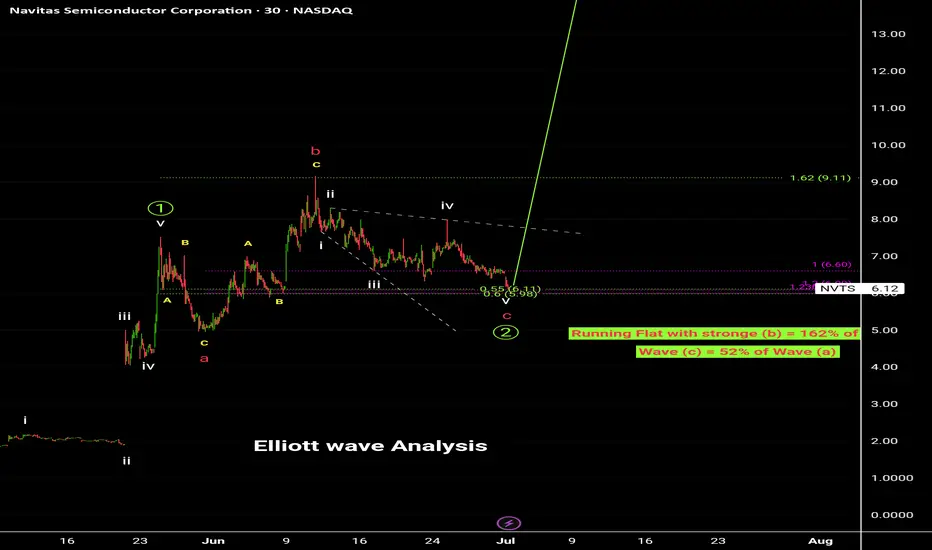
Navitas Semiconductor Corporation (NVTS).Unfortunately, we completed W1 at 7.52$, then we started W2 formed as a Running Flat correction with strong (b)= 162% of starting wave (a) and it come as zigzag correction, we are Today in wave (c) that comes as an expanding ending diagonal which is supposed to end at 60%(5.98$ - 6.00$) of wave (a), / or wave (c) = 100% (6.60$) - 123.6% (5.98$) length (a).
### There were cases wave (c) Ended between 55%(6.11$) and 59%(6.00$) of wave (a).
Running Flat correction is the ending of W2, after that, we going to start W3 the Motive Powerful Expending Wave ever that its Target price = 26.40$ - 27.30$ at that level we also end Nen-Star Harmonic pattern to start correction of W4 to about 16$-20$ depending on How aggressive Sellers will deal with W4, at the End we will Expect to End W5 between 37$ - open Zone to 40$.
# Explosive 💣 level to make sure we completed W2 and starting W3 to Pass level 6.70$.
# Accumulation is in progress Now.
# Highly recommended for starting Buying Now.
White Collar job sentiment has been plunging since 2022Robert Half has been around for quite sometime...I look at this chart as a sentiment indicator for "white collar workers". While white collar workers and the American middle class are not synonymous you could say that many people in the middle class are employed as white collar workers so it is a chart to study when considering how the American middle class is "feeling" about their job situation which in turn leads to consumption habits either falling or rising.
Needless to say this chart has been plunging since early 2022 and is off to the worst start of a presidential turnover since Bush in 2000 (if you study only the last 25 years).
Typically once a president has been elected or re-elected this chart generally has gone up during the first 2 years after election or re-election...it then either continues upwards or begins to go down after the 2nd full year. As you can see during the Bush presidential term sentiment actually went down.
This chart is one of the reasons I believe charts like Target, Lululemon, LVMH, etc have been suffering.
Anyways, RHI is actually not a bad company...pays a pretty good dividend and has a solid balance sheet. Could this be the quarter for the turn around? Today had a very strong bullish reversal candle, not only for this company but also for the others I mentioned above. Only time will tell but this chart will eventually turn around.

ULTRACEMCO - 1 year INVERTED TRIANGLE══════════════════════════════
Since 2014, my markets approach is to spot
trading opportunities based solely on the
development of
CLASSICAL CHART PATTERNS
🤝Let’s learn and grow together 🤝
══════════════════════════════
Hello Traders ✌
After a careful consideration I came to the conclusion that:
- it is crucial to be quick in alerting you with all the opportunities I spot and often I don't post a good pattern because I don't have the opportunity to write down a proper didactical comment;
- since my parameters to identify a Classical Pattern and its scenario are very well defined, many of my comments were and would be redundant;
- the information that I think is important is very simple and can easily be understood just by looking at charts;
For these reasons and hoping to give you a better help, I decided to write comments only when something very specific or interesting shows up, otherwise all the information is shown on the chart.
Thank you all for your support
🔎🔎🔎 ALWAYS REMEMBER
"A pattern IS NOT a Pattern until the breakout is completed. Before that moment it is just a bunch of colorful candlesticks on a chart of your watchlist"
═════════════════════════════
⚠ DISCLAIMER ⚠
Breakout Area, Target, Levels, each line drawn on this chart and any other content represent just The Art Of Charting’s personal opinion and it is posted purely for educational purposes. Therefore it must not be taken as a direct or indirect investing recommendations or advices. Entry Point, Initial Stop Loss and Targets depend on your personal and unique Trading Plan Tactics and Money Management rules, Any action taken upon these information is at your own risk.
═════════════════════════════

TSLA at the Edge of Breakdown? Here’s the Options PlayGEX-Based Option Strategy Insight:
TSLA’s GEX landscape reveals heavy negative Gamma Exposure lurking below $305. That’s a red flag — dealers are likely to short more as price falls, amplifying downside. The highest negative NET GEX zone sits around $310–315, right near the current price, indicating a major PUT support zone — if broken, could trigger a volatility spike.
* PUT Walls: Stack up at $310, $300, $295, with max pain potential down to $285–290.
* Call Walls: Far above at $325/337.5/340 — little gamma resistance above, but TSLA would need a strong reversal to challenge those.
📌 Options Sentiment:
* IVR is 29.7 (lowish), IVx avg is 72.3 → options pricing isn’t cheap anymore.
* Calls 44.3% vs Puts 55.7% → leaning bearish.
* GEX suggests downside acceleration under $300.
➡️ Trade Idea (GEX View):
If $300 fails, consider buying 295 or 290 PUTs (weekly or next week expiry).
Target $285–290 zone for exit.
Above $310 = exit.
1-Hour Chart Technical Setup (2nd image):
TSLA has been in a clear downtrend, marked by:
* Break of Structure (BOS) followed by lower lows.
* Price is hovering inside a potential accumulation zone, but has shown no bullish confirmation yet.
* Volume is weak, and we are still sitting under a steep downtrend resistance line.
📉 Bearish Play:
* Break below $300 = confirmation of continuation.
* Entry: $299.50–300.00
* Target: $293.21 > $290 > $285
* Stop: Close above $305 (tight).
📈 Bullish Risk:
* Only valid if price breaks $310 and flips the BOS area at $317.
* This could trigger a squeeze toward $320/325, but that’s lower probability for now.
Final Thoughts:
Until we reclaim $310+, TSLA leans heavy. GEX confirms dealer pressure below $300. Use tight stops and don’t chase — volatility will increase fast on a breakdown.
Disclaimer: This is not financial advice. Trade at your own risk and always confirm your thesis.

Musk-Trump Feud Sends Tesla (TSLA) Shares DownRenewed Feud Between Musk and Trump Drags Tesla (TSLA) Share Price Lower
The US Senate yesterday narrowly approved Trump’s so-called “big, beautiful budget bill.”
Elon Musk, who had previously criticised the bill for potentially adding $3.3 trillion to the national debt, warned that Republican lawmakers who supported it would face political consequences. In a post on X, Musk wrote:
“Every member of Congress who campaigned on reducing government spending and then immediately voted for the biggest debt increase in history should hang their head in shame! And they will lose their primary next year if it is the last thing I do on this Earth.”
He also reiterated his intention to establish a third political force under the name “America Party.”
In response, President Trump issued sharp threats:
→ to apply federal pressure on Musk’s companies by revisiting existing subsidies and government contracts (estimated by The Washington Post at $38 billion);
→ to deport Musk back to South Africa.
The market responded immediately to this renewed escalation in the Trump–Musk conflict. Tesla (TSLA) shares fell by over 5% yesterday, forming a significant bearish gap.
Technical Analysis of TSLA Stock Chart
Eight days ago, we analysed the TSLA price chart, continuing to observe price action within the context of an ascending channel (indicated in blue). At that point:
→ In mid-June, when the initial Musk–Trump tensions surfaced, TSLA managed to hold within the channel. However, as of yesterday, the price broke below the lower boundary, casting doubt on the sustainability of the uptrend that had been in place since March–April;
→ The price breached the lower channel limit near the $315 level — a zone that previously acted as support. This suggests that $315 may now serve as a resistance level.
As a result, optimism related to the late-June launch of Tesla’s robotaxi initiative has been eclipsed by concerns that the Musk–Trump confrontation may have broader implications.
If the former allies refrain from further escalation, TSLA may consolidate into a broadening contracting triangle (its upper boundary marked in red) in the near term, ahead of Tesla’s Q2 earnings release scheduled for 29 July.
This article represents the opinion of the Companies operating under the FXOpen brand only. It is not to be construed as an offer, solicitation, or recommendation with respect to products and services provided by the Companies operating under the FXOpen brand, nor is it to be considered financial advice.

Natural Gas - Silver Lining!Natural gas is ending the day with a daily bottoming tail.
Potentially forming an inverse head and shoulder pattern that takes us above the key $3.83 level.
We took profits on our EQT put hedge! The put contract went up over 100%
Lets see if Nat gas can build some pressure.

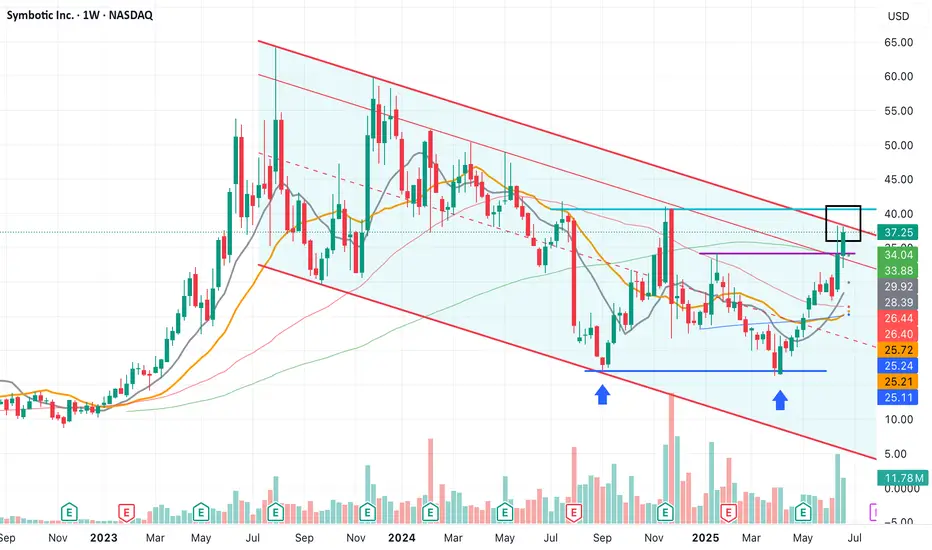
Ready for a comeback!This is a company that produces autonomous robots for warehouses, capable of handling goods storage using AI—the potential of this idea is insane!
At the moment, it's automating all of Walmart’s warehouses, which is its main client.
The price has been moving within a descending channel for two years and closed last week right near the upper boundary.
It might be time for a bullish breakout, with a return to previous highs or even beyond.
The first major resistance is around the $40 level.