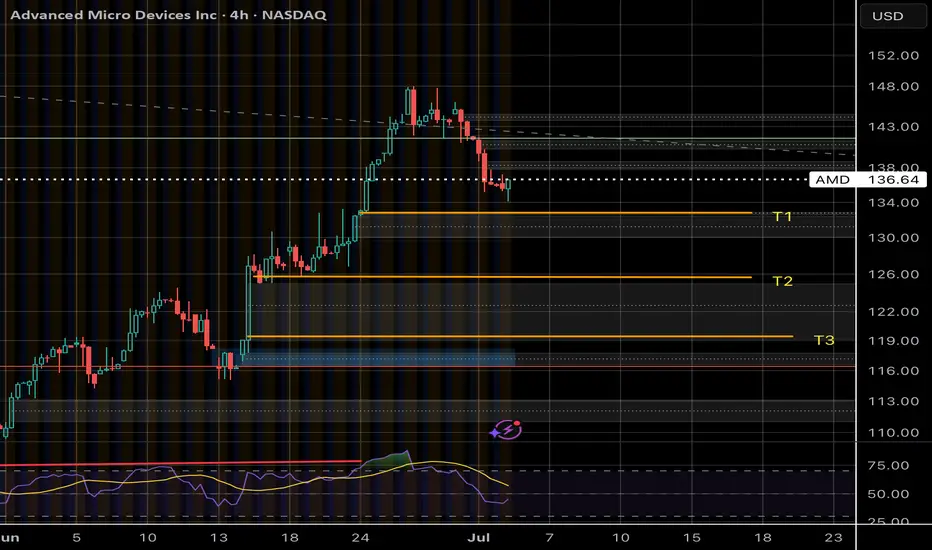
AMD If; ThenIf price goes below T1 I’ll be shorting to T2 and T3 as price fills gaps. As with my Bart pattern scalps, once price reaches a gap fill area it is quite reliable in direction
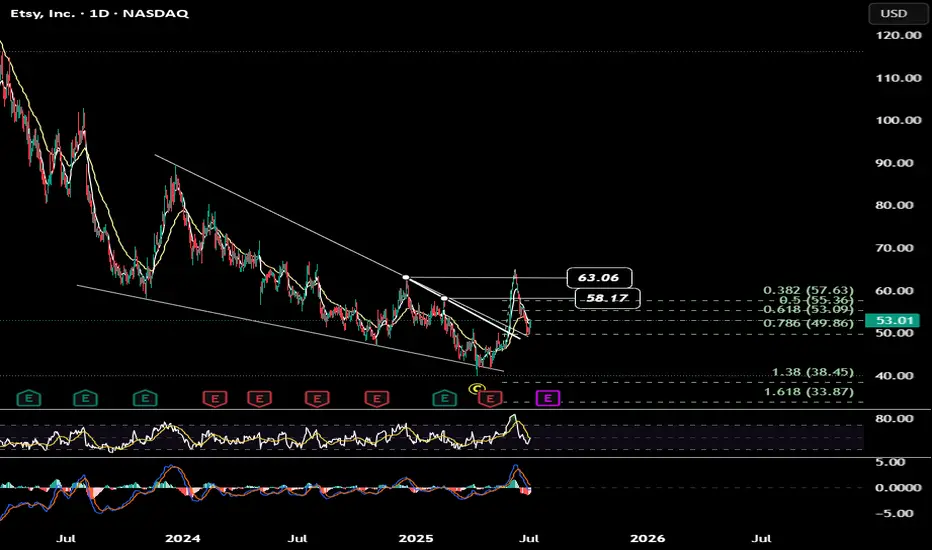
ETSY UPDATE ETSY is retesting ed trendline along with 78% fib . another chance or what !!!! same stop for me .
$ORCL Beats Earnings – Flat Base Breakout?There is a lot to like about NYSE:ORCL both on the chart and fundamentals. Not only did they beat earnings and now get an upgrade (see below), but the stock has also now formed a flat base after earnings. What that means to me is that buyers have pushed the stock up and there are not enough sellers to bring it back down.
I have an alert set at 215.01. If that triggers, I plan to open a full-sized position with a stop just under the most recent low (202.54). That is a 6% risk. Although, if it does not perform well right off the bat, I may close it on whatever day I open if it falls below the day low. All TBD.
If you like this idea, please make it your own and follow your trading plan. Remember, it is your money at risk.
Oracle rises as Stifel upgrades to 'buy'
** Stifel upgrades stock to "buy" from "hold", citing strong momentum in its Cloud business and disciplined cost management
** Increases PT to $250 from $180, implying an 18.91% upside to stock's last close
** "We believe Oracle is well positioned to accelerate total Application Cloud growth to the low teens range in FY26" - brokerage
Oracle Beat Expectations
Wednesday, June 11, 2025 at 4:05 PM ET
Oracle (ORCL) reported earnings of $1.69 per share on revenue of $15.90 billion for the fiscal fourth quarter ended May 2025. The consensus earnings estimate was $1.64 per share on revenue of $15.54 billion. The Earnings Whisper number was $1.66 per share. The company beat expectations by 1.81% while revenue grew 11.31% on a year-over-year basis.

Quick BB updates - Minor MovementAs we've observed, it appears we're currently in a Minor Cycle at the end of the 4th wave, aligning closely with the Fibonacci target for this wave.
The last financial quarter delivered strong results, and I genuinely like the direction the company is heading. In my view, this could represent the most significant core business shift in the past 30 years.
As always, please do your own research before investing, this is not financial advice.
Have a blessed week!

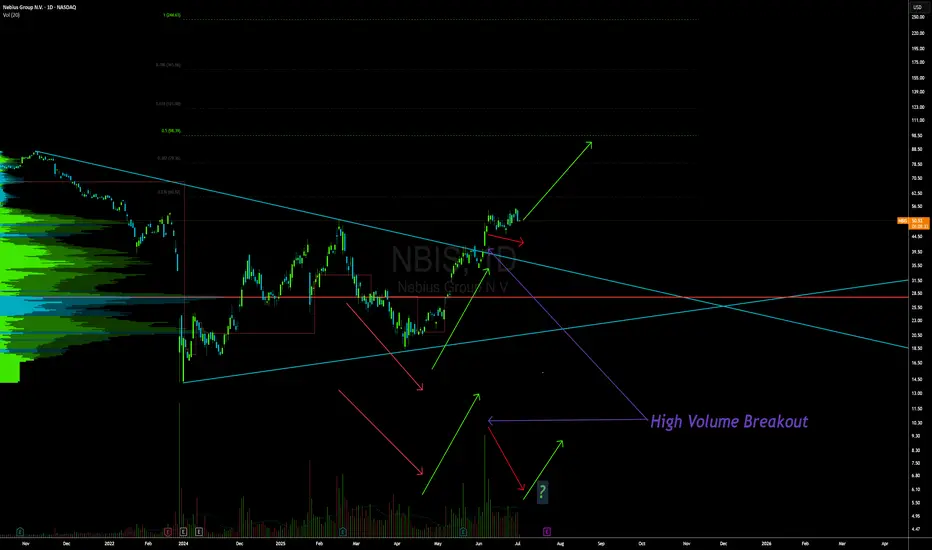
NBIS Bullish Technicals.
NBIS Fundamentals.
1. Massive Growth – The stock’s up a jaw-dropping 138% in just 3 months!
2. YTD Beast Mode – Up 81.6% so far in 2025.
3. Momentum Heating Up – Gained 36.9% over the last month alone.
4. Super Low Debt – Debt-to-equity at just 0.06 — strong balance sheet!
5. Sitting on Cash – Over $6.42/share in cash with a killer 9.59 quick ratio.
6. Insider Confidence – 20.71% insider ownership, they believe in what they’re building.
7. EPS Looking Strong – Projected +41.91% EPS growth next year.
8. Big Money Watching – 33.26% institutional ownership, eyes are on this.
9. Revenue Turnaround – Insane 381% sales growth QoQ, the shift is real.
10 Wall Street Thumbs Up – Consensus Buy rating, score of 1.25.
NBIS Technicals:
1. High-Volume Breakout spotted on the weekly chart — clear signal buyers are stepping in.
2. Broke out of long-term downtrend resistance with authority. Consolidating on low volume.
3. Price holding above key EMAs — bullish structure intact.
4. Fib targets in sight with potential room to stretch toward $90-$120+.
5. Volume expansion confirms real accumulation happening.
Watching for continued strength as this beast tries to reclaim lost ground and ride that momentum wave. With fundamentals this solid and technicals aligning.
IREDA Short_Price Rejection @ 20/ 50 Daily EMAIREDA Short:
- Price rejection @ 20/ 50 Daily EMA
- Enter Short when price favorable at lower timeframe
- Target 159
- SL - Today High or close above 20/ 50 Daily EMA

TCS Short_Rejection From 20 & 50 Daily EMATCS Short:
- Rejection from 20/ 50 Daily EMA
- Bearish Engulfing Candle
- Enter when the prices are favorable in lower time frame.
- SL: Today's High or close above 20/ 50 Daily EMA

Mount Fuji Series- Old runners waking upMount Fuji Series- Old runners waking up -
TARC - started running after 50-70 levels.. hope getting ready again.
Realty company with good land holding. Funda strong company.

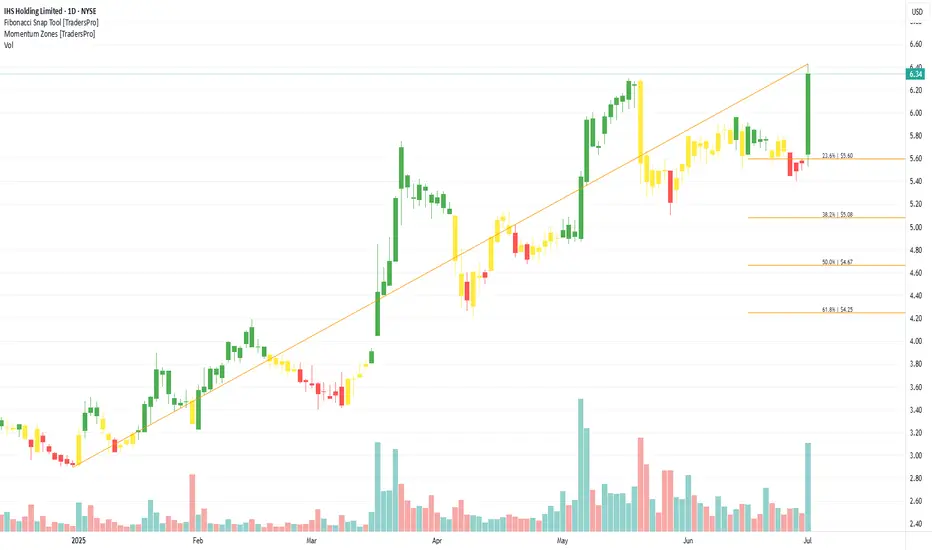
IHS Holding Limited (IHS) Boosted by 5G RolloutsIHS Holding Limited (IHS) is a leading independent owner, operator, and developer of shared telecommunications infrastructure, primarily in Africa, Latin America, and the Middle East. The company provides tower leasing and power management services that support mobile network operators. IHS’s growth is driven by rising demand for mobile connectivity, data usage expansion, and the ongoing rollout of 4G and 5G networks in emerging markets.
On the chart, a confirmation bar with increasing volume indicates strong interest. The price has entered the momentum zone by breaking above the .236 Fibonacci level. A trailing stop can be placed just below that level using the Fibonacci snap tool to lock in gains while allowing for continued upside.
VENUS PIPESVenus Pipes & Tubes Ltd. is a stainless steel pipe manufacturer catering to diverse sectors such as oil & gas, petrochemicals, pharmaceuticals, and water desalination. The company operates an integrated facility and emphasizes high-quality, precision-engineered products. Currently trading at INR 1,461.70, the stock has shown a strong rebound and is testing key technical levels after a corrective phase.
Key Levels
Support Levels: INR 776.75, INR 1,134.45, INR 1,346.35, INR 1,557.30
Swing Level: INR 1,461.70
Possible Upside: INR 2,318.85, INR 2,675.95, INR 3,130.80
Technical Indicators
RSI (Relative Strength Index): Currently at 52.15, indicating balanced momentum. While not decisively bullish, the RSI suggests the stock has shifted out of oversold territory and could build strength above the current base.
Volume: With volume at 1.17M, there is visible participation accompanying the recent price up-move. Sustained higher volumes near swing level would help confirm a broader trend continuation.
Sector and Market Outlook
Operating in the metal tubes and industrial materials space, Venus Pipes is positioned to benefit from:
Strong capex trends in infrastructure, chemical processing, and renewables
Import substitution and rising demand for precision stainless steel products
Expansion in exports to Europe, Southeast Asia, and the Middle East
Headwinds include volatility in nickel and alloy prices, global logistics fluctuations, and customer concentration risks in certain end-use sectors.
Latest Developments
Capacity Expansion: Commissioned additional production lines for seamless pipes and tubes
Export Growth: Reported robust YoY increase in export contribution to total revenue
Financials: Improved margins driven by premium product mix and better utilization rates
Dividend Update
Venus Pipes & Tubes has declared a dividend of ₹3.50 per share, reflecting strong cash flow generation and a balanced capital return policy.
Analysis Summary
Venus Pipes & Tubes is transitioning from a correction phase to a potential recovery cycle, underpinned by stable technicals and structural tailwinds in its core markets. While some consolidation may persist, the improving volume and RSI suggest growing interest. The company’s expansion initiatives and strengthening fundamentals support a constructive long-term outlook for disciplined investors.

CRH | Uptrend ContinuationThe CRH PLC weekly chart displays a strong uptrend continuation pattern.
Key Technical Observations:
Price successfully broke above the green support zone and is maintaining momentum
The ascending trendline (green line) acts as dynamic support, reinforcing bullish structure
Multiple VWAP indicators show healthy institutional participation across different timeframes
RSI remains in bullish territory without reaching overbought levels
Trade Setup:
Entry: Now
Exit: Clear break of trendline
Risk Considerations:
The projected upward path (red arrow) suggests continued strength, but traders should monitor for any breakdown below the ascending trendline.

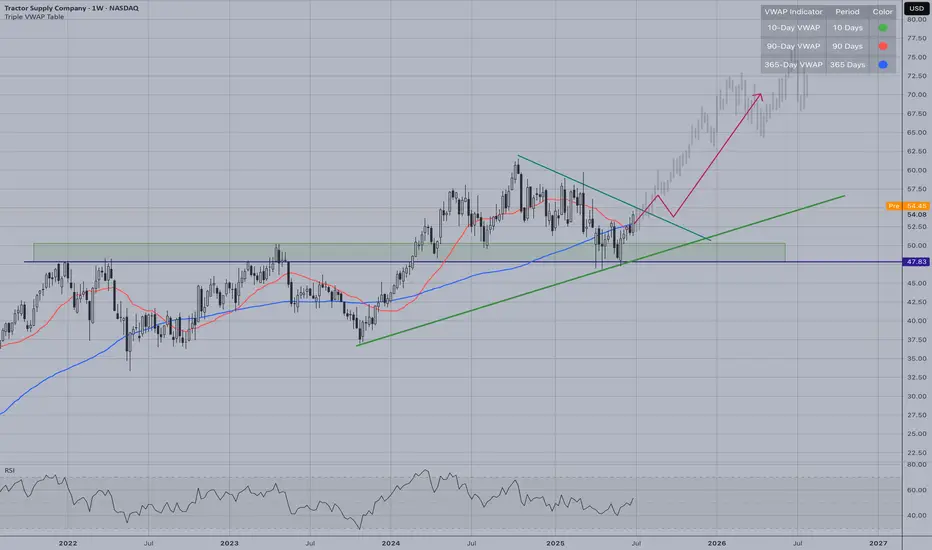
TSCO | Resistance Turned SupportTractor Supply Company (TSCO) demonstrates a textbook example of resistance-turned-support dynamics on the weekly chart. The stock has successfully broken above the previous resistance zone around $50-52 and is now using this level as strong support.
Key Technical Observations:
Clean breakout from multi-year consolidation pattern
Former resistance zone now acting as solid support
Strong upward momentum with price above all major moving averages
RSI showing healthy momentum without being overbought
Bullish Setup:
Entry: Current levels around $54 or on any pullback to the green support zone ($50-52)
Target: Initial resistance at $58-60 range, with longer-term potential toward $70+ following the projected path
Stop Loss: Below $49 (invalidation of support flip)
AFL | Bull FlagAFLAC (AFL) shows a classic bull flag formation on the weekly timeframe, presenting a compelling bullish setup. The stock experienced a strong rally from $60 to $116, followed by a consolidation period that has formed the flag pattern.
Key Technical Points:
• Bull flag pattern nearly complete after healthy consolidation
• Price currently testing the upper boundary of the flag
• Strong support established in the green zone around $104-106
• RSI showing neutral readings, indicating room for upward movement
• Volume profile supports the bullish structure
Trade Setup:
• Entry: Now or on breakout above the descending trendline
• Stop loss: Below $104 support zone
Risk Considerations:
The pattern could fail if price breaks below the green support zone. Overall market conditions and insurance sector sentiment will influence the breakout strength. The long consolidation period suggests institutional accumulation, supporting the bullish thesis for a measured move higher.

TSLA: Don't Sleep on the PullbackTesla’s bullish momentum is still in control – the weekly chart shows we’re still in an uptrend, and the trend is still our best friend. After a strong bounce from support a couple weeks ago, price is now rejecting off a weak resistance zone. Ideally, this pulls it back into my entry zone to retest the bottom or the 50% mark of the current swing. I’m using trend lines for guidance and expecting the next swing to push up into that confluence area. My golden zone is set between $367–$390, with partial profits be taken at $367 (top of the channel) and the rest near $390, where we meet the trend line. Stop loss is placed at $241, just below the level where momentum would likely shift.

ONON might be a huge one.Growing business.
Technically the gap has been filled, and quickly too. A massive volume has entered at the resistance turned support area which is a huge signal for long.
Lets see time will tell.

MFFL is in Rising ChannelMFFL is in Rising Channel, an entry may be taken on the breakout of the nearest resistance.

EFERT Consolidation BreakoutEFERT has given the Consolidation Breakout and can provide short-term as well as long-term targets.

BWCL is about to breakout consolidation phaseBWCL is about to break out of the consolidation phase, and a bullish momentum may be expected.

BFBIO Triangle BreakoutBFBIO has given the Triangle Breakout, and a bullish momentum may be observed.

SYS: System limited flag pattern breakoutPrice has broken out form flag pattern. This week closing will mark the further confirmation. Time to build the position

BUY 5 PAISA ABOVE 415 ON CLOSING BASIS ON WEEKLY CHART.Buy above 415 with daily closing and with the stop loss of 400 on the closing basis, stock is ready to fly with a potential swing target of 480. Technical indicators suggesting a good buy. Fundamentals are also fine.

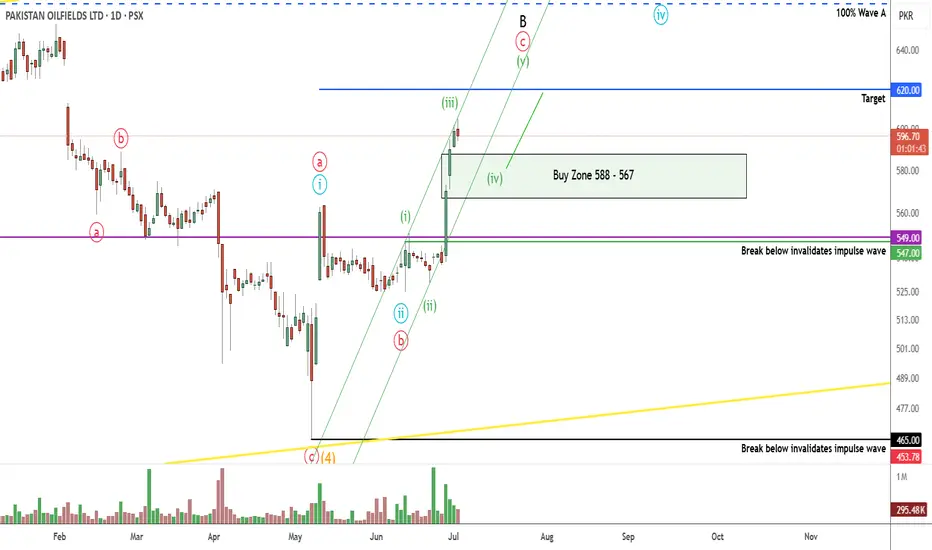
POL PROBABLY IN WAVE '' C '' OR " 3 " - LONGThis is in continuation of our ongoing tracking of POL wave structure.
POL is currently in C or 3 which will target the 620-623 or 680 level. Our preferred wave count is C and we will target the 620 level. If our wave count is correct then prices will decline to our buy zone of 588-567 range as wave 4.
Alternately prices will never go to our buy zone and will reach the 620 - 623 level directly making this trade setup as void.
We will buy in portions at 588 > 580 > 576 level
Trade setup:
Entry price: 588 - 567
Stop loss: 547
Targets: 620 - 623
Let see how this plays, Good Luck!
Disclaimer: The information presented in this wave analysis is intended solely for educational and informational purposes. It does not constitute financial or trading advice, nor should it be interpreted as a recommendation to buy or sell any securities.
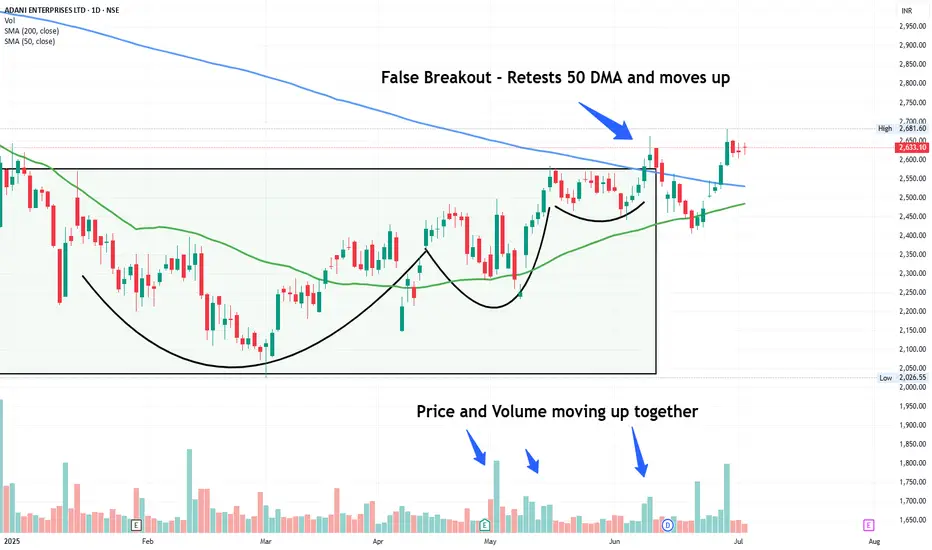
ADANIENT - time for a comeback?Thoughts mentioned on chart. It can attempt to fill the gaps it made while moving down. Good Risk reward on offer