Apple Inc. (NASDAQ: AAPL) – Potential Breakout from Bullish ABCDApple has recently formed a well-structured ABCDE corrective pattern inside a broader sideways range, suggesting accumulation and possible trend continuation on breakout.
Technical Breakdown:
🔸 ABCDE Formation: The structure resembles a contracting triangle or bullish consolidation, marked by higher lows (A, C, E) and lower highs (B, D), signaling price compression.
🔼 Breakout Zone: Price has moved above point (D) briefly and is now consolidating around the $214 zone. A strong close above this could lead to continuation toward the $237 and $260 resistance levels.
🔻 Support Levels:
Minor support at $207.45
Strong base support near $193.44 (ABC low)
📈 Volume Spike: The most recent leg from E to D showed a significant volume surge, indicating possible institutional interest or breakout anticipation.
🔍 Trade Outlook:
A sustained move above $217–$218 with volume could trigger a bullish breakout.
Targets:
First: $237.33 (recent horizontal resistance)
Next: $260.15 (gap-fill or prior high zone)
Risk Management: A drop below $207 would invalidate the structure and suggest further range-bound behavior or downside.
⚠️ Disclaimer: This chart is for educational purposes only. We are sharing a trade setup based on technical signals generated by our private invite-only indicator. This is not financial advice or a recommendation to buy or sell any financial instrument.
📊 The indicator highlights potential buy/sell zones based on a custom strategy developed by our team. In this chart, we are demonstrating how the signal aligned with market structure and trend conditions.
🛑 Regulatory Note: We are an independent development team. Our private indicator and services are not registered or licensed by any regulatory body in India, the U.S., the U.K., or any global financial authority. Please consult a licensed advisor before making trading decisions.

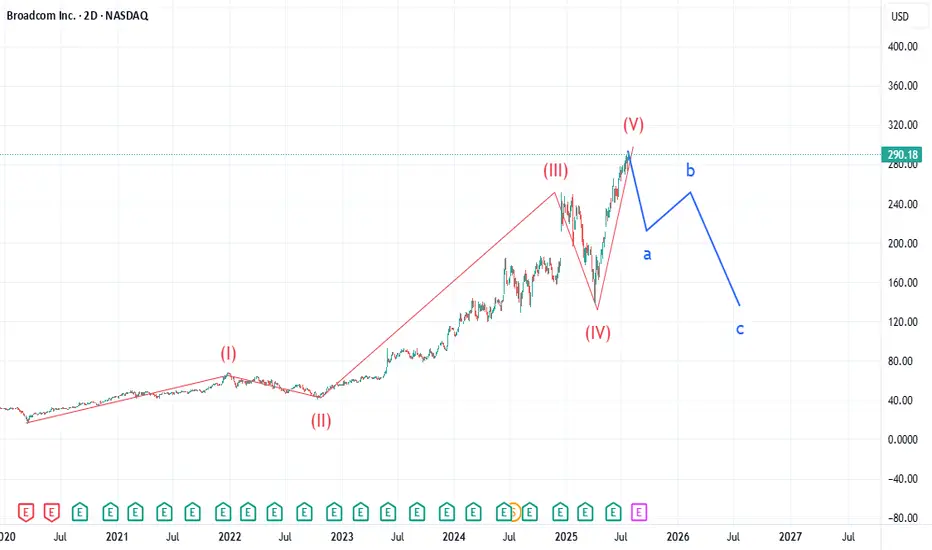
AVGO: Too Many Similarities Market WideLike my chart on BKNG, AVGO is showing an uncanny similarity to Booking.com's chart. Many indices are showing the end of 5 waves in a super cycle dating back to the drop of March 2020. AVGO pt1 is 211. Expecting selling to increase over the next 90 days. Not certain what the catalyst will be, but looking for a major drop in equities over the next 2 weeks. Check IBM chart. I called that drop last week and many stocks will have a similar gap down structure over the next 2 weeks from what I am tracking.
SBI LIFE INSURANCE CO LTD Breakout Watch Above ConsolidationSBI Life has been consolidating in a sideways range between approximately ₹1,770 and ₹1,860 for over 40 days. The price recently tested the upper boundary of this range and closed near the resistance with strong bullish momentum and above-average volume, signaling potential accumulation and a likely breakout attempt.
Technical Highlights:
Range-bound structure: The stock traded in a narrow horizontal channel for over a month, indicating a base formation.
Bullish breakout attempt: Today’s strong green candle with a +2.15% gain is testing the upper resistance zone.
Volume confirmation: The breakout move was supported by a significant volume spike, suggesting increased institutional activity.
Volatility contraction: The tight price action before this move signals a potential volatility expansion, typically preceding a trend.
Potential Price Path:
If the price sustains above ₹1,860 with follow-through buying, the next key resistance levels are projected around ₹2,020–₹2,200.
⚠️ Disclaimer: This chart is for educational purposes only. We are sharing a trade setup based on technical signals generated by our private invite-only indicator. This is not financial advice or a recommendation to buy or sell any financial instrument.
📊 The indicator highlights potential buy/sell zones based on a custom strategy developed by our team. In this chart, we are demonstrating how the signal aligned with market structure and trend conditions.
🛑 Regulatory Note: We are an independent development team. Our private indicator and services are not registered or licensed by any regulatory body in India, the U.S., the U.K., or any global financial authority. Please consult a licensed advisor before making trading decisions.

BKNG: Catalyst for the drop - EarningsBKNG has completed a super cycle 5 wave structure beginning at the completion of the March 2020 COVID drop. First target is 4030 by EOY to early next year. Many other stocks are showing a similar structure, so expecting selling volume to greatly increase over the next 90 days.

$CORZ LoadedTime Frame: 1D
RSI : Bullish
MACD: Bearish, looking for momentum
Fib Levels: Retraced back to 50.0%
Target: $16.28
Pattern invalidated of drop below 61.8% ($10.94) Fib level.

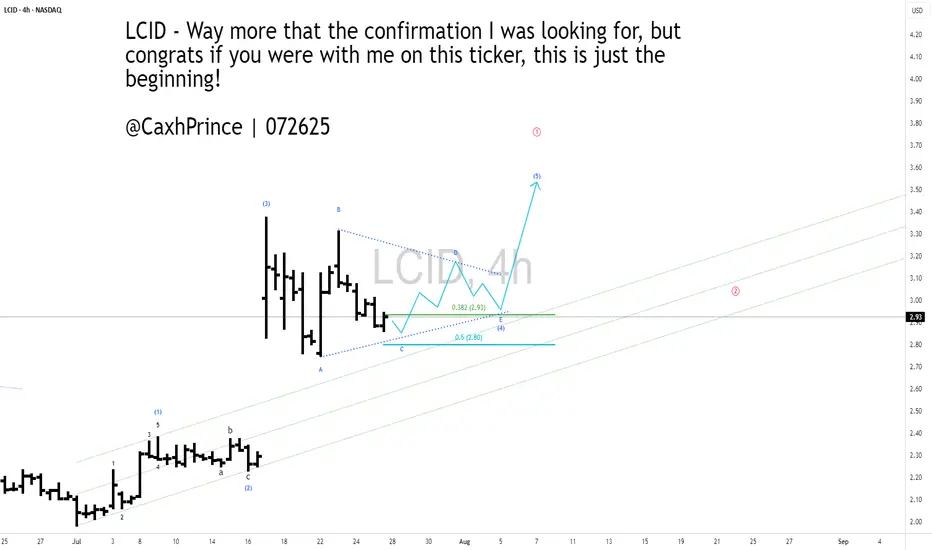
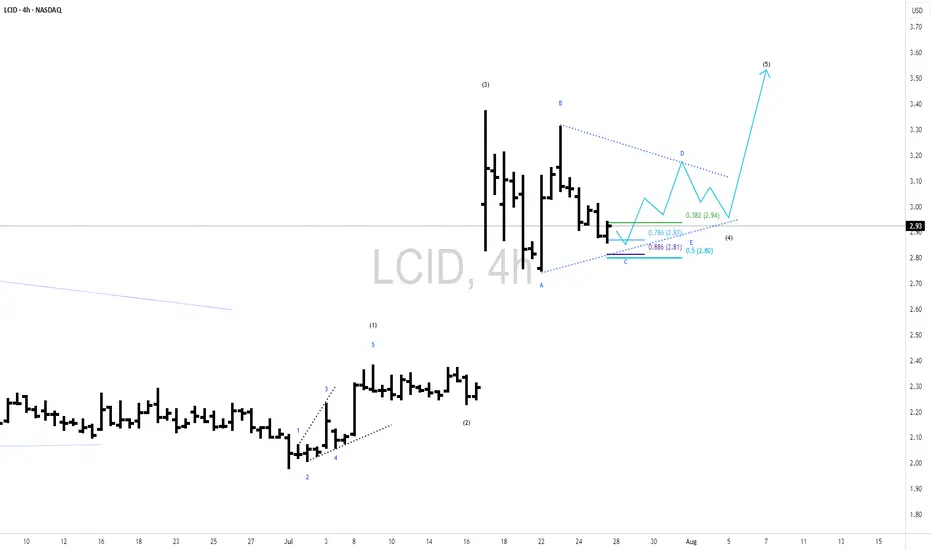
#LCID - 4HR [ A potential bullish view]Lucid blasted off last week with the collaboration of Uber and Robo-taxis. I think that blast infused more investors to the stock and I think it may never come back to take out its lows. If it does, I would load up more on it. I like their designs and the fact that they are now compatible with TESLA's Super Chargers make them even more attractive.
In my count here, I am sensing the current correction could form a triangular pattern for another high before one last correction for ABC down.
Go LCID, Go!!!
Check out my other chart ideas @CaxhPrince everywhere.

ARPL is on the GO and bracing it self for an upward moveDuring the last trading session as of Friday a fresh volume to the tune of 2270% got added, which In absolute value, comes to 54549. Total day end volumes as of yesterday/s trading session were 56518 and these are or were approx. more than 6x of the Avg Vol 10 days and more than 5x of the Avg Vol 20 days....
Daily RSI at 73.47 and Weekly at 61.57. ADX is at 21, implying gearing up for a good move Up.
Lets c how how things go further.....
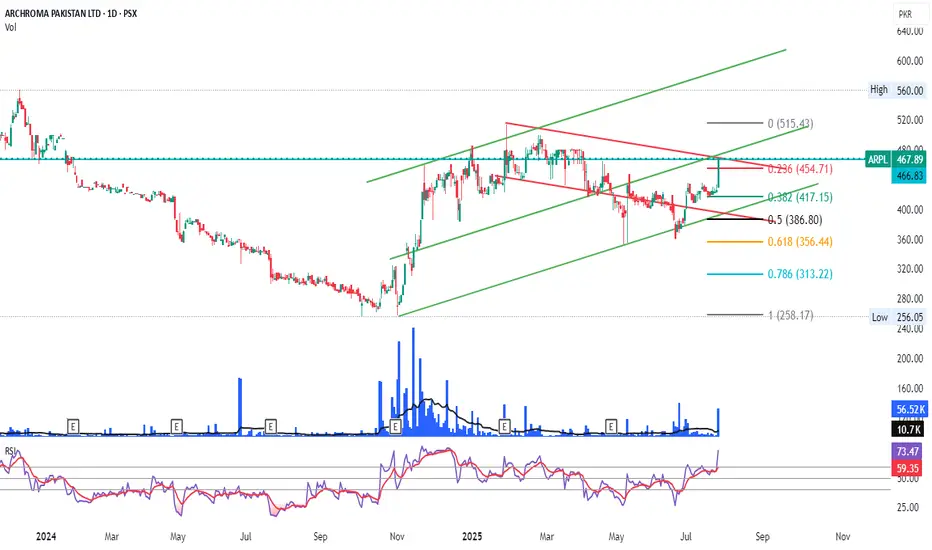
Volume indicates ... people are interested in this stock All info updated on chart. Volume buzz seen on weekly chart. Price levels given. Divergence visible. Capex done 2-3 ago, outcome not yet visible in past results. Lets see here on numbers may improve.

A 4HR Bullish view on #Lucid Motors ($LCID)Lucid blasted off last week with the collaboration of Uber and Robo-taxis. I think that blast infused more investors to the stock and I think it may never come back to take out its lows. If it does, I would load up more on it. I like their designs and the fact that they are now compatible with TESLA's Super Chargers make them even more attractive.
In my count here, I am sensing the current correction could form a triangular pattern for another high before one last correction for ABC down.
Go LCID, Go!!!
Check out my other chart ideas @CaxhPrince everywhere.
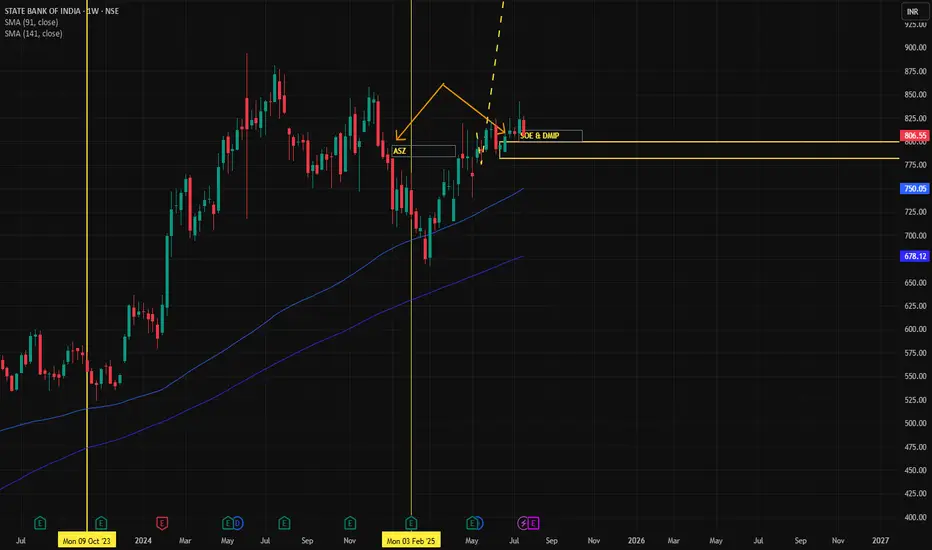
SBIN✅ Updated Trade Plan Summary
✅ Updated Trade Plan Summary
Metric Previous Value Updated Value
Entry 800 800
Stop Loss (SL) 757 775
Risk 43 25
Target 1256 1256
Reward 456 456
Risk-Reward (RR) 10.6 18.2
🔍 Implications of the Change
🔽 Risk reduced from 43 to 25 points
✅ RR improved significantly from 10.6 to 18.2, showing a more optimized entry
🔐 Stop Loss at 775 is now just below the Daily Demand zone (775–757) — tighter but still inside structure
🎯 Target remains the same, making the setup more efficient from a capital allocation and position sizing standpoint
⚠️ Caution Point
SL is just at the edge of the Daily Proximal Zone. If there's volatility and a liquidity grab below 775, there’s a minor risk of being wicked out before direction resumes.
You may consider partial entry or buffer SL at 770 if price volatility is high.
🧠 Key Trade Logic Still Holds
All Higher, Mid, and Intraday Timeframes show strong UP trend.
ASZ + DMIP + SOE confirmation from Weekly zone at 799 still valid.
Price trades well above Gann level of 766 and above ITF Demand clusters (782–787).
Weekly Demand at 800–780 is your live demand engine.
📌 Supportive Zones Recap
Timeframe Demand Zone (Proximal–Distal)
Weekly 800 – 780
Daily 775 – 757
ITF (Avg) 788 – 782
📈 Conclusion
This is an optimized entry with better RR (now 18.2), assuming volatility is managed.
Good structure, strong MTF alignment, and you're sitting inside the Weekly Demand Zone.
Monitor 775-770 zone — if broken with volume, re-evaluation may be needed.
My thoughts on LCID-4HRLucid blasted off last week with the collaboration of Uber and Robo-taxis. I think that blast infused more investors to the stock and I think it may never come back to take out its lows. If it does, I would load up more on it. I like their designs and the fact that they are now compatible with TESLA's Super Chargers make them even more attractive.
In my count here, I am sensing the current correction could form a triangular pattern for another high before one last correction for ABC down.
Go LCID, Go!!!
Check out my other chart ideas @CaxhPrince everywhere.
Tanla platforms getting ready for the next phase of growth ? At the trend line. Price has done nothing since 2022. Company is buying back shares and announced new AI based solutions being rolled out. Chart looking interesting. Wait for a break above trend and the 200 EMA.

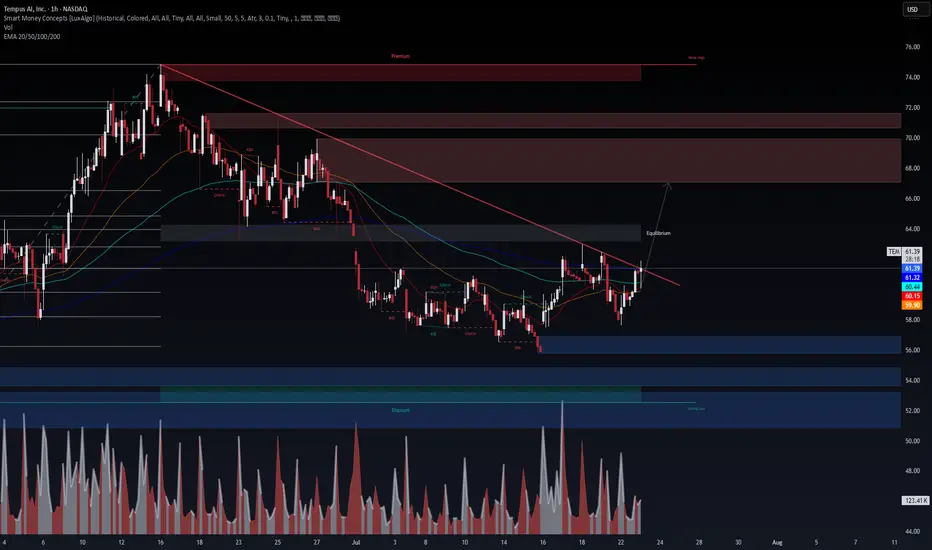
$TEM – Breakout Imminent After Accumulation? NASDAQ:TEM – Breakout Imminent After Accumulation? 📈
Tempus ( NASDAQ:TEM ) is flashing strong bullish signals backed by smart money and confirmed option flow.
🔹 Technical Picture (1H)
Trendline just broken to the upside
Clean break of structure (BOS) after sweep of June/July lows
Volume spike + EMA realignment confirms momentum shift
Targeting the $66–$70 equilibrium zone short-term
High timeframe liquidity sits above $74 — a magnet if momentum continues
🔹 Options Flow (July 23 @ 6:54 AM)
$56K call sweep for Aug 1 $66C (To Open)
Smart money positioning for a rapid move higher — not retail-driven
🔹 VolanX Bias: Bullish
Long trigger confirmed on trendline break and BOS
Risk: < $59.50
PT1: $66
PT2: $70
PT3: $74+ (if volume sustains)
This is now on VolanX watchlist as a potential stealth breakout fueled by institutional flow.
⚠️ For educational purposes. Not financial advice. VolanX Protocol active.
#TEM #Breakout #OptionsFlow #SmartMoney #VolanX #TradingView
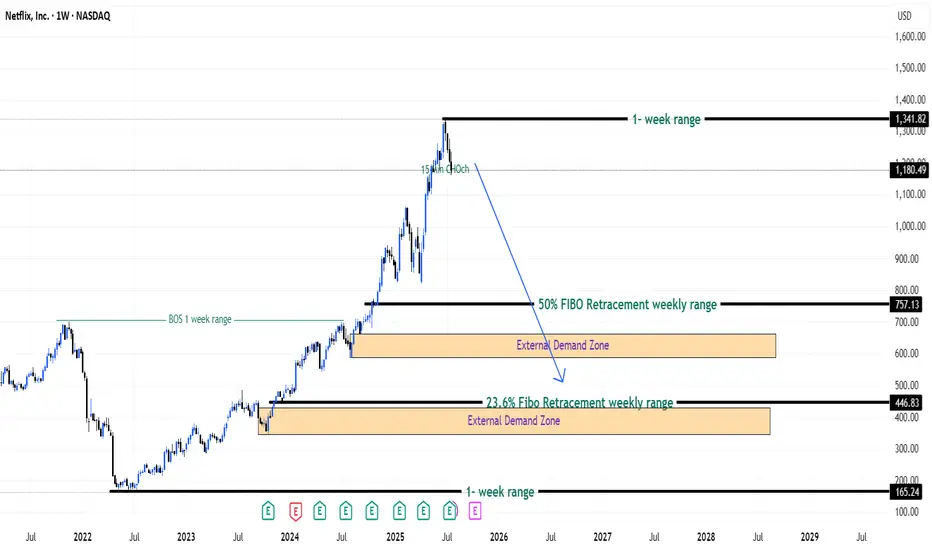
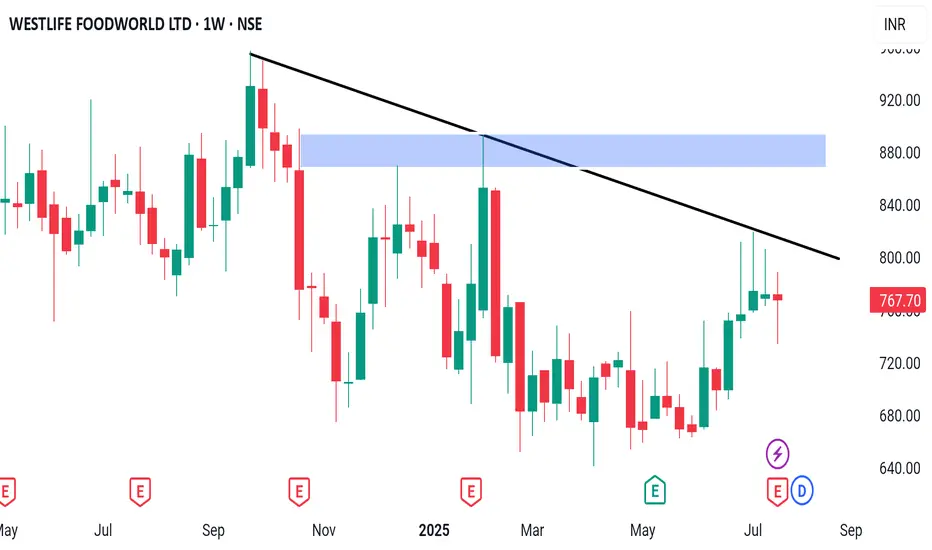
Bulls Quit? Bears Ready! - Netflix Stock (USA) - {27/07/2025}Educational Analysis says that Netflix (USA Stock) may give trend Trading opportunities from this range, according to my technical analysis.
Broker - NA
So, my analysis is based on a top-down approach from weekly to trend range to internal trend range.
So my analysis comprises of two structures: 1) Break of structure on weekly range and 2) Trading Range to fill the remaining fair value gap
Let's see what this Stock brings to the table for us in the future.
DISCLAIMER:-
This is not an entry signal. THIS IS FOR EDUCATIONAL PURPOSES ONLY.
I HAVE NO CONCERNS WITH YOUR PROFITS OR LOSS,
Happy Trading,
Stocks & Commodities TradeAnalysis.
My Analysis is:-
Short term trend may be go to the external demand zone.
Long term trend breaks the new high after going from discount zone.
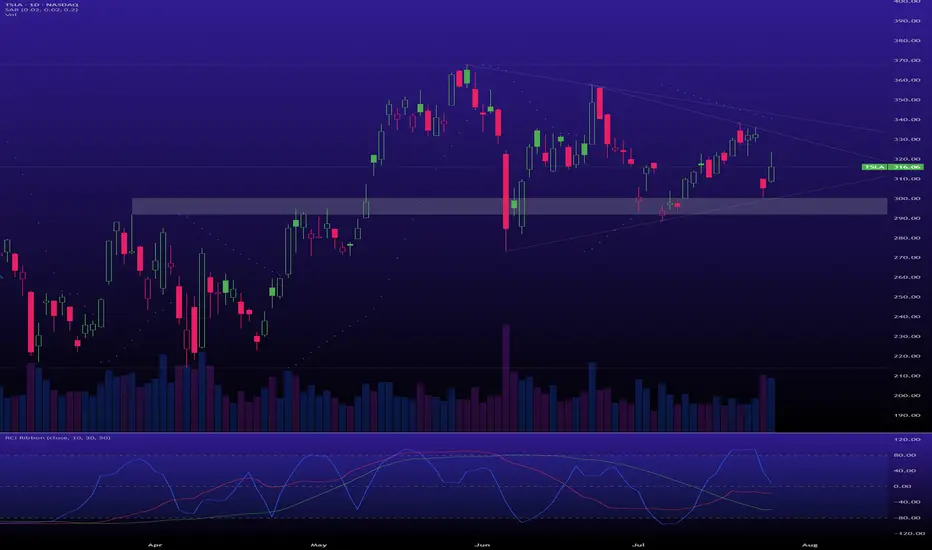
$TSLA is in an accumulation phase.A classic Wyckoff scenario is playing out, offering a prime opportunity if you have the nerve for it.
Support: The key support zone is $300 - $305. As long as this holds, the bullish thesis is intact.
Resistance: The primary target is the top of the multi-month accumulation range, around $370 - $380. A breakout above this would signal the start of a major new markup phase.
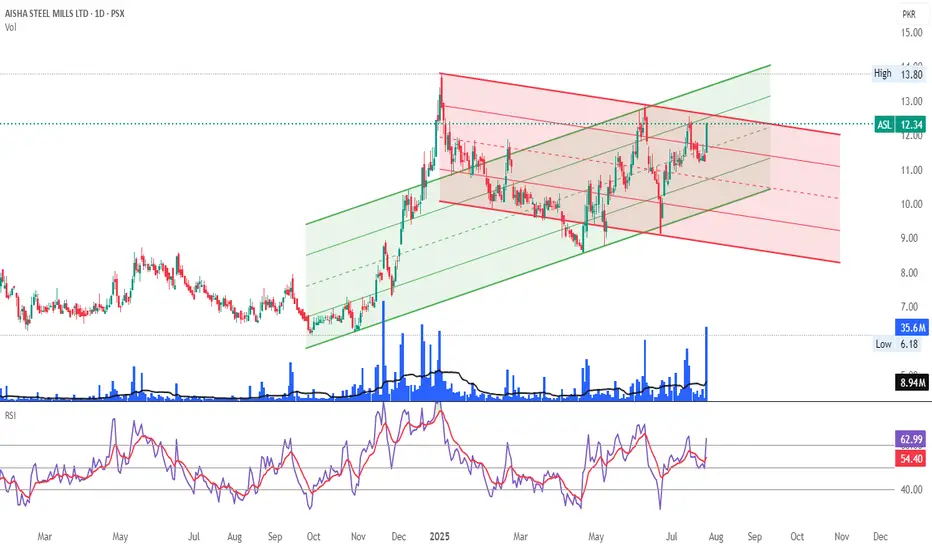
ASL another perspectiveASL another perspective with Ascending Green Channel and Descending Red Channel.
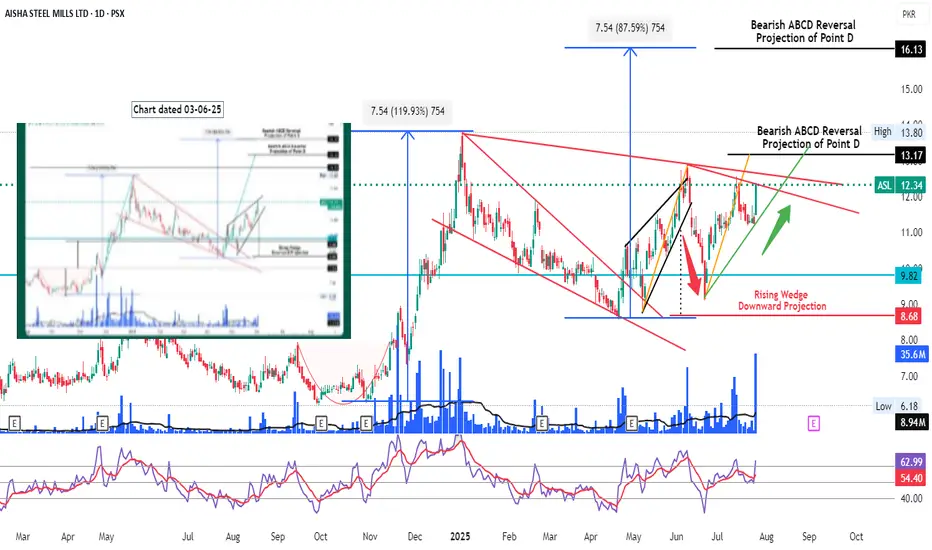
ASL moving towards the projectionsASL is moving towards the anticipated TPs. May be watched on and placed on watchlist to track price meovement
AMZN HEADING INTO AUG 25'SHORT AMAZON
Amazon is current going to retest all time highs.
I want amazon again for a buy in the $209-218 range.
I don't think see Amazon below $208 again.
Going to fail on retest of ATH right now and cool off, bring rsi down back to 50-60 Zone, before consolidating for a break of the all time highs to close out the year.
Amazon always shines in Q4 with Holidays, so expect a great close to the year, but it's an overbought stock right now. (isn't it always??...lol)

AAPL HEADING INTO AUG 25'AAPL TOPPED @ 250-260 TO CLOSE OUT 24
BAD Q1
Consistent since then.
Consolidation happened @ key weekly support $194-198 range, solid move up after.
Long Apple currently.
They have the IPHONE 17 releasing in Sept with a few new colors and new back design as well as other affordable options to assist with consumer retention, entry and re entry into the apple hemisphere for consumers.
Earnings July 31st, currently expected to increase YOY for Q3.
I expect earnings to come in strong to assist with the move up to try and work back to retest ATH again.
Long back up to $247 range to close out 2025 for Apple. End of year Q3, Q4 is always their time to shine. Don't think we see a break of ATH in 2025 for Apple though. Retest, to come back down slightly again before major break.

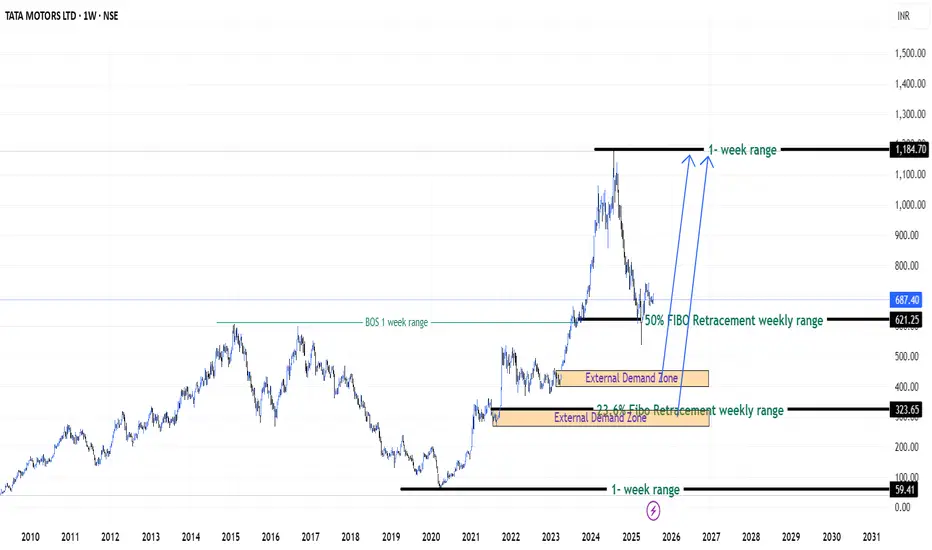
Patience on Tata Motors Stock (India) - {27/07/2025}Educational Analysis says that Tata Motors (Indian Stock) may give trend Trading opportunities from this range, according to my technical analysis.
Broker - NA
So, my analysis is based on a top-down approach from weekly to trend range to internal trend range.
So my analysis comprises of two structures: 1) Break of structure on weekly range and 2) Trading Range to fill the remaining fair value gap
Let's see what this Stock brings to the table for us in the future.
DISCLAIMER:-
This is not an entry signal. THIS IS FOR EDUCATIONAL PURPOSES ONLY.
I HAVE NO CONCERNS WITH YOUR PROFITS OR LOSS,
Happy Trading,
Stocks & Commodities TradeAnalysis.
My Analysis is:-
Short term trend may be go to the external demand zone.
Long term trend breaks the new high after going from discount zone.
Trendline breakout Looking good pattern for trendline breakout
Main thing may come in liquidity in the stock
Apart from that you can see good structure for trendline breakout
Watch CRTM 233% or 1.691M additional vol got injected on last trading session. Total day end volumes are more than 2x of the Avg Vol 10 days. One Bullish GAP Mitigated marked in GREEN.
Can or may be watched.

Bull rally on gujrat gasTarget -580
Support at 450
Only for educational purpose
Not any buy and sell recommendations
Healthy education
