AMDAMD is in a nice channel and should be bought at the lows of the channel so this look's like a good time to get long.

7/1/25 - $wolf - Some ppl r not worth saving7/1/25 :: VROCKSTAR :: NYSE:WOLF
Some ppl r not worth saving
- go read the last comment
- here we are again... people are somehow allowing the bag holders to exit at more than zero for the thrill of playing a losing game
- not only has the company told you the stock is going to zero, they've made this clear a number of times
- only reason to monitor these things is to get a pulse on "liquidity" and willingness to play dumb games and win dumb prizes
- good luck! avoid
V

7/1/25 - $arbk - "restructure" 1017/1/25 :: VROCKSTAR :: NASDAQ:ARBK
"restructure" 101
- when a company goes to "restructure" that's a euphemism for sending your shares to donut heaven
- sign of the times. sometimes it's hard to imagine what goes thru ppl's minds or if they do literally even 30 seconds of "work" before buying things
- just recently this happened with $wolf... which i was flamed for pointing out. i think that's also ... *checks notes* also up 125% as of my writing this.
- as comedian ron white used to say "can't fix stupid"
- sometimes the best move is no move at all. put it in the big stack of "ignore".
V

NiKE annual continuation of the trendNike, a globally recognized, enduring brand, feels almost "too big to fail." I've been monitoring the $70 price level as a potential entry point for a wick fill trade in the near future, aiming for a 100% to 200%+ ROI over 6 months to 2 years. The stock shows signs of downside exhaustion and oversold conditions. Despite recent revenue declines, market cycles and Nike’s nearly 50-year brand resilience suggest a potential rebound.

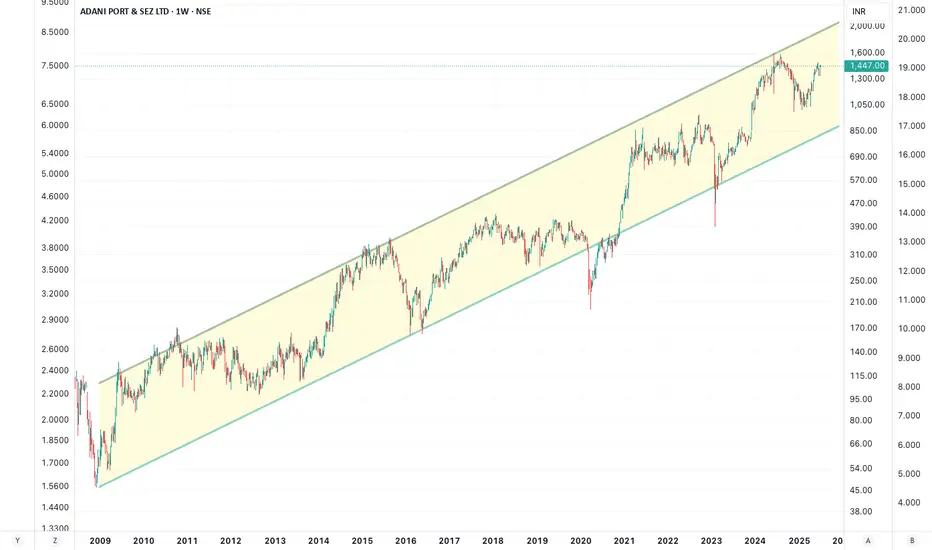
Adani PortAdani Port , 27X, CAGR 25%
16 years, consistently chugging along
Hindenburg
Hamas
Haifa
Nothing could stop this Titan.
India-Middle East-Europe Economic Corridor (IMEC) when operational will make this into a 5 lakh crore company.
Oberoi Realty SellOberoi Realty break below its trend line. Sell @CMP (1910) with SL of 1990 and target of 1850, 1805 & 1770.

SBI Life Long_Shows StrengthSBI Life Long:
- Price Shows strength.
- Consolidated for few days & today's candle Engulfed
prior week's entire price action
- Looks good for Long in short term.
- SL: Today's Low

$NSP is ready to fly NorthStock is ready & heading North.
We are waiting closing above 62.50
Targets of the trade 65 $ 67$ and 70$

Rockwell Automation | ROK | Long at $268.96Rockwell Automation NYSE:ROK appears to be gaining upward momentum once again. With two price gaps above (highest near $333+) and the historical simple moving average lines showing a positive change, this company could be poised to fill the gaps soon. A strong billion-dollar company with rising revenue, but stay cautious of the slightly high debt, insider selling, and changing economy / tariff implications.
At $268.96, NYSE:ROK is in a personal buy-zone.
Targets:
$300.00
$333.00

MSFT - Negative Bubble (Short term Buy Cycle) MSFT
Short Term Buy Cycle
TP@498.27
% bubble ratio
Currently in a short term buy cycle with fair value at 498.27
Spot trading plan:
Start to buy from (-10%) bubble ratio and below

BHEL BuyBHEL seems to take support at channel support-line. Buy @CMP (260) with a SL of 240 and target of 265, 280 & 300

Divis Lab SellDivis Labarotoris breaks trend line. Sell @CMP (6590) with SL of 6703 and target of 6400

JELD-WEN Holdings | JELD | Long at $4.02JELD-WEN Holdings NYSE:JELD designs, manufactures, and sells wood, metal, and composite materials doors, windows, and related building products in North America and Europe. The stock has taken quite a beating since the rise in interest rates, and I think a reversal *may* be in sight in the next year as rates are slowly lowered - even if the market is forward-thinking and purely anticipating a new housing boom (which I highly doubt given the current home prices). Regardless, there is risk with this stock since it has relatively high debt (debt-to-equity of 2.61x). A Quick Ratio of 1.1 and Altman's Z Score of 1.9 puts NYSE:JELD near a medium level of bankruptcy risk. The company has pretty good cash reserves and a forward P/E of 10x (current is negative), so growth is anticipated. Book value of $5.31.
A bear case here is a terrible earnings call in August 2025 due to the housing market slowing (i.e. people pausing home purchases/builds/repairs expecting interest rates to drop soon). That may plummet the stock near $1.00 or below, which would be a tremendous deal, *unless* the company fundamentals change (like bankruptcy).
Without a crystal ball, yet understanding the forward-thinking aspects of the market, NYSE:JELD is in a personal buy-zone at $4.02 with some risks.
Targets into 2027:
$5.40 (+34.3%)
$8.50 (+111.4%)

Bgl45 minute time frame shows a potential falling wedge /flag
Macd, Rsi and stochastics in play
Target is 140 a share in my humble opinion from what I'm seeing

aapl just got great news, great stock! ATH coming?? YEA???aapl just got great news, great stock!
bullish. so very bullish
let us know!
free transparent no edit no delete
🐉We value full transparency. All wins and fails fully publicized, zero edit, zero delete, zero fakes.🐉
🐉Check out our socials for some nice insights.🐉
information created and published doesn't constitute investment advice!
NOT financial advice

ABEOABEO is currently trading at $5.58 and is expected to pull back toward the green zone to retest the previously broken descending trendline and the strong demand area between $4.75 and $5.08.
This zone is considered a key support level, where buying pressure has been historically strong. A successful retest could signal a continuation of the bullish trend.
The medium-term target is the red supply zone between $11.39 and $12.69, which represents the next major resistance area.
✅ Entry Zone: $4.75 – $5.08 (demand zone)
🎯 Target Zone: $11.39 – $12.69 (supply zone)
❌ Stop-Loss: $3.90 (below previous key low and invalidation of structure)


ALBERT DAVIDAlbert David Ltd. is a pharmaceutical company engaged in the manufacturing and marketing of formulations, bulk drugs, and healthcare solutions. It serves domestic and export markets with products across therapeutic areas such as gastroenterology, gynecology, and general medicine. The stock is currently trading at INR 881.55, showing signs of upward momentum following a period of consolidation.
Key Levels
Support Levels: INR 758.00, INR 970.50, INR 1,141.30
Swing Level: INR 881.55
Possible Upside: INR 1,545.65, INR 1,758.55, INR 2,027.70
Technical Indicators
RSI (Relative Strength Index): Currently at 46.17, suggesting neutral momentum. A break above the mid-50s range would confirm growing strength.
Volume: At 21.34K, the rising volume alongside recent price uptick signals early signs of accumulation and potential trend development.
Sector and Market Outlook
Albert David operates in India’s formulation-driven pharmaceutical sector, which is buoyed by:
Consistent domestic demand for generics and branded formulations
Increased R&D investments for differentiated dosage forms and APIs
Evolving export strategy amid global interest in Indian pharma suppliers
Challenges include pricing caps by regulators, raw material import reliance (especially for APIs), and generic competition from larger incumbents.
Latest Developments
Manufacturing Upgrade: Recent investments in facility modernization to meet evolving GMP standards
Product Portfolio Expansion: Strengthening presence in anti-infectives and critical care segments
Earnings Performance: Sequential growth in operating margins with a focus on efficiency and therapeutic diversification
Dividend Update
Albert David Ltd. has maintained a consistent payout strategy, most recently declaring a dividend of ₹5.00 per share, reflecting stable fundamentals and shareholder alignment.
Analysis Summary
Albert David Ltd. is exhibiting a technically constructive setup within the broader pharma space. While momentum remains neutral, increasing volume and structural stability support a positive outlook. With improving fundamentals and rising investor participation, the stock may be entering a base-building phase with scope for medium-term trend development as sector sentiment strengthens.

TELE is in bullish channelTELE is in a bullish channel, a long position may be taken at specified entry price.

AVN has completed its retracementAVN has completed its retracement, and taking support from its trendline

SYS has completed its retracementSYS has completed its retracement and is taking support from its trendline.
A bullish movement can be observed

LOTCHEM is bullishLOTCHEM has completed its retracement and already formed HL, now it's moving to form new High.
