Apollo Hospital Long_Support @ 20 DEMAApollo Hospital Long:
- Price Takes support at 20 DEMA
- Earnings next week
- Enter long with tight SL
- SL - CLose below 20 DEMA

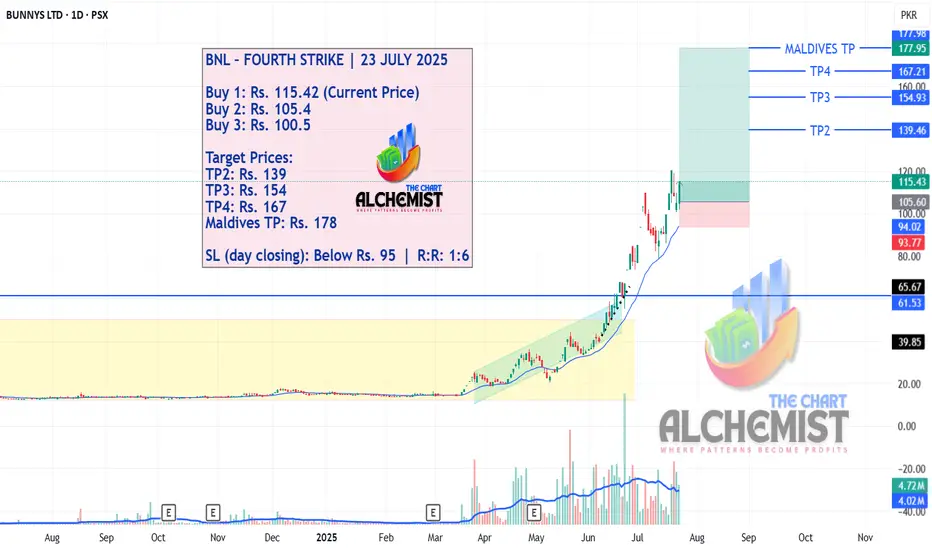
BNL – FOURTH STRIKE | 23 JULY 2025 BNL – FOURTH STRIKE | 23 JULY 2025
After taking three strikes—with all targets achieved for two strikes and TP1 achieved for the third—BNL stock went into a pullback. However, the pullback is now over, and the stock is expected to rise again to achieve multiple quantified displacement targets.
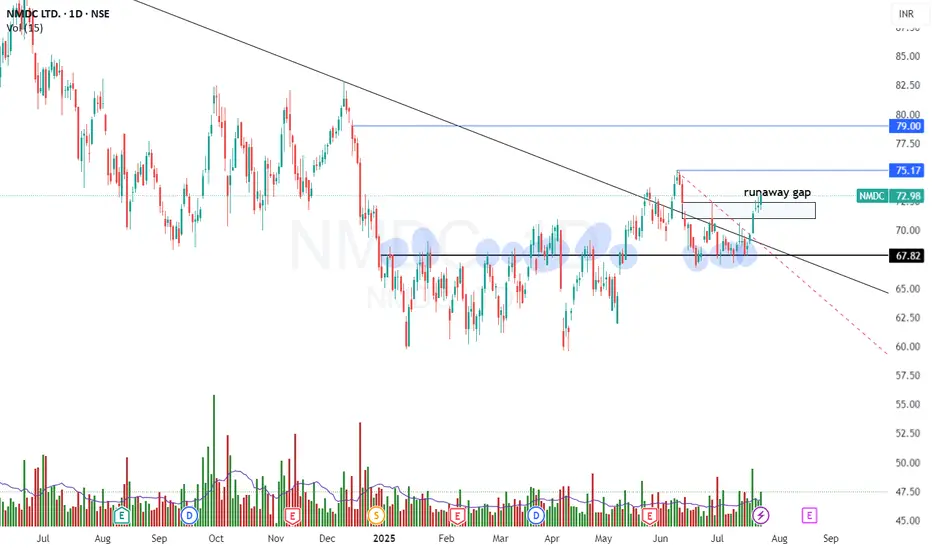
NMDC – Bullish Trend Reversal with Breakout Setup📈 NMDC – Bullish Trend Reversal with Breakout Setup (For Study Purpose Only)
NMDC has displayed a bullish trend reversal following a prolonged 6-month consolidation between ₹60–68. The stock broke out decisively above this range and has since retested the breakout zone successfully, confirming it as a strong support.
Subsequently, the stock entered a 1-month sideways consolidation between ₹67–73, forming a tight base—typically a sign of strength and potential continuation.
🔍 Technical Highlights:
✅ Breakout Zone: ₹68 (now acting as strong support)
🔁 Retest Completed: Post-breakout pullback respected support
🧱 Current Range: ₹70–73 (tight consolidation near highs)
📊 Volume: Gradual increase near resistance, indicating accumulation
📈 RSI & MACD: RSI climbing steadily; MACD shows bullish crossover
🎯 Trade Setup (for study purpose only):
Watch for strength above: ₹73
Stop-Loss (SL): ₹69
Targets: ₹75 (initial), ₹80–82 (extended)
📌 Note:
This analysis is intended for educational and study purposes only. Always conduct your own due diligence or consult a certified financial advisor before making any investment decisions.
OVERSOLDLooking for back over 300 quickly CEO just $2.44 million strong Q2 revenue growth of 14.3% year-over-year to $49.42 billion, revenue is as good as it was at 500$ but expenses have been high. Institutions are loading here, good long-term hold if we need to continue DCA.
Review and plan for 24th July 2025Nifty future and banknifty future analysis and intraday plan.
Quarterly results.
This video is for information/education purpose only. you are 100% responsible for any actions you take by reading/viewing this post.
please consult your financial advisor before taking any action.
----Vinaykumar hiremath, CMT

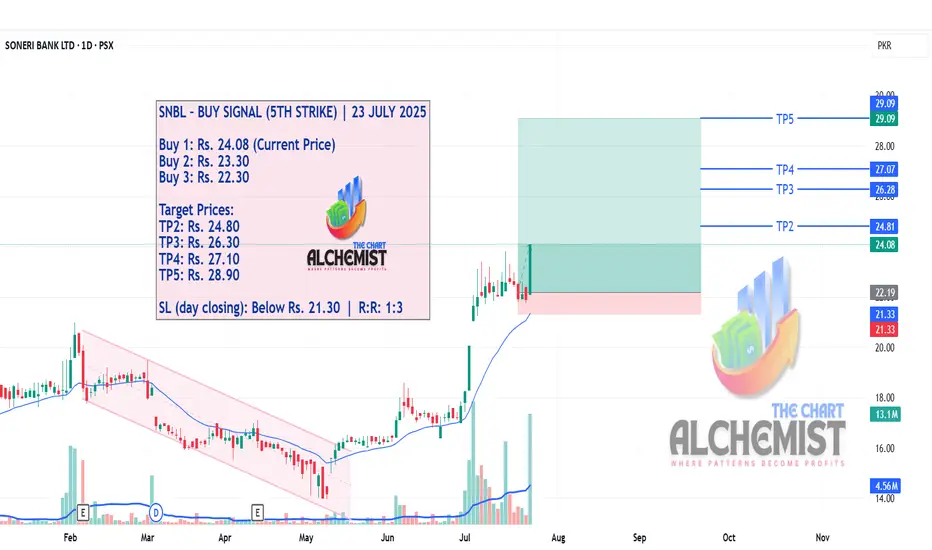
SNBL – BUY SIGNAL (5TH STRIKE) | 23 JULY 2025SNBL – BUY SIGNAL (5TH STRIKE) | 23 JULY 2025
After successfully achieving all targets of the first three strikes and TP1 of the fourth strike, SNBL now presents a fresh opportunity for a 5th strike. The stock continues to follow its upward trajectory, and the current bullish structure justifies another long entry setup targeting higher displacement levels.
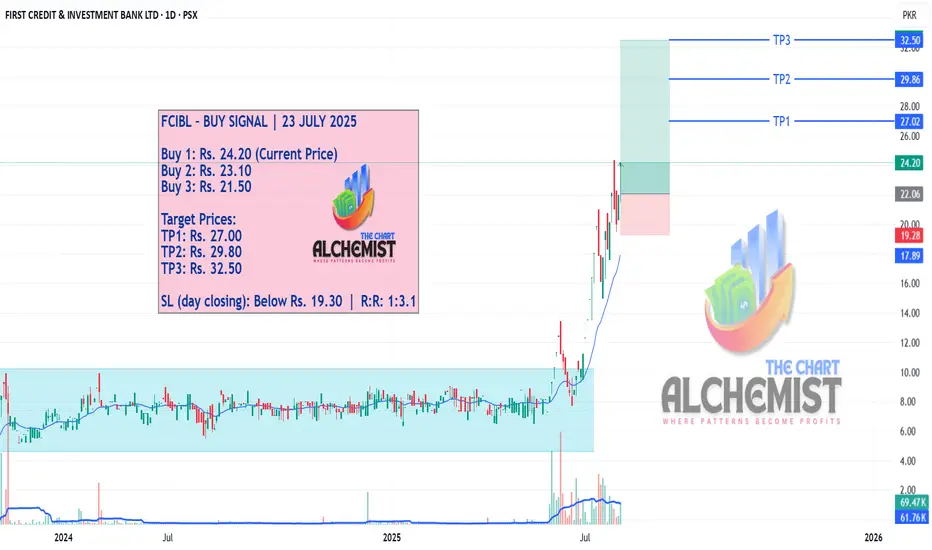
FCIBL – BUY SIGNAL | 23 JULY 2025FCIBL – BUY SIGNAL | 23 JULY 2025
The stock was previously moving in a consolidation phase marked with a light blue color channel. After giving a breakout and marking a high of Rs. 13.35, FCIBL entered a pullback. Post-pullback, it surged sharply to Rs. 20.90. The uptrend remains intact, and we now expect it to continue toward multiple quantified displacement targets, presenting a fresh opportunity for a long entry.
AW1 analysisIgnore the below write-up and watch the video.
Lorem Ipsum is simply dummy text of the printing and typesetting industry. Lorem Ipsum has been the industry's standard dummy text ever since the 1500s, when an unknown printer took a galley of type and scrambled it to make a type specimen book. It has survived not only five centuries, but also the leap into electronic typesetting, remaining essentially unchanged. It was popularised in the 1960s with the release of Letraset sheets containing Lorem Ipsum passages, and more recently with desktop publishing software like Aldus PageMaker including versions of Lorem Ipsum

ATIL – BUY SIGNAL | 23 JULY 2025 – SECOND STRIKEATIL – BUY SIGNAL | 23 JULY 2025 – SECOND STRIKE
We previously issued a buy call on ATIL, which successfully achieved all targets. Following that, the stock entered a pullback phase, which now appears to have completed. The current price action indicates that ATIL is poised to resume its upward movement, targeting multiple quantified displacement levels. This marks a Second Strike opportunity for a technically sound long entry.

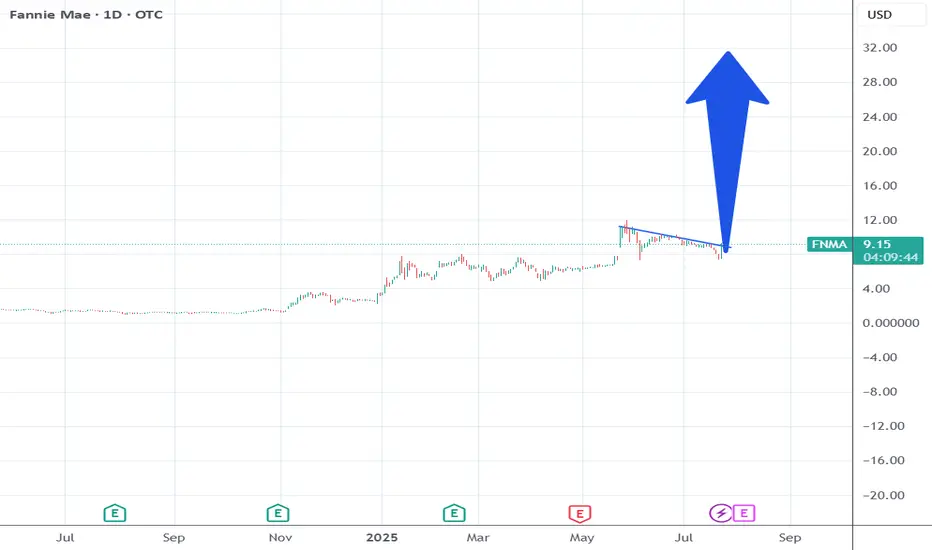
Trump will approve the FNMA privatization within 10 days.Trump works for Wall St. He plans his moves based on what Wall St wants.
He says stuff at certain times to get the markets to react in key times for Wall St.
The overall market is going to correct within the next 30 days.
FNMA just did a shakeout the last 3 weeks.
So Trump will time his announcement to correlate with the events of Wall St.
Remember he was going to do this his 1st term.
18 dollars in the next 3 weeks.
HUMNL – BUY SIGNAL | 23 JULY 2025 HUMNL – BUY SIGNAL | 23 JULY 2025
HUMNL stock has been trending upward within a light blue ascending channel. After breaking below this channel, it formed a double bottom pattern and reversed to the upside. This reversal consolidated within a red-colored mini trading range. Today, the stock has broken out of that consolidation and has now constructed two bullish structures, indicating strong upward momentum and offering a technically safe entry zone.

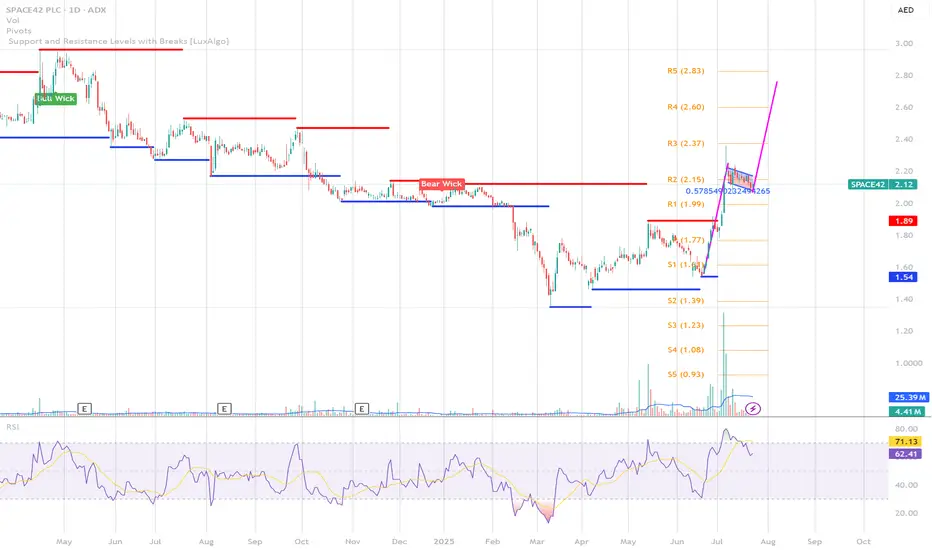
preparing for lift-off with Bullish flag formation on SPACE42? Traders, take a look at this beauty unfolding on SPACE42's daily chart 👀
After a powerful upward thrust — a textbook "flagpole" — price action has been gently coiling down within a tight parallel channel. This classic **bull flag** pattern suggests we might just be seeing a pause before the next big move. 🏁
Key Highlights:
* Sharp rally → momentum confirmed ✅
* Flag consolidation → decreasing volume 💤
* Breakout potential → waiting on the edge 🚀
What to watch:
* A strong close above the upper trendline with volume could ignite the next leg up 🔥
* Target projection? Classic bull flag logic says: measure the pole, add it to the breakout 💡
Not a recommendation — just a chart talking loud and clear! 🎯
Let’s see if SPACE42 honors the pattern... or fakes out. Stay nimble, stay sharp ⚡
#SPACE42 #BullFlag #ChartPatterns #TechnicalAnalysis #PriceAction
75 by year end?This may hit 75 soon, may be by end of the year. I am buying any dip from current price. All the best. Not a financial advise.

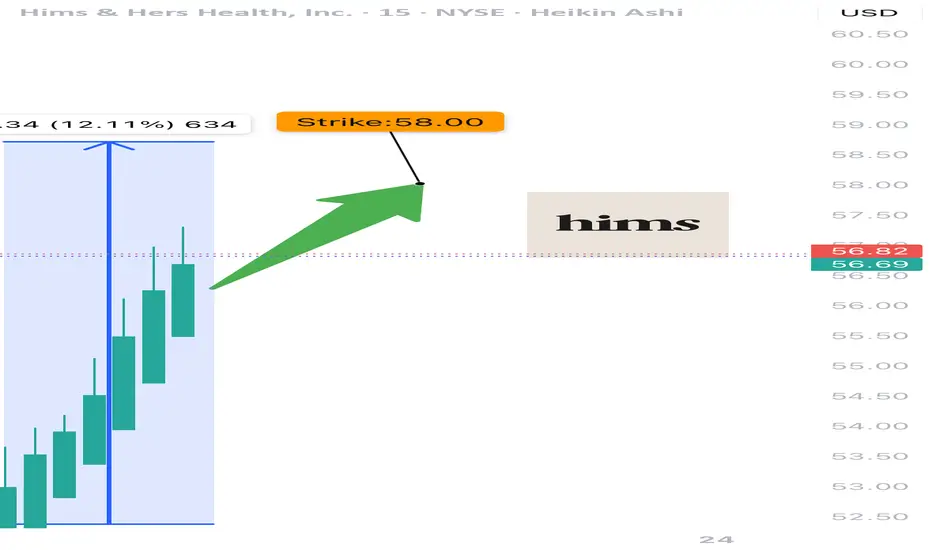
HIMS WEEKLY BULLISH PLAY — 07/23/2025
🩺 HIMS WEEKLY BULLISH PLAY — 07/23/2025
📈 Momentum Up, Flow Bullish, Time Tight — Let’s Ride It
⸻
🔍 MARKET SNAPSHOT
5-model AI consensus = ✅ BULLISH
Why?
• 📈 Weekly RSI = 58.2 (Rising) — Clear momentum
• ⚖️ Call/Put Ratio = 1.63 — Big call volume (45K+)
• 📉 Volume = 0.9x — ⚠️ Slight institutional hesitation
• 🌪️ VIX = 16.0 — Low volatility = smoother execution
⸻
🎯 TRADE IDEA — CALL OPTION PLAY
{
"instrument": "HIMS",
"direction": "CALL",
"strike": 58.00,
"entry_price": 0.86,
"profit_target": 1.72,
"stop_loss": 0.43,
"expiry": "2025-07-25",
"confidence": 75%,
"entry_timing": "Open",
"size": 1 contract
}
⸻
📊 TRADE PLAN
🔹 🔸
🎯 Strike 58 CALL
💵 Entry 0.86
🎯 Profit Target 1.72 (+100%)
🛑 Stop Loss 0.43 (tight risk)
📅 Expiry July 25 (2DTE)
⚡ Confidence 75%
📈 Size Suggestion Risk 2–3% of capital
⚠️ Key Risks Low volume + high gamma exposure
⸻
🧠 MODEL TAKEAWAYS
✅ RSI and momentum are clearly aligned upward
✅ Call flow = bullish commitment
⚠️ Volume is light → watch for momentum stalls
⚠️ Gamma risk = manage tight, exit fast
⸻
💬 Drop a 🧠 if you’re tracking
📈 Drop a 💥 if you’re in this call
🛎️ Trade tight — expiration Friday, HIMS is moving on momentum not mass
#HIMS #OptionsTrading #CallOptions #BullishPlay #MomentumTrade #ZeroDTE #GammaScalp #AITrading #HealthcareStocks
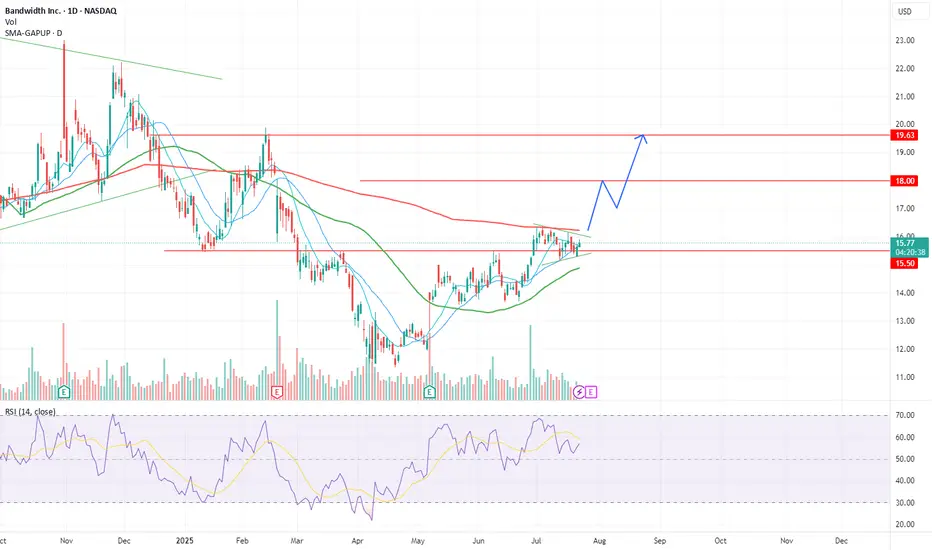
BAND is currently held by the 200 MANASDAQ:BAND is showing positive signs and may be ready to post some gains if it breaks above the 200 day moving average. Anticipated price action and targets are shown on the chart, stop loss daily close below 15.15$.
PS. My views only, not financial advice!
Pole and Flag The pole and flag pattern is a classic continuation pattern in technical analysis, often signaling that the current trend is likely to continue after a brief consolidation. The pattern consists of:
Pole: A sharp, nearly vertical movement in price reflecting strong market momentum.
Flag: A consolidation phase where price moves within parallel trendlines, usually sloping against the direction of the pole, indicating a pause before the next move.
In the provided chart of Muthoot Finance Ltd., the stock exhibits a textbook bullish pole and flag formation, suggesting potential for further upside if technical conditions are met.
How to Trade the Pole and Flag Pattern
1. Entry Point
Enter Long: When price closes above the flag’s upper trendline or resistance level on higher-than-average volume. This confirms the breakout and continuation of the uptrend.
2. Setting the Target
Target Calculation: Measure the distance from the lowest to the highest point of the pole. Add this value to the flag's breakout point to project the potential price target.
For example: If the pole is 400 points (from 2,300 to 2,700) and breakout occurs at 2,700, the target is 3,100.
3. Stop-Loss Placement
Set Stop-Loss: Just below the lower trendline of the flag or recent swing low. This minimizes risk in case of a failed breakout.
4. Volume Confirmation
Confirmation: A valid breakout should be accompanied by a spike in volume, reflecting renewed buying interest.

Block | XYZ | Long at $64.84Block's NYSE:XYZ revenue is anticipated to grow from $24 billion in FY2024 to $32 billion in FY2027. With a current price-to-earnings ratio of 13.8x, debt-to-equity ratio of 0.36x, and rising cash flow in the billions, it's a decent value stock at its current price. Understandably, there is some hesitation among investors due to competitive fintech market and economic headwinds. But, like PayPal NASDAQ:PYPL , growth is building.
From a technical analysis perspective, the price dropped to within my historical simple moving average bands. Often, but not always, this signals a momentum change and the historical simple moving average lines indicate an upward change may be ahead. While the open price gaps on the daily chart in the $40s and GETTEX:50S may be closed before a true move up occurs, NYSE:XYZ is in a personal buy zone at $64.84.
Targets:
$80.00
$90.00
$100.00
[*) $134.00 (very long-term)

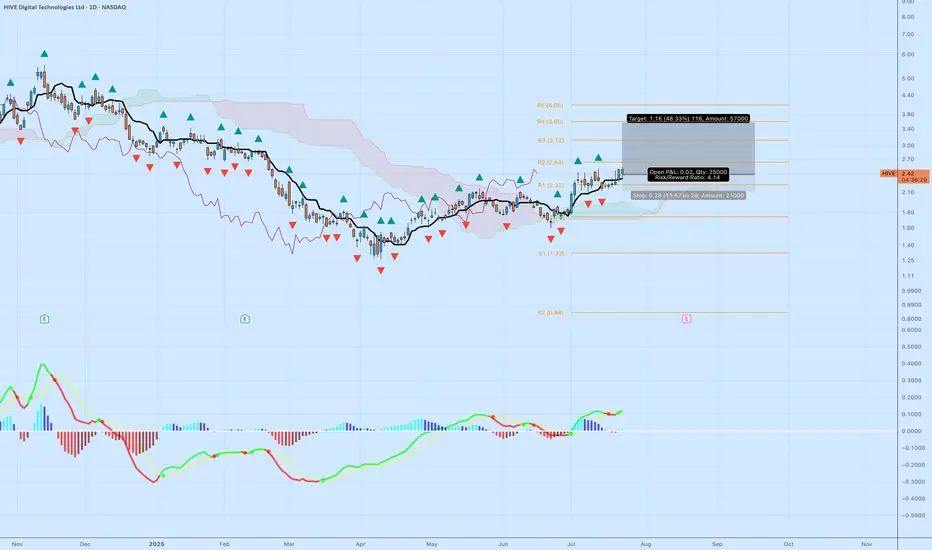
HIVE – Bullish Breakout Above Cloud with MACD and Fractal HIVE Digital Technologies ( NASDAQ:HIVE ) is showing a textbook trend reversal after months of basing. Price action has cleared the Ichimoku cloud with conviction, printing a bullish MACD signal and confirming structure with repeated fractal support.
Setup Breakdown:
Price above cloud and holding above R1 pivot (2.22)
Bullish MACD crossover with rising histogram and momentum curve
Multiple bullish fractals printed from the consolidation base
Entry off the breakout with clean support structure below
Target near R3 at 3.12 offers 48%+ upside with defined risk
Trade Details:
• Entry: $2.42
• Stop: $2.14
• Target: $3.58
• Risk/Reward: 4.14
• Quantity: 25,000 shares
This breakout lines up with broader crypto strength and interest in blockchain infrastructure. HIVE is well-positioned as a data center and digital asset play with rising institutional attention.
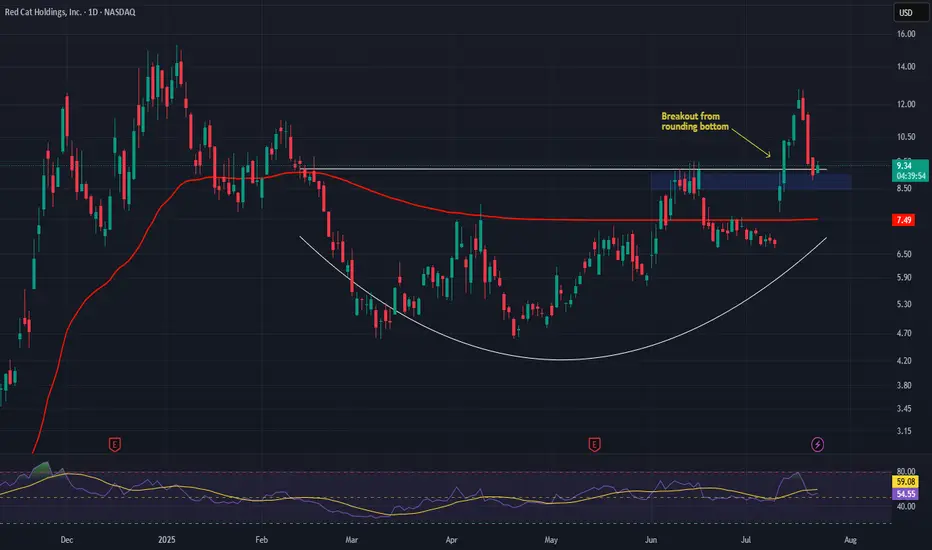
Red Cat Holdings (RCAT) – Soaring with Defense & Global DemandCompany Snapshot:
Red Cat NASDAQ:RCAT is an emerging UAV (drone) technology leader, rapidly scaling through defense-grade contracts, global expansion, and vertical integration.
Key Catalysts:
Defense Sector Traction 🎯
Recent U.S. DoD contract wins underscore RCAT’s credibility as a mission-critical UAV supplier.
Sequential revenue growth in earnings signals accelerating adoption in defense and commercial markets.
Global Expansion Strategy 🌐
RCAT is diversifying via allied procurement programs, reducing dependence on U.S. defense budgets and broadening international exposure.
Tech Stack Integration ⚙️
Strategic acquisitions are bolstering RCAT’s in-house capabilities—driving vertical integration, improving margins, and fueling innovation velocity.
Investment Outlook:
Bullish Entry Zone: Above $8.50–$9.00
Upside Target: $15.00–$16.00, supported by defense contract momentum, global reach, and a strengthened tech edge.
🛡️ RCAT is becoming a high-leverage play on modern defense tech with scalable, global upside.
#RCAT #DefenseStocks #UAV #DroneTechnology #MilitaryContracts #Innovation #DoD #Aerospace #Geopolitics #GrowthStocks #VerticalIntegration
Kirklands | KIRK | Long at $1.99Kirklands $NASDAQ:KIRK. A strong move may be brewing... The historical simple moving average (SMA) is flirting with the price and has yet to break the barrier - which often results in a sharp price increase. The downward trend is finally starting to reverse based on this measure, too. While it may not soar to crazy highs like in 2021, the chart setup is exactly what I like to see for an anticipated move up as it consolidates. A 12M float and 7% short interest could get the ball rolling if/when the price breaks into the historical SMA.
Fundamentally, NASDAQ:KIRK is a small-cap with $114 million in sales. It recently partnered with NYSE:BYON as an exclusive licensee of Bed Bath & Beyond neighborhood stores, positioning the company as a multi-brand retailer. The first Bed Bath & Beyond neighborhood store is planned for a 2025 opening. Could this be the force for a future price move? Time will tell.
At $1.99, NASDAQ:KIRK is in a personal buy zone.
Target #1 = $2.50
Target #2 = $2.75
Target #3 = $3.00
Target #4 = $4.00

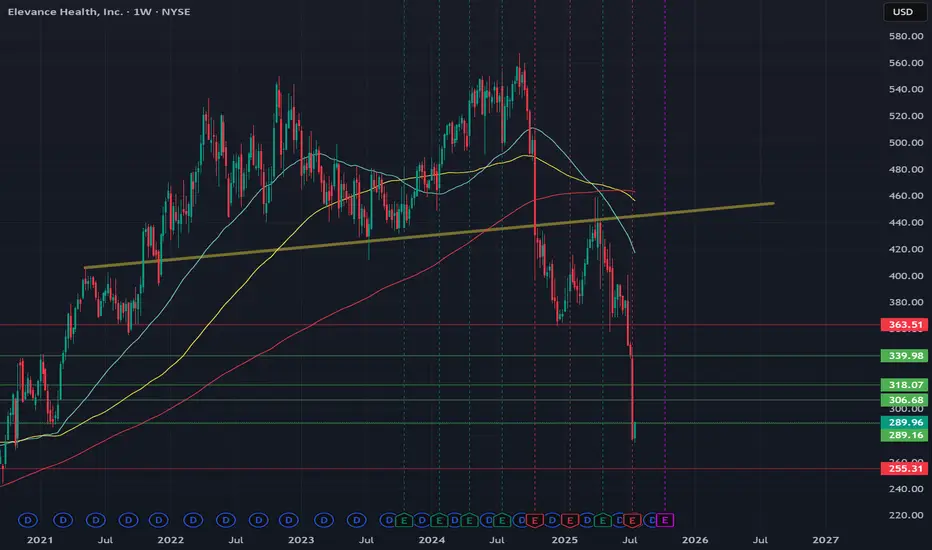
Berkshire is losing the Buffet's premiumTechnical Overview
Looking at the current NYSE:BRK.A chart, several signals suggest a potential shift from the prior bullish trend:
Channel Break : Price has broken down from a long-standing ascending channel, which often marks the end of an uptrend and the start of a consolidation or a bearish phase.
Possible Pullback: After the channel break, the chart highlights a likely pullback toward the broken support, now turned resistance. If BRK.A fails to retake this area, downside follow-through becomes probable.
Targets Identified:
Target 1: Around 655,000 USD, supported by a significant volume cluster.
Target 2: Near 615,000 USD, another high-volume historical support.
Target 3: Around 545,000 USD, marking a deeper retracement in case of extended weakness.
Invalidation: If price strongly reclaims the prior channel and breaks above the highlighted red resistance, the bearish idea should be reconsidered.
Fundamental Arguments
Berkshire’s largest holdings, particularly in tech, are sensitive to market corrections, especially in a rising rate environment, which can weigh on valuation multiples.
Growth in net earnings has moderated, with key segments (insurance, railroad, and energy) facing headwinds or margin pressures.
Diminishing Buyback Impact: With shares previously at all-time highs, Berkshire’s ability to use buybacks as strong downside support is reduced if valuation stays elevated or fundamentals drift.
Trade Setup
Entry Idea: Look for opportunities to go short or trade sideways after a failed retest of the broken channel, as seen on the chart.
Profit Targets: Use the volume-based support zones at 655,000, 615,000, and 545,000 USD.
Stop Loss: A convincing break back into the channel and above local resistance invalidates the setup.
This gives us opportunities to risk around 3 to 4% and earn more than 9%. A great Risk Reward ratio.
Laste note about channels
Trading after a channel break can offer strong open risk/reward setups, especially if fundamental forces align with the technical picture. While Berkshire Hathaway remains a resilient company, markets can enter periods of consolidation or pullback even for top-tier stocks. Always mix technical observation with a view on macro and company fundamentals for improved decision-making.
💬 Does this setup align with your view on BRK?
🚀 Hit the rocket if this helped you spot the opportunity and follow for more clean, educational trade ideas!

CLF heads up at $7.51: Golden Genesis fib may give a Dip buyCLF shot up strong after Trump increased tariffs on Steel.
It has just hit a Golden Genesis fib that may give us a dip.
Looking for a dip to $7.06 fib or a Break-n-Retest of 7.51

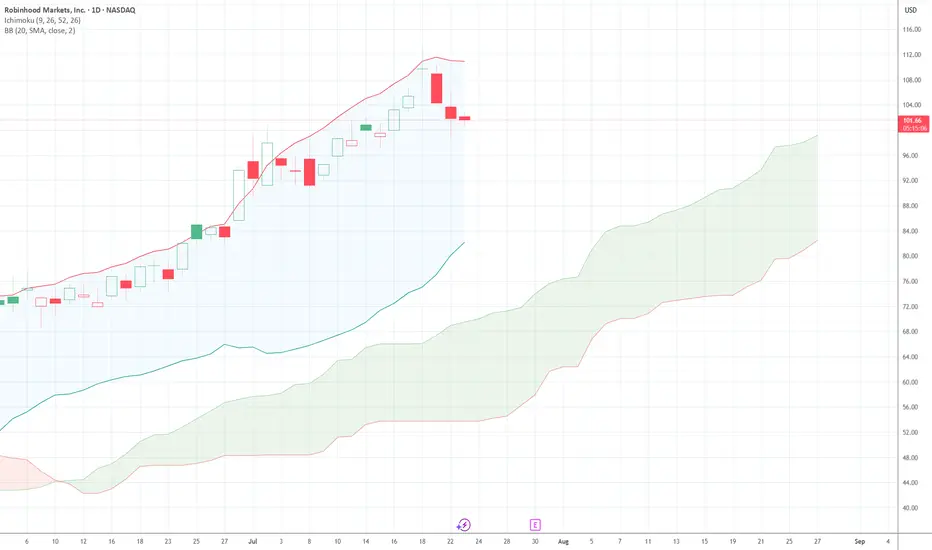
HOOD TIME FOR BOUNCE?HOOD on a 4 day pullback. Some big call flow just came in 105C 8/1/25 @ 4.40 $3.5 million in 4 orders.