RESPONSIVE INDUSTRIESResponsive Industries Ltd. is a specialized manufacturer of vinyl flooring, synthetic leather, and luxury vinyl tiles (LVT) used in infrastructure, automotive, and lifestyle segments. It has a growing international footprint, with exports contributing significantly to its revenue mix. The stock is currently trading at INR 237.00, showing a sharp uptick on the back of strong volume and renewed investor interest.
Key Levels
Support Levels: INR 137.05, INR 164.90, INR 199.30 Swing Level: INR 237.00 Possible Upside: INR 318.95, INR 363.30, INR 419.80
Technical Indicators
RSI (Relative Strength Index): At 51.18, the RSI signals a neutral to mildly bullish setup. While not yet overextended, it hints at improving strength following recent accumulation.
Volume: At 4.66M, volume has expanded alongside price, indicating strong institutional interest and increased market participation.
Sector and Market Outlook
Responsive Industries operates in the infrastructure-linked materials and engineered surface solutions space, benefiting from:
Rising demand for affordable and decorative flooring in commercial real estate and transit hubs
Government-backed infra investment in healthcare and education facilities
Global shift toward eco-friendly, customizable vinyl solutions
Risks include exposure to PVC price volatility, logistics and export cycle sensitivity, and fluctuating margins due to competition and input costs.
Latest Developments
Export Growth: Significant volume growth reported in key geographies including Europe and Middle East
Product Innovation: Launch of high-durability and antimicrobial vinyl flooring for institutional use
Financial Performance: Operating margins improved on the back of scale efficiencies and better realization per unit
Dividend Update
Responsive Industries declared a dividend of ₹1.50 per share, reflecting improved profitability and a consistent payout policy.
Analysis Summary
Responsive Industries is gaining upward traction after a prolonged base formation. With volume expanding and indicators turning constructive, the stock appears to be transitioning into a positive trend. Supported by sector tailwinds and operational leverage, it presents a compelling case for further attention among mid-cap industrial growth names.

AAPLThe AAPL stock is currently one of the strong stocks and is in a buying zone, as shown in the chart. The target is the strong red zone, which represents a supply area. The stop-loss level is also indicated on the chart.

BellRing Brands (BRBR) - Gartley Pattern + Kijun ConfluenceBellRing Brands (BRBR) Stock Analysis ( video version ):
In March 2025, I previously took a look at this budding public company BellRing Brands, Inc. for a long-term investment horizon. It was priced around 74 at the time, then the fall of the overall market status put additional pressure on its stock, although the company itself is booming and meets my fundamental parameters.
Since then, we had an awesome and confident forward guidance from the company in the last earnings call in May 2025: bellring.com/news/bellring-brands-reports-results-second-quarter-2025-affirms.
Now, looking at BellRing Brands (BRBR) once again, on a weekly chart, key technical patterns have formed that look very promising and solid with its many confluences.
TECHNICALS:
WEEKLY:
Many weekly confluences have appeared from a technical perspective. Here is what I see:
(1) There is a clear Bullish Gartley-ish pattern in a weekly retracement to 50% followed by a retracement to 78.6% of a preceding move.
(2) The price is around 78% fib support.
(3) Horizontal area of support: The 50 - 58 area is a whole prior area of horizontal support that was a prior resistance area back in July 2024, and the price has landed back on that area. You know what we say as technicians and investors: past resistance = future support.
(4) MACD Hidden Bullish Divergence (weekly)
(5) The price tested the weekly cloud and broke through; however, bullish extremes were triggered when that happen, which is rare based on all my personal studies. In fact, the current level 55-58 marks the end of a bearish double top cycle that began around March 2025.
(6) A weekly Doji with volume support (classified as a "dVa" in my old notes of Volume Price Analysis).
Here is the weekly chart:
MONTHY:
BRBR is poised to rally Q3 and Q4 2025.
We have a potential monthly bounce of the kijun forthcoming along with good fundamentals going forward supporting the growth of the company in the long term.
** potential monthly Kijun Trend Bounce **
Here is the monthly chart:
Target:
Currently, the price is 58.54. My tentative target is around 140 by March 2026.
Thus, with all the fundamental support, good forward-looking guidance, and the technical I believe that BellRing Brands (BRBR) is at a great price right now. It is prime to continue its stretch of growth for 2025. Looking forward with investor foresight, the case for BellRing Brands and its stock (BRBR) is not only a high-probability outlook of positivity, but a high odds outcome of technical price pattern success. What a great discount.... :)

AVAV Breakdown Setup!🔻
Price coiling tight — bears watching the wedge crack 📉
Entry: $285.00 | SL: $289.69 | TP: $272.35
Rejection brewing at the top…
#AVAV #ShortTrade #BearishSetup #MarketWatch #ProfittoPath

SOFI Breakout Watch!🚀
Pullback into triangle support — bulls eyeing $19.61 next 📍
Entry: $18.20 | SL: $17.80 | TP: $19.61
Pattern says “retest and rip!”
#SOFI #BreakoutSetup #StockAlert #BullishMove #ProfittoPath

UBER Breakout Alert!
Breaking above resistance with rising support — eyes on $95.75 🎯
Entry: $93.28 | SL: $92.70 | TP: $95.75
📈 Bullish momentum in play.
#UBER #BreakoutTrade #StockTrading #BullishSetup #ProfittoPath

GOOGL is facing resistance 181.11NASDAQ:GOOGL
Google is in uptrend . Currently it is facing the resistance 181.11.
It has slightly pull backed from the resistance.
Pattern : Ascending channel - a bullish chart pattern. To valid this pattern the price has to consistently make higher highs and higher lows. But the price is now facing the resistance 181.11 To make higher high it has to break it.
If it fails to break the resistance , sideways trend may be seen here for short period of time and bullish momentum may become weak.
Note :
If you’re interested in receiving detailed technical analysis reports on your selected stocks, feel free to reach out to me. I can provide you with customized reports covering trends, key levels, momentum, patterns, and price projections to support your trading or investment decisions.

First leg of corrective wave A completes NYSE:BMY has completed the first set of wave A after completing 5-wave internally. Currently, price action suggest that we may be staging a larger set of wave B as there is strong v-shaped bottom supported at 61.8% retracement level from 37.00-62.80. Furthermore, the larger structure is showing a strong higher low in formation.
Hence, we are looking at 50.62 as our 1st TP and 59.60 as our mid to long-term target.

MCK VCPNYSE:MCK testing 10-week VCP flat base at ATHs.
• Entry: 736.40 stop-limit on ⧁150 % vol
• Risk / Stop: 711 (1 % acct risk)
• Target: 805–820 (3.5 R, 2-4 wk swing)
Thesis: Health-services sector strength + low-beta alpha.
#MCK #trading

HELE | Historic Support Reclaim – Falling Wedge Breakout +113% 📍 Ticker: NASDAQ:HELE (Helen of Troy Ltd.)
📆 Timeframe: 1W (Weekly)
📉 Price: $28.10
📈 Pattern: Falling wedge + long-term horizontal support
🔍 Technical Setup:
NASDAQ:HELE is rebounding from a major horizontal support zone that's been in place since 1998, and just broke above a multi-year falling wedge. This marks the start of what could be a powerful bullish reversal.
🔻 Breakdown structure from 2022 now being tested from below
🟡 Long-term horizontal support: ~$26.00–27.00
📈 Breakout potential with plenty of headroom into prior supply zones
🧠 Trade Plan & Return on Invested Capital (ROIC):
📥 Entry Zone: $27.50–$28.50
⛔ Stop-Loss: Weekly close below $25.00 (structure invalidation)
🎯 Target 1: $47.99
→ 🔼 ROIC: +70.8%
🎯 Target 2: $60.06
→ 🔼 ROIC: +113.8%
⚠️ Key Observations:
Large-volume bottoming zone, breakout confirmed above falling trendline
Price targets align with key prior support → resistance flip zones
Multi-year trend reversal possible if price sustains above $31–32
Strong candidate for mid/long-term swing trades or LEAP call positioning
💬 Will Helen of Troy return to its former strength with a clean wedge breakout?
Add HELE to your watchlist for 2025–2026 recovery potential.
#HELE #FallingWedge #BreakoutTrade #LongTermSetup #ReversalPattern #TargetTraders

Quick View: $WDAY- On the Hourly chart, attempt of bullish crossover at the same level of the breakout of the Box.
- The daily is still bearish with negative price action.

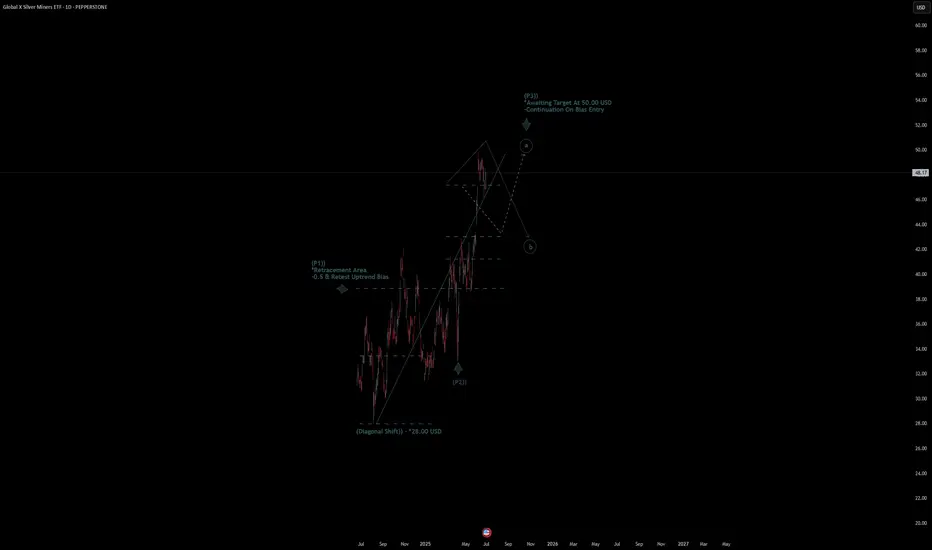
Global X SIlver ETF Quote | Chart & Forecast SummaryKey Indicators On Trade Set Up In General
1. Push Set Up
2. Range Set Up
3. Break & Retest Set Up
Notes On Session
# Global X SIlver ETF Quote
- Double Formation
* (Diagonal Shift)) - *28.00 USD | Completed Survey
* Awaiting Target At 50.00 USD
- Continuation On Bias Entry | Subdivision 1
- Triple Formation
* (P1)) / (P2)) & (P3)) | Subdivision 2
* (TP1) = a / Long Consecutive Range
* (TP2) = b / Short Consecutive Pullback | Subdivision 3
* Daily Time Frame | Trend Settings Condition
- (Hypothesis On Entry Bias)) | Regular Settings
- Position On A 1.5RR
* Stop Loss At 45.00 USD
* Entry At 48.00 USD
* Take Profit At 53.00 USD
* (Uptrend Argument)) & No Pattern Confirmation
* Ongoing Entry & (Neutral Area))
Active Sessions On Relevant Range & Elemented Probabilities;
European-Session(Upwards) - East Coast-Session(Downwards) - Asian-Session(Ranging)
Conclusion | Trade Plan Execution & Risk Management On Demand;
Overall Consensus | Buy
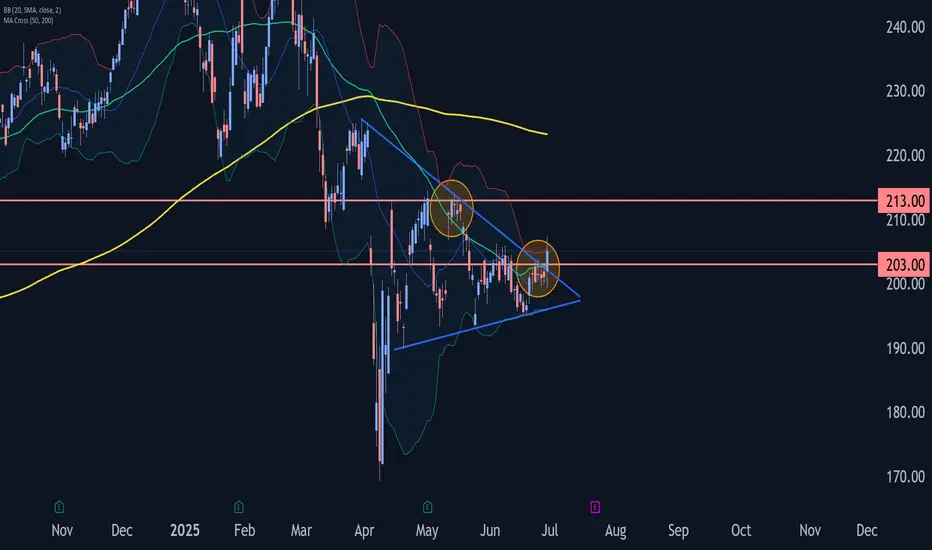
Apple Wave Analysis – 30 June 2025
- Apple broke resistance zone
- Likely to rise to resistance level 213.40
Apple recently broke the resistance zone between the resistance level 203.00 (which has been reversing the price from the start of June) and the resistance trendline of the daily Triangle from March.
The breakout of this resistance zone should add to the bullish pressure on Apple.
Apple can be expected to rise to the next resistance level 213.40, which reversed the previous waves (A), (C) and (2), as can be seen below.
$BSX VCP-style ascending triangleBoston Scientific (BSX)
Pattern
VCP-style ascending triangle. Three higher lows have squeezed price against the 108 ceiling while volume dries up each contraction.
Trigger & Risk Plan
• Buy-stop: 108.15 on ≥150 % average volume
• Stop: 102.00 (handle low / rising trend-line)
• Starter size only; add 25 % more if price closes above 110.50 the same day.
Reward Map
Measured triangle target 118 — followed by the cup-handle projection near 124-129 if momentum really kicks.
Why I Like It
• Relative strength already outperforming XLV and SPX.
• Medical-device peers SYK and MDT quietly firming — sector tailwind.
• “Overbought” RSI is a feature, not a bug, right before real breakouts.

Super Micro Computer (SMCI)Pattern: Year-long down-trend line ripped; early Stage-2 attempt.
Preferred entry: 44.6-45.2 pull-back bid (stop ≈41).
Alt entry: Power close ≥50.10 with volume surge.
Target: 65 supply shelf.
(Why I like it? Sentiment flip + AI-server narrative fuel.)
NASDAQ:SMCI

BYD–Smart Money Push Back Zone | Impulsive Bullish Move Coming?HKEX:1211 Description / Idea:
So, BYD will reach the purple "Push Back" zone this week or at the latest next week, where many long traders and probably also the smart money will come back into the market.
📌 Entry: between 110 and 115 HKD
📌 Stop Loss: below April low (~101 HKD)
📌 Take Profit: I will share the exact TP later as it depends on timing and the upper trendline, where the higher highs usually get rejected.
🔍 The upward move is forming like the last one in an ABC pattern and will most likely run between the 78.6% and 50% Fibonacci levels. I plan to hold it continuously as long as the structure remains bullish.
⚠️ If the stock falls below the April low, I would rather sell at around 102 HKD.
💡 Since BYD fell below the 78.6% Fibonacci level last night and the split shares were released today, the sell-off could already begin today if the level is retested beforehand.
#BYD #HongKongStocks #SmartMoney #PushBackZone #SwingTrading #Fibonacci #ABCPattern #TradingAnalysis #TechnicalAnalysis #BullishSetup

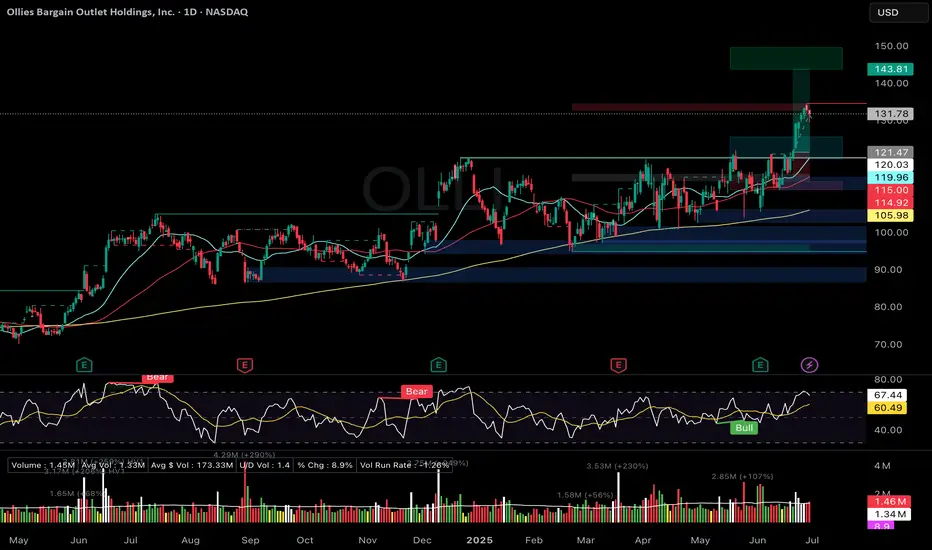
Case Study: Banking a +7 % Pop on OLLI’s VCP/ Ascending TriangleMomentum in discount retail has been stealth-strong all quarter, so when Ollie’s Bargain Outlet (OLLI) flashed a textbook volatility-contraction break I pulled the trigger. Below is the full play-by-play, numbers included, plus the process tweaks I’m carrying into the next trade.
1. The Setup
• Pattern: VCP-style ascending triangle under 121 resistance
• Context: Post-earnings drift sideways, volume drying up each contraction
• Catalysts: Strength across discounters (DG, WMT, DLTR) and bullish seasonality
• Risk: 1 % of account, stop pre-defined at 115
2. Execution
• 20 Jun – Stop-limit filled at 121.01 once intraday volume hit 2.6× ADV
• 24 Jun – Trimmed 3 sh at 129.13 (+6.7 %) to “feed the monster” and recycle BP
• 30 Jun – Trailing stop (ratcheted daily) closed remaining 7 sh at 129.94
3. Results
• Gross P&L: +86.89 USD, +7.18 % on position
• R-multiple: +1.45 R on initial risk
• Expectancy (TraderSync): +3.83 % — proof the process carries a positive edge
4. What Went Right
• Bought only after volume confirmed the breakout
• Stop never widened—only tightened
• Early partial locked in reward and removed emotional pressure
5. Improvement Plan
• Keep a 10 % “runner” until first close below 10-EMA or heavy distribution day
• Back-test a +25 % add on day-two follow-through (+2 % price, >1.5× volume)
• Simplify order flow by defaulting to single OCO brackets
NASDAQ:OLLI
AAPL Weekly ChartOn the weekly chart, AAPL seems to find support on a previous resistance level after testing it several times. Macd has signaled a green as well. Seems optimistic.
Sklz 7.55-8.09 new floor ?!Big volume, i think july 18 calls are micely valued for 7$
Based on chart purely, i think the set up is there for the move north.
Big volume spike on 4hr looking like a nice green week. SKLZ ANS PARADISE TO THE MOON. 10$ by december
Not financial advice but i think its a nice price.

EVEX Has A Double Bottom On Weekly! Hey fellow traders and followers! 2025 should play out to be a good year to make bank in the markets $$$
Let's check out the double bottom in EVEX on the weekly chart.
If one wants to play it on the conservative side you could wait until price breaks the break line of around 5.99 before buying in or just buy in now, your choice based on risk tolerance.
After a break above 5.99 target-1 would be 7.51 area. TP-2 8.73 area and TP-3 10.70.
This stock can go higher than my last target but lets start there anyway.
Best of luck in all your trades and lets make a SEED_ALEXDRAYM_NAAIM:HT load of money together this year.
Cheers! :)

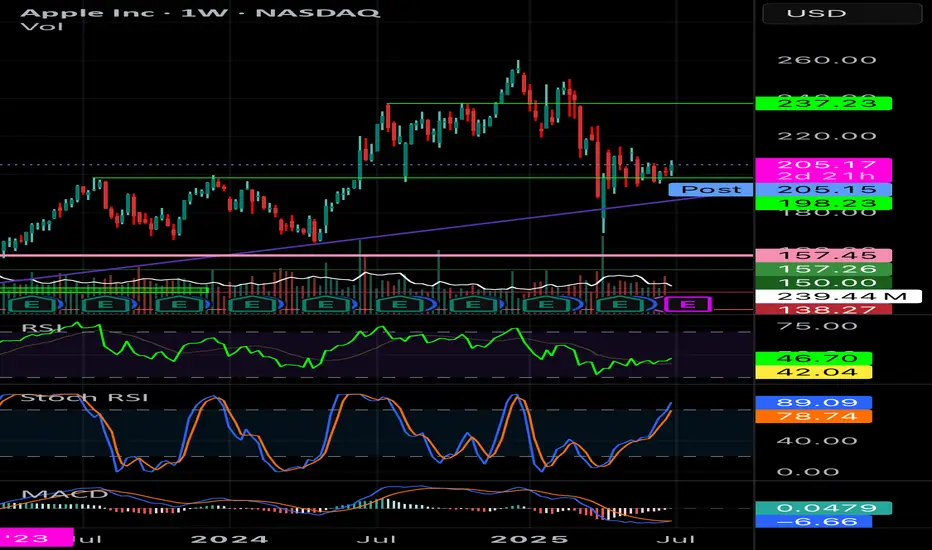
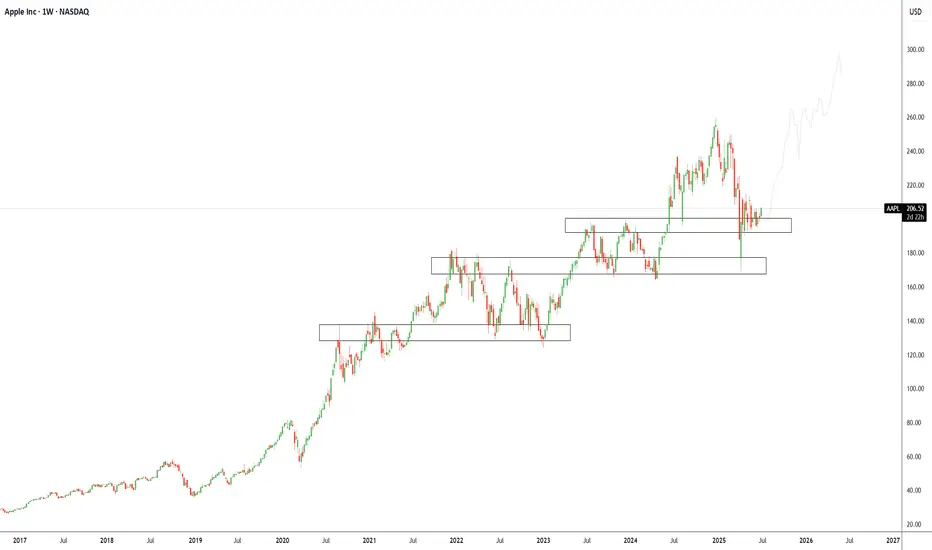
Apple Inc (APPL): Trend Continuation to $300+Overview Summary
We’ve added new long positions on Apple ( NASDAQ:AAPL ) recently after a textbook rejection from a well-established support/demand zone between $185–$200. This area has consistently acted as a launchpad for previous rallies and is now once again serving as a structural support on the weekly timeframe.
Apple’s ability to consistently innovate through product cycles, expand its services ecosystem, and integrate AI-driven features into its devices provides strong conviction for long-term upside. With Vision Pro, Apple Intelligence, and chip-level innovations underway, the company is positioning itself to benefit from both hardware and software expansion over the next decade.
Technically, the price has formed a multi-year stair-step structure with clear levels of accumulation. We believe NASDAQ:AAPL is beginning its next leg higher after consolidating above this zone. A clean move to retest all-time highs is likely, and a long-term target of $300 aligns with both trend structure and growth potential.
Green Zone Capital remains bullish on NASDAQ:AAPL with a long-term horizon and will continue to scale into strategic pullbacks within the broader uptrend, our current setup is:
Bias: Long
Type: Long-Term Accumulation
Entry Zone: $190–$205
Target: $300+
Invalidation: $165
Technical Analysis:
Apple is currently sitting at a critical demand zone that has historically acted as a base for previous multi-month rallies. Our TradingView chart highlights several key structural zones showing Apple’s tendency to build stair-step accumulation ranges followed by breakouts. The current zone between $185–$205 has been tested and held multiple times, confirming its significance.
We are seeing bullish rejection candles forming on the weekly timeframe, showing buyer interest is returning. This confluence of technical support and long-term structural demand confirms our long entry thesis.
Macro/Fundamental Thesis:
Apple remains one of the strongest tech companies globally with unmatched brand equity, pricing power, and integration across hardware, software, and services. The company continues to expand aggressively into AI with Apple Intelligence, spatial computing with Vision Pro, and strategic chip development.
With record cash reserves, a loyal consumer base, and continued innovation cycles across iPhone, Mac, and Services, Apple remains a strong defensive and offensive tech allocation in any long-term portfolio. Despite current macro volatility, Apple has consistently outperformed over market cycles.
Lululemon Chart Breakdown Lululemon (LULU) Chart Breakdown
Buy around $200-$250 Dollar Levels
Sell/TP: Above $275-$300

6/30/25 - $bbai - FAFO w/ PE overlords6/30/25 :: VROCKSTAR :: NYSE:BBAI
FAFO w/ PE overlords
- let me share a lil advice
- whenever private equity is your overlord and main shareholder: run
- you can always make up stories as to why you own this. trust me, there are better options out there
- good luck
- and hope you don't have to FAFO
sidelines for me as i have my hands full with the donut NASDAQ:QUBT , again
V
