Patent PricingA small stock with a market value of about $6 million has managed to get its patent rights for more than double that price.
Tp1,Tp2

DANGSUGAR LONG IDEARecently, the price of DANGSUGAR stock has broken out of a bearish trendline with a strong bullish weekly candle. This shows a strong intention to continue the buying momentum. To take advantage of the long opportunity, you can buy at the current market price while you can also wait for price to drop to N42.95. The stop can be at N37.70 while the target are N47.85 and N63.50 (final target). If this zone should fail, then the next long opportunity will be at N33.50 with a stop at N30.35 based on market structure.
Confluences for the long idea:
1. Trendline and resistance breakout with a strong bullish weekly candle.
2. Strong volume momentum on the volume indicator.
3. Market structure is bullish.
Disclaimer: This is not a financial advice. The outcome maybe different from the projection. Don't take the signal if you're not willing to accept the risk.

Triple top pattern failedTemporary postponement of repeat of the 1997 Eastern financial crisis by breaking the previous ceiling
Triple top pattern failed

FIDELITYBK: HOLD OR SELL?FIDELITYBK is running up towards its target after mitigating a valid demand zone within the discount level at a price of N17.25. If you have this stock in your portfolio, it's a good idea to hold the stock as it has a potential to go as high as N24.95. Although, the weekly swing high is the actual target, which is at a price of N21.55. Afterwhich, a drop in price is anticipated in order to create another long opportunity. Nevertheless, with the market structure being bullish, it's a good idea to ride on the higher prices that can be created in a bullish market.

FCMB LONG IDEAFCMB stock is in an uptrend with price creating new highs. Recently, price mitigated a demand zone within the discount level at a price of N8.55 which is anticipated to go up as high as N12.90, the last swing high. To follow up with the bullish run, there is a potential long opportunity at the current market price or the nearest support level around N9.10 where price is also anticipated to continue going up to the target. The stop can be below the recent low around N8.30.
Confluences for the long idea:
1. The market is bullish.
2. Price is coming from a valid demand zone within the discount level.
3. Price is respecting bullish trend line.
4. The confluence of trendline, support level and 50% Fibonacci level is a potential point for price to go higher.
Disclaimer : This is not a financial advice. The outcome maybe different from the projection. Don't take the signal if you're not willing to accept the risk.

FIRSTHOLDCO LONG IDEAFollowing the market structure on FIRSTHOLDCO stock, price has broken a structure showing an intention to go higher. Price has retraced into the discount level, this is the time to take advantage of the long opportunity.
One can take a long position at the current market price. However, potential areas to take a long position are the key levels around N25.95, N25.65 and N25. These areas are support and demand zones on daily timeframe that can push price higher. The target is the swing high around N30 while the next target is N34 where 1.618 Fibonacci level is. The stop can be the swing low around N23.50 or N24 just below a demand zone.
Confluences for the long idea:
1. Market is bullish.
2. Price is in discount level.
3. Price is coming to a support level and demand zone.
Disclaimer: this is not a financial advice. The outcome maybe different from the projection. Don't take the signal if you are not willing to accept the risk.

Ye Chart Kuch Kehta Hai - Prime Focus LimitedPrime Focus Ltd’s stock shows strong technical momentum on the monthly chart, supported by high volume, price above key moving averages, and positive price forecasts. Fundamentally, the company’s leadership in media post-production, expanding digital solutions, and improving operating margins underpin its growth potential despite some profitability challenges. These factors combined suggest a favorable outlook for the stock’s growth in the near to medium term.
Technical Rationale (Monthly Chart)
Strong Uptrend Momentum: The stock price recently surged nearly 20% in a single day, closing at ₹136.83, well above its 50-day average (~₹108.7) and 200-day average (~₹118.1), indicating strong bullish momentum on the monthly scale.
Volume Surge: The volume of over 20 million shares traded is significantly higher than the average volume (~694,580), suggesting strong buying interest and potential continuation of the upward trend.
Price Recovery from Lows: The stock has rebounded from a low of ₹85 to current levels near ₹137, showing a recovery phase that often precedes further gains on monthly charts.
Positive Price Targets: Forecasts indicate a bullish trend with mid-year 2025 targets around ₹137.61 and year-end targets near ₹160, supporting the technical outlook for continued growth.
Fundamental Rationale
Market Position and Business Model: Prime Focus Limited is a global player in media and entertainment post-production services, including visual effects, 3D conversion, and cloud-based media solutions, serving major Hollywood studios, OTT platforms, and broadcasters. This diversified service portfolio positions it well in a growing digital content market.
Revenue and Operating Profit: Despite some volatility, the company reported strong operating profit margins recently (22% in FY2025) and operating profit of ₹786 crore, indicating operational efficiency improvements.
Growth Prospects: The company’s digital transformation offerings (CLEAR cloud media ERP suite) and global footprint across 18 cities enhance its growth potential in the expanding entertainment technology sector.
Valuation and Intrinsic Value: The stock currently trades at a premium of about 63% over its median intrinsic value estimates, reflecting positive market sentiment and growth expectations.
Return Ratios and Challenges: While ROE remains negative (-15.8%) and sales growth has been modest (4.21% over 5 years), the improving operating margins and strategic investments in technology could drive future profitability and shareholder returns.
Promoter Holding and Market Cap: Promoter holding slightly decreased recently but remains significant, and the market cap stands around ₹4,240 crore, indicating a mid-cap stock with room for institutional interest and growth.

Ye Chart Kuch Kehta Hai - IDFC First BankThe weekly technical chart for IDFC First Bank (NSE:IDFCFIRSTB) indicates a positive outlook for the stock due to several key factors:
Strong Buy Signals from Moving Averages: All major moving averages (5, 10, 20, 50, 100, and 200 periods) are signaling a "Buy" on the weekly chart, reflecting strong upward momentum and trend strength.
Positive RSI and MACD Indicators: The Relative Strength Index (RSI) stands at around 57.4 on the weekly scale, which is in a healthy bullish zone below overbought levels, suggesting room for further upside. The MACD is also positive, reinforcing bullish momentum.
Support from Ultimate Oscillator and Other Indicators: The Ultimate Oscillator reading is above 50, indicating buying pressure. Although some oscillators like CCI and ADX show mixed signals, the overall technical consensus leans bullish.
Price Above Key Pivot Points and Supports: The current price is trading above key pivot levels and support zones, which typically act as strong floors for price action and reduce downside risk.
Recent Price and Volume Trends: The stock price has risen about 4.58% over the past week and 6.12% over the last month, indicating sustained buying interest. Mutual fund holdings have also increased recently, which often supports price appreciation.
Analyst Sentiment and Growth Indicators: Over 50% of analysts recommend a "Buy" rating with an average target price near current levels, reflecting confidence in the stock’s growth potential. The company has shown consistent revenue growth and outperformance relative to peers in recent quarters.
In summary, the weekly technical chart for IDFC First Bank shows a confluence of bullish signals from moving averages, momentum indicators, and price action, supported by positive market sentiment and fundamental growth trends. This technical setup suggests a likely upward movement in the stock price in the near term on a weekly basis

BANCOINDIA - Earnings Gap up (EP)
- Strong prior buying force
- Narrow range consolidation near ATH
- Volume dry up
- Small SL , High R:R

IRENs Incredible Surge Continue next wWeek?NASDAQ:IREN has been on a rampage since the April surging 175% and nearing all time high! A great couple of trades for us so far!
Price is likely to hit all time high next week with such a strong trend, where resistance and a pullback is a high probability.
The weekly pivot is $9.77, the most likely area for price to find support just above the 0.382 Fibonacci retracement (which will be dragged up to the weekly pivot once a new high is made).
Price discovery terminal target are the R3 & R5 weekly pivot points at $28 and $40.
Safe trading

Ye chart Kuch Kehta Hai - Jio Financial Jio Financial Services stock shows strong potential for growth on the weekly technical chart based on multiple technical indicators and moving averages signaling bullish momentum:
Strong Buy Signals Across Moving Averages: All key moving averages (5, 10, 20, 50, 100, and 200-day SMAs and EMAs) are indicating a "Buy" or "Strong Buy" signal, reflecting sustained upward price momentum over various time frames.
Bullish Technical Indicators: Indicators such as MACD, ADX, CCI, ROC, and Ultimate Oscillator are all showing buy signals, supporting a positive trend continuation. For example, MACD is positive and rising, ADX at 46.6 indicates a strong trend, and CCI at 177.7 confirms bullish momentum.
Overbought but Strong Momentum: Although the RSI (14) is overbought at 81.3, which typically signals caution, in strong trending markets this can indicate continued strength rather than an immediate reversal.
Price Action and Pivot Levels: The stock price is currently above key pivot points and resistance levels, with classic pivot resistance around 329-335 levels, suggesting room for further upward movement before significant resistance is encountered.
Recent Price Performance: Jio Financial has gained nearly 10% in the past week and over 11% in the last month, demonstrating strong recent buying interest and momentum.
Volatility and Volume Support: The ATR (Average True Range) indicates high volatility, which can fuel strong price moves, and the Bull/Bear Power indicator confirms buyers' dominance.
In summary, the weekly technical chart for Jio Financial Services reflects a robust bullish setup with multiple moving averages and momentum indicators aligned on the buy side, supported by recent strong price gains and favorable pivot levels. This technical landscape suggests a high probability of continued price appreciation in the near term on the weekly timeframe

Potential outside week and bullish potential for CXOEntry conditions:
(i) higher share price for ASX:CXO above the level of the potential outside week noted on 27th June (i.e.: above the level of $0.1025).
Stop loss for the trade would be:
(i) below the low of the outside week on 20th June (i.e.: below $0.083), should the trade activate.

$HUT Macro Chart Preparing for Breakout?NASDAQ:HUT looks poised for a strong breakout with a wave 3 long term target of $58 and a short term resistances of $21 and $33
HUT is moving strong almost up 100% from the recent swing low, overcoming its weekly 200EMA with ease. A test of the 200EMA as support is likely before continuation.
Price is consolidating under major resistance High Volume Node (HVN) and the weekly pivot point. Consolidation under resistance often leads to a breakout.
A series of 1-2s appears to be taking place on the Elliot Wave count finding support at the 'BTC-Miners golden pocket' of 78.6 Fibonacci retracement.
Analysis is invalidated below $10.10
Safe trading

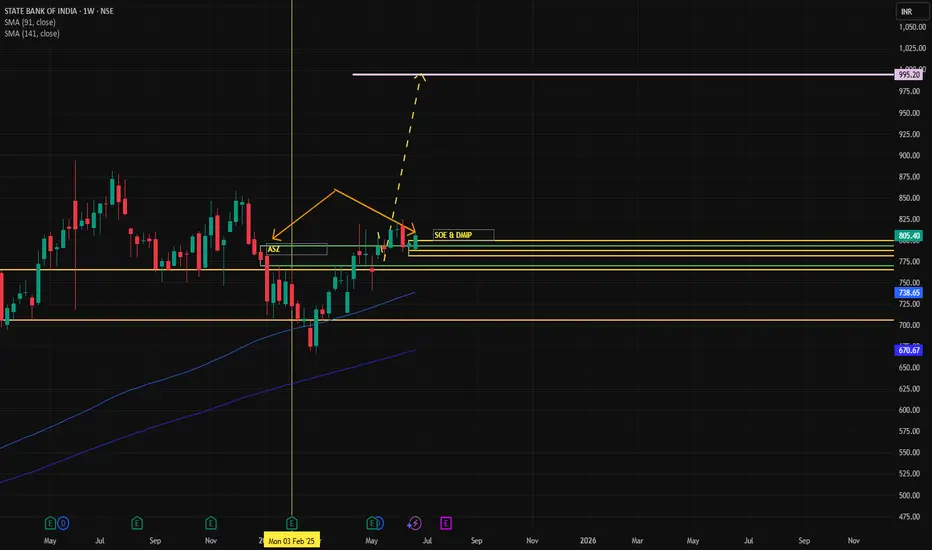
SBIN📝 Trade Plan
Position: Long (Buy)
Entry: 800
Stop Loss: 757
Risk: 43 points
Target: 1256
Reward: 456 points
Risk-Reward (RR): 10.6 – Excellent
✅ Multi-Timeframe Trend & Demand Zone Alignment
Zone Trend Demand Logic Avg Demand Zone
HTF UP RBR, BUFL 650
MTF UP RBR, DMIP, SOE, BUFL 762
ITF UP DMIP, BUFL 785
Trade Point Avg 732
This shows full timeframe alignment (HTF, MTF, ITF) in UP trend, strengthening the case for a long trade.
✅ Key Trade Logics – Highlights
Quarterly Demand (BUFL) is being respected.
Weekly ASZ previously formed at 793 – now engulfed with DMIP + SOE at 799 → Strong Demand.
Price trading above Gann Level of 766 → Bullish confirmation.
Entry at 800 is just above all critical demand structures (DMIP, BUFL, ASZ).
✅ Technical Observations
Last High = 894 → Short-term resistance.
Target = 1256 → Ambitious but possible if structure breakout confirms.
Last Low = 666 → Strong swing low. SL at 780 protects this level.
⚠️ Considerations / Watch Points
Immediate Resistance: ₹894 (last high); could act as short-term hurdle.
Gap Risk: Entry very close to Weekly demand zone (780–800) – be cautious of volatile retests.
Target Realism: ₹1256 may require a multi-week/month hold; consider scaling out partially at swing levels (e.g., ₹894, ₹975, ₹1050).
Reconfirm with Volume: Check for breakout with rising volumes above 800 and around 894 zone.
✅ Verdict
This is a strong, high-conviction trade setup with:
Perfect MTF Trend Alignment
Tightly defined risk
Excellent R:R ratio
Strong structural demand support
CLSK run starts now- BTC consistently stays 100k+, will break ATH in the coming months
- CLSK/BTC bottom formed
- CLSK/IREN bottom formed
- CLSK upper breakout from triangle
Bearish potential detected for AGLEntry conditions:
(i) breach of the lower confines of the Darvas box formation for ASX:AGL
- i.e.: below low of $9.84 of 7th April, and
(ii) swing increased bearishness of indicators such as DMI/RSI along with a test of prior level of support of $10.02 from 11th March.
Stop loss for the trade (based upon the Darvas box formation) would be:
(i) above the high of 10th April (i.e.: above $10.89), or
(ii) above the prior support level from the open of 10th January (i.e.: above $11.15), depending on risk tolerance.

HIND motors- My Pick - No AdviceReason for Picking - first support in 50 MA after goldencross alinging with previous resistance turning support. A very simple trade idea. simplicity works best. Bullish Hammer Candle followed byback to back inside bars. A break above Rs. 30 with good volume, is what I am looking for making the entry.

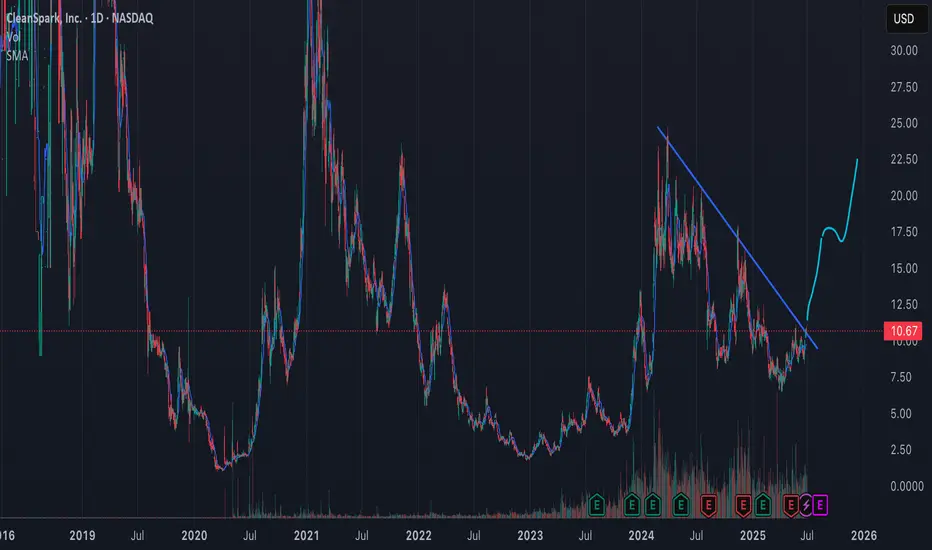
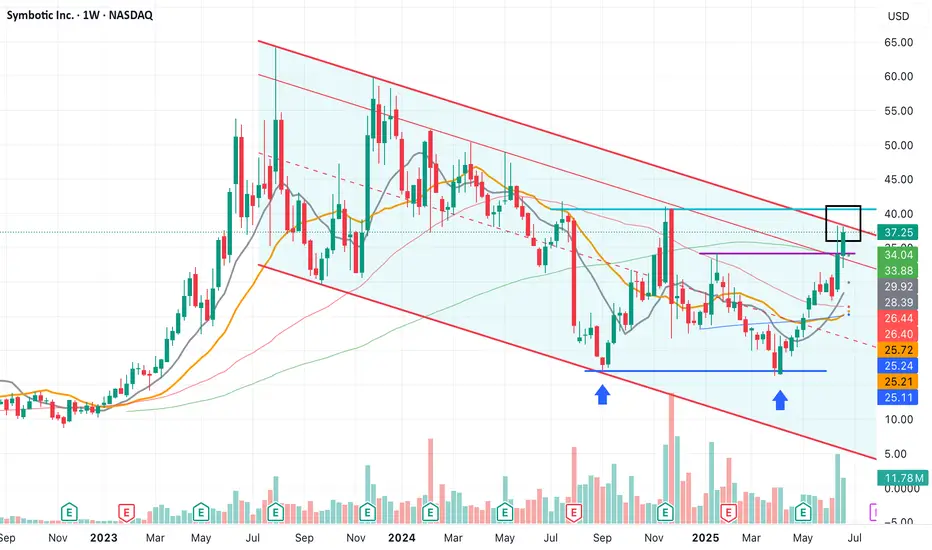
Ready for a comeback!This is a company that produces autonomous robots for warehouses, capable of handling goods storage using AI—the potential of this idea is insane!
At the moment, it's automating all of Walmart’s warehouses, which is its main client.
The price has been moving within a descending channel for two years and closed last week right near the upper boundary.
It might be time for a bullish breakout, with a return to previous highs or even beyond.
The first major resistance is around the $40 level.
BDL - MY PICK - No AdviceBDL - the defence sector stock, is in strong uptrend. it corrrected slightly to about 14% and has also grabbed liduidity and had taken support with 2 time the delivery volumes. Its now ready for new high with strong momentum

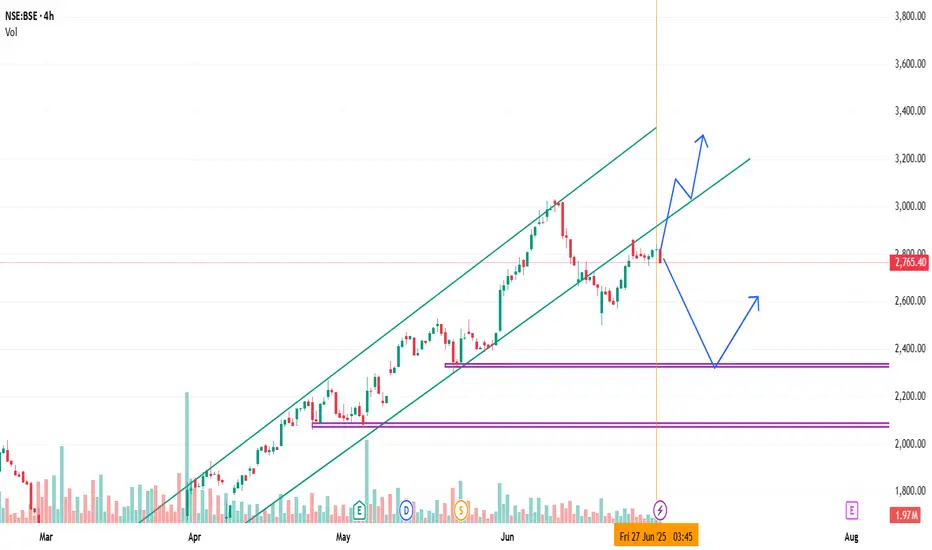
BSE breaking the channelAs the analysis is showing it has breaked the channel and retested support moving towards downward level 2326
Narayana Hrudayalaya - Strong Fundamental & TechnicalFundamental plus Technical Analysis on a Financially Strong Company:
Narayana Hrudalaya Ltd is engaged in providing economical healthcare services. It has a network of multispecialty and super specialty hospitals spread across multiple locations.
Focus
Company plans to add 700 plus beds for the next 3-4 years at Bangalore Health City. It intends to invest upto Rs. 1,000 Cr in the West Bengal for setting up a superspecialty hospital.
Capex Plan
Company has planned a total capex of 1136 Cr for FY24 and till Q3 FY24 it has spent 477 Cr.
Stock P/E - 31.7
Industry PE - 56.3
EPS growth 5Years - 67.8 %
Buy Score - 4.56 (Buy Score above 0 for me, is considered very good and above 1, excellent.)
ROCE 5Yr - 19.6 %
Please note that this idea is meant to spread awareness and should NOT be considered a buy recommendation. Do your own research before making any financial commitments.

Jio Financials Inverse Head & ShoulderThere is a developing pattern on the charts of Jio Financials.
The levels are marked clearly.
This is to spread awareness and pass my technical analysis learnings.
Conduct your own research before taking any financial decision.

Shemaroo Breakout Watch | Near 200-DMA ResistanceShemaroo Entertainment (NSE: SHEMAROO) is showing strong bullish momentum and has recovered sharply from ₹88 levels to ₹126.84. The stock is now testing the 200-Day Moving Average resistance.
📊 Technical Analysis:
• Trading near long-term 200-DMA (trend decider)
• RSI is strong but not overbought yet
• Volume increasing — suggests accumulation
🔹 Key Levels:
• Resistance: ₹128–₹132
• Breakout Above: ₹132
• Support Zone: ₹118–₹120
🎯 Targets post-breakout:
• Target 1: ₹145
• Target 2: ₹160
🚫 Stoploss: ₹117
⸻
⚠️ Disclaimer:
This is not investment advice. I am not a SEBI-registered advisor. This analysis is shared only for educational and informational purposes. Please consult your financial advisor before making any investment.
