HERE IS THE #CHART FOR $SMCI Bullish with consolidation risk. Advanced Micro Devices ( NASDAQ:AMD ) is at $143.81, up 0.09% daily and 25.14% monthly, as shown in the finance card above. X posts highlight strong momentum, with a breakout above the 200-day SMA ($129.74) and a potential Wave 5 targeting $154-$160, supported by analyst upgrades (Mizuho, Melius to Buy; targets $140-$175). AI chip demand (MI350 outperforming Nvidia’s B200, Oracle/Zettascale deals) and 40% YoY revenue growth drive optimism. However, a high P/E (105.42) and choppy price action suggest a possible pullback to $141.63-$142. Support is at $141.63; resistance is at $147.75-$150. A break above $147.75 could target $154; a drop below $141.63 risks $138

HERE IS THE #CHART $AMD Bullish with consolidation risk. Advanced Micro Devices ( NASDAQ:AMD ) is at $143.81, up 0.09% daily and 25.14% monthly, as shown in the finance card above. X posts highlight strong momentum, with a breakout above the 200-day SMA ($129.74) and a potential Wave 5 targeting $154-$160, supported by analyst upgrades (Mizuho, Melius to Buy; targets $140-$175). AI chip demand (MI350 outperforming Nvidia’s B200, Oracle/Zettascale deals) and 40% YoY revenue growth drive optimism. However, a high P/E (105.42) and choppy price action suggest a possible pullback to $141.63-$142. Support is at $141.63; resistance is at $147.75-$150. A break above $147.75 could target $154; a drop below $141.63 risks $138

HERE IS THE #CHART $QBTSCautiously bullish with pullback potential. D-Wave Quantum ( NYSE:QBTS ) is at $14.02, down 0.28% daily and 14.18% monthly, as shown in the finance card above. X posts reflect mixed sentiment, noting a low-volume pullback to the 50-day EMA ($13.44-$13.50) forming a bullish falling wedge, with potential for a breakout to $16-$18 if it holds above $13.50. Analysts are bullish (Strong Buy, $16.80 average target, 19.8% upside), driven by 183% revenue growth in 2025, the Advantage2 system launch, and a South Korea partnership. However, a Seeking Alpha report flags risks: high valuation (130x forward sales), negative cash flow, dilution from a $400M equity offering, and competition from gate-based quantum firms like IBM and IonQ. Support is at $13.44; resistance is at $14.40-$15. A break above $14.40 could target $16; a drop below $13.44 risks $12.50

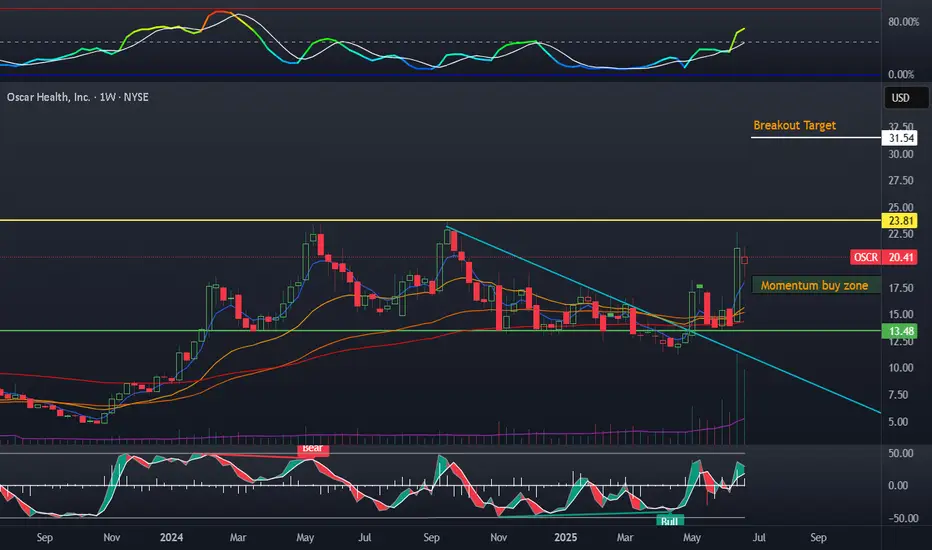
OSCR played out, where to DCA?OSCR played out nicely with a huge pop off price action. I was able to sell my leaps, and have already realized a few weeks of unassigned covered-calls. During the bounces near the bottom zone I was adding every few days. Where do I plan on averaging up? Around 17.5$ if we get there. I will also sell CSP within this zone.
Oscar like hims challenges the big legacy model of healthcare. The 24$ zone will continue to be an area of huge resistance. This is the highest volume the stock has ever had, a good sign.
Meli bounce on channel breakMeli is one of my largest positions and I am glad I added heavily on the bottom of the channel around 1700$. My prediction was that this channel break would bounce and hold, this has occurred, the bounce was VERY strong as well.
My short-term target is 2800$.

cera ...consumer durables ..seems at good price cera ...consumer durables ..seems at good price ...
price at support showing great support ...price action seems good ...it could a good swing opportunity...do study it guys

THIS IS NOT "blackbird" or"elevate.No Idea why this share would be assoicated with BIRD.LSE
Not the same company, never was.
Get the fk out of that as soon as you can.
No advice
SSB

How will NVDA react to the meeting between Canada and USA?Possible Upsides for NVIDIA
Pricing Power & Revenue Buffer
-If Canadian-sourced semiconductors face tariffs, NVIDIA could raise prices across its product line to cover margin impacts—shifting cost to customers.
Accelerated Supply Chain Shifts
-The threat (or reality) of disruptions can drive companies to prioritize U.S. or Taiwan-based supplies, where NVIDIA is deeply integrated, potentially shortening delivery cycles.
Competitive Advantage
-Rivals relying on affected Canadian inputs might see delays or cost increases—NVIDIA could gain market share in both AI datacenter and auto/industrial segments.
Risks & Downsides
Higher Costs for Hardware Buyers
-If tariffs increase the cost of critical components like chips or memory, end-users might delay purchases, potentially reducing NVDA’s sales volume.
Spillover Sentiment Hit on Tech Stocks
-Trade wars often cause broad tech stock sell-offs. As a high-growth leader, NVDA could see increased volatility, even if its business remains strong.
-Disclaimer: This analysis is for informational and educational purposes only and does not constitute financial advice, investment recommendation, or an offer to buy or sell any securities. Stock prices, valuations, and performance metrics are subject to change and may be outdated. Always conduct your own due diligence and consult with a licensed financial advisor before making investment decisions. The information presented may contain inaccuracies and should not be solely relied upon for financial decisions. I am not personally liable for your own losses, this is not financial advise.

AMD: Looking a bit bearish Sort of taking a break from posting about SPY which never seems to do anything interesting.
So posting about AMD which I have been day trading more frequently recently.
Looking at AMD, expecting some upside initially to 145 region, perhaps a gap up into Monday, but overall, the impression is a pullback towards 136.55 and potentially 134.
Probability is to the downside here with the general forecasting outlook being rather bearish tilted.
Let's see what we get on Monday, but expectation is that the pullback should be starting Monday, mid-Monday.
Not advice and as always, safe trades!


To 26$The price has been repeating the same pattern for months…
It drops to the $19 support level (blue line), then climbs back up to the $22 resistance (purple line).
When it breaks above $22, it rallies to $26 (light blue line), only to fall back to $19 after failed breakouts.
Last week, it closed above $22 and is now heading for a new test of the $26 level

strong technical uptrendeverything mention about in my chart
I am not sebi reg
just my own technical analysis
happy trading
Happy good day....

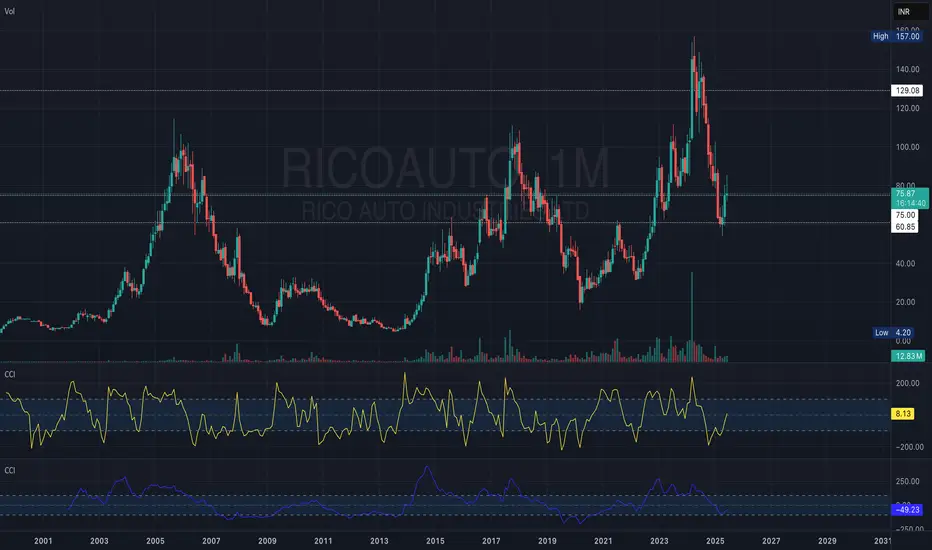
After recent correction Rico auto industries...After recent correction looks like Rico Auto found the base at 75 and will not go below 75, one can start buying in tranches for targets towards ATH...slow move....
INDUS TOWER - BREAKOUTNSE:INDUSTOWER Breakout stock with momentum indicators and multiple timeframe.


NCL IND - BREAKOUTNSE:NCLIND Breakout stock with multiple timeframe analysis and momentum indicators.


LTFOOD BUY @ 460-480. TARGET 800LTFOODS | Breakout 🍚🚀
Best Buy: ₹460–480
🎯 Target: ₹800+ in 6–12 months
#UniproMomentumPattern detected
📈 Strong volume surge + breakout from base
#LTFOODS #StockMarketIndia #BreakoutStocks #CupWithHandle #Multibagger


JUBILANT PHARMOVA - BREAKOUTNSE:JUBLPHARMA Breakout stock with momentum and bullish on multiple timeframes.

SML ISUZU - BREAKOUT RETEST BREAKOUTNSE:SMLISUZU Breakout stock with momentum indicators and bullish on multiple timeframes.

PRIVI SPECIALITY - BREAKOUT STOCKNSE:PRIVISCL Breakout stock on multi timeframe from qty , weekly, daily charts. momentum indicators also in force.

GRAPHITE - BREAKOUT NSE:GRAPHITE Breakout stock with consolidation of many years, weekly and monthly also positive.
