HIMS - Potential Bearish ABCD & FVG Retest Setup (4H)\HIMS is currently showing signs of a potential bearish ABCD pattern forming, with the recent rejection at point A and retracement towards B, holding around the 1.617 Fibonacci extension level. A possible short-term bounce may occur toward point C (0.618 retracement), before continuing downward.
📉 Bearish Scenario:
If C confirms as a lower high, a drop toward the FVG GAP zone between $31.85 and $27.94 becomes highly probable, aligning with the 1.618–1.886 Fib extension.
The volume profile indicates a low-volume node (LVN) around the FVG, making it an attractive magnet for price.
🔍 Key Levels:
Resistance Zone (Red Box): $66–$74 (previous supply and high-volume node)
Support/FVG Target: $31.85 (1.618 ext) / $27.94 (1.886 ext)
POC above: $56.02 – potential pivot level if bulls regain control
⚠️ Watch for:
Reaction at $49.50–$50.00 resistance (0.618 retrace zone)
Volume confirmation on breakdown toward FVG zone

here is the #chart for $AVGOBullish with high expectations. Broadcom ( NASDAQ:AVGO ) is at $269.35, down 0.30% daily but up 11.28% monthly, as shown in the finance card above. X posts and analyst upgrades (HSBC to $400, Bernstein to $295) reflect strong optimism, driven by AI chip demand (projected $28.4B in 2026, $42.8B in 2027) and 25% YoY infrastructure software growth. Technicals show a bull flag breakout, targeting $276.84-$400. However, insider sales ($10.5M by CEO, $13.1M by CLO) and a high valuation (45x trailing earnings) suggest caution. Support is at $266.88; resistance is at $271.85. A break above $271.85 could push toward $295; a drop below $266 risks $260

Fortis Healthcare_Short_Rejection at All time HighFortis Healthcare Short:
- Price rejection All time High
- Bearish Engulfing Candle
- Short when Prices are favorable at the lower timeframe
- high probability trade
- Target: 20 DEMA
- SL: 803 (Friday's High)

here is the #chart for $BABA Bullish with short-term caution. Alibaba ( NYSE:BABA ) is at $114.08, up 0.13% daily but down 2.92% monthly, as shown in the finance card above. X posts reflect bullish sentiment, citing a breakout above the 200-week moving average and a potential move toward $168-$183.13, driven by strong AI/cloud growth (triple-digit AI revenue for seven quarters) and share repurchases (15.2M shares canceled in May 2025). Analysts rate it a "Strong Buy" with a $153.62 target (34.6% upside). However, technicals show resistance at $120.63-$123.90 and a bearish wave correction, with support at $113.32-$116.54. Tariff risks and a mixed options sentiment add volatility. A break above $120 could target $127; otherwise, a pullback to $113 is possible

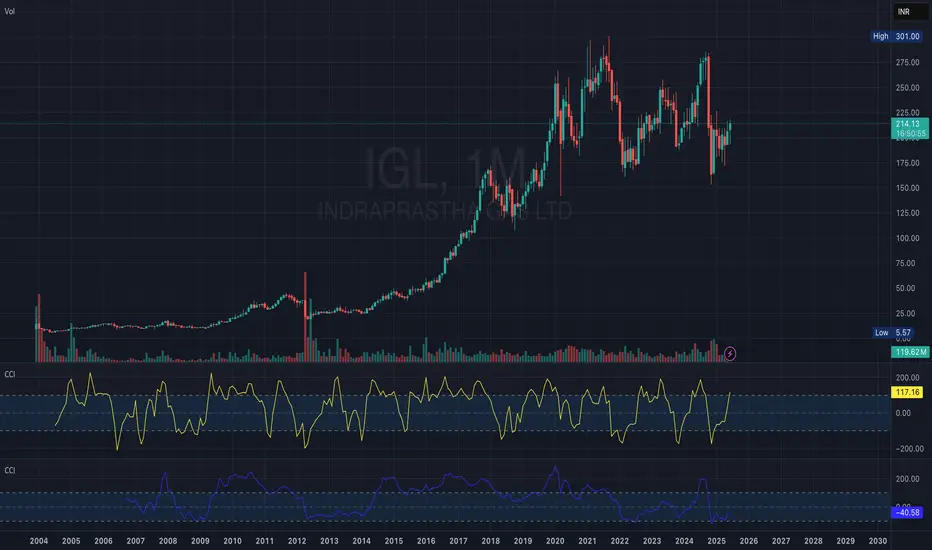
IGL can move back to ATHIGL trying to break the resistance price around 214, once breaks it, slowly IGL can move back to ATH.
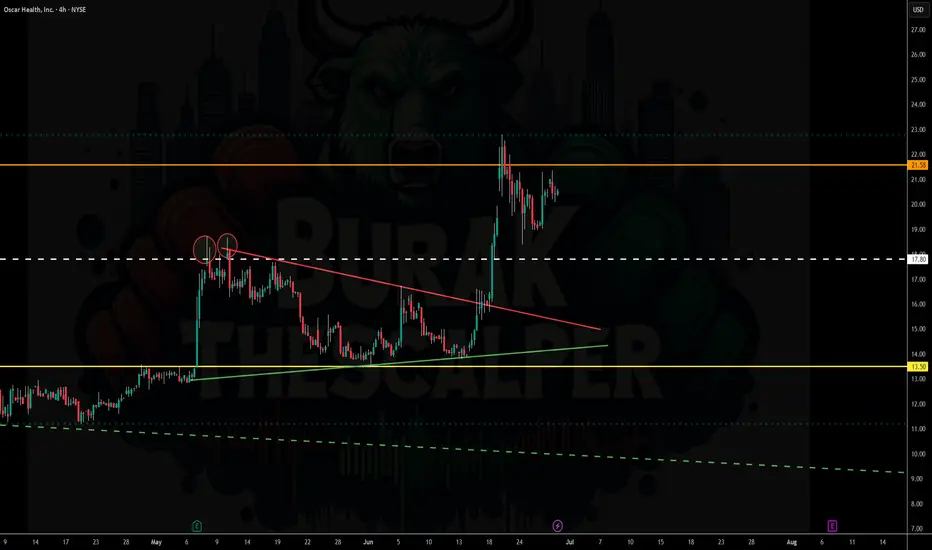
here is the #chart for $OSCR Neutral with upside potential. Oscar Health ( NYSE:OSCR ) is at $20.41, down 0.34% daily but up 36.43% monthly, as shown in the finance card above. X posts highlight strong bullish sentiment, with a weekly wedge breakout and high volume fueling optimism for a move toward $25-$30. Fundamentals are solid, with 42% Q1 2025 revenue growth, $1.2B net cash, and 660% EPS growth projected for 2025. However, volatility (13% weekly) and a downgrade to Market Perform by Raymond James (price target cut to $18) signal caution. Support is at $19.50-$20; resistance is at $21.36-$23.79. A breakout above $21.36 could target $25, but earnings concerns and a high valuation (255% premium per Morningstar) cap near-term upside
nbcc stockIn NBCC stock, a cup and handle pattern has formed on the 15-minute time frame and it is now retesting. One should watch this stock — a big move could come.

here is the #chart for $CACI Bullish with moderate risk. CACI International ( NYSE:CACI ) is at $453.57, down 0.21% on June 20, 2025, but up 4.93% over two weeks, with a 52-week high of $588.26. Analyst sentiment is strongly positive, with 15 Buy ratings and an average 12-month price target of $530.57 (17.73% upside). Recent contracts ($437M, $400M, $147.51M) and a Buy rating from Stifel ($576 target) highlight strong government demand and a high-quality backlog. Technicals show a rising trend, with support at $404.00 and resistance near $460. Risks include short-term volatility (2.77% daily average) and tariff impacts on costs, but strategic positioning in defense tech supports growth

Asian Paints Long_Support @ 20 DEMA, Turnaround StoryAsian Paints Long:
-Price takes support at 50 DEMA & 20 DEMA
-Bullish Engulfing Candle with Good Volume
- Target 200 DEMA
- SL: Close below 20 DEMA
- Enter when prices are favorable in the lower timeframe

Heromoto Long_Price support @ 20 DEMAHeromoto Long:
-Price takes support @ 20 DEMA & 200 DEMA
-20 DEMA Crosses above 200 DEMA
-Price consolidating for last 1 month after reversal.
-Enter long when the price is favorable in the lower timeframe

Disney: A Magical Breakout in the Making?
🏰After 3 years of consolidation, Disney ( NYSE:DIS ) is finally showing signs of life on the charts. Price action is breaking out of a well-defined falling wedge, aligning almost perfectly with a classic Wyckoff Price Cycle — and it now looks poised to enter Stage 2: The Uptrend.
For traders waiting on confirmation, a clean break and retest of the $122 supply zone could serve as a high-conviction signal that the tide is turning — and that the Magical Kingdom may soon be sprinkling profits across portfolios.
🔥 Fundamentals Catching Up to the Chart
Streaming strength is real:
Disney+ and Hulu combined reached 180.7 million subscribers in Q2 FY 2025, adding 2.5 million new users in a single quarter. Disney+ alone accounts for 126 million subscribers, with 1 million added in North America alone.
Strategic moves underway:
Disney is also in the process of acquiring a 70% stake in FuboTV, integrating it with Hulu + Live TV to supercharge its live-streaming and sports bundling strategy. The deal is awaiting regulatory and shareholder approval before closing.
💡 Bottom Line
With technical momentum and streaming fundamentals finally aligned, Disney could be setting up for a strong multi-year upside move.
Stay sharp. Stay disciplined. And as always — this isn’t financial advice. Do your own due diligence.
Happy Hunting!

Navitas Semiconductor Corporation (NVTS) .Stock Almost completed Wave 1 and wave 2
Ww are in Start of W3 , The Motive powerful wave that I expected to reach between 26.50 $ & 27.50 $ .
After that a small correction will be to Around 16$ - 20$ depending on Aggressive Sellers at that point .
Last 5th wave will end of 1st Wave at around 36.50$ to 40.00$ ( open Distribution Zone ) .
The whole Harmonic pattern is called after Updates [ ] .
Highly recommended for Buying.

wareerti stock Cup and handle Wareerti formed a cup and handle pattern and also broke out; now it’s retesting. At this price, an entry can be made with a small stop loss — check it out and do your own analysis at your own risk. My analysis is mostly wrong anyway."
Entry kab avoid karein:
Agar retest zone par repeatedly price sustain nahi kar raha.
Retest par bhi selling pressure high ho raha hai (volume high).
Market sentiment overall bearish ho.
cup and handle breakout retest entry
Retest price: Retest ideally breakout level ke aas-paas ya thoda upar hota hai. Agar retest bahut deep chala gaya (cup ki midpoint ya handle ke bottom tak), toh setup weak ho jata hai.
Volume confirmation: Breakout par volume high hona chahiye, aur retest par volume kam hona chahiye.
Price action: Retest par bullish candle, hammer, bullish engulfing ya koi bhi strong reversal candle milti hai toh aur confirmation milta hai.
Stop-loss: Retest low ke thoda niche ya handle ke low ke niche (as per risk appetite).

NAVINFLUOR on the Verge of BreakoutNAVINFLUOR is on the Breakout level, but there is a negative RSI divergence in both DTF and WTF. Hence expecting it to Breakdown, unless heavy buying comes in and shoot RSI in overbought zone.
Stock is NC, but shared for learning purpose

WaverVanir_International_LLC | $BLDE Trade Plan ActivationJune 29, 2025 | Chart:
“We don’t predict price. We model narrative probabilities.” – VolanX
🧠 Setup Thesis
Blade Air Mobility ( NASDAQ:BLDE ) is entering a potential Phase 2 expansion cycle after a structural reversal from deep discount levels. Smart Money Concepts (SMC) confirm a Change of Character (CHoCH) from the ~$2.50–$3.00 zone, supported by volume expansion and macro catalyst tailwinds (eVTOL testing, hospital logistics partnerships, strong cash position).
The VolanX Hybrid Predictor, tuned with 0.71 sentiment, projects a neutral-to-flat short-term bias — suggesting a pullback accumulation opportunity, not a breakout chase.
🔍 Key Levels & Trade Plan
✅ Entry Zone: $3.60–$3.80 (Primary), $3.30–$3.50 (Secondary Add)
🛑 Invalidation: Weekly close below $3.10
🎯 Target 1: $5.00 (EQH liquidity)
🎯 Target 2: $6.20 (gap magnet)
🎯 Target 3: $9.90 (macro FVG / high-value zone)
📉 Risk-to-Reward: 1:2.5 to 1:5.5 depending on exit tier
🧬 Catalyst Radar
FAA + eVTOL certifications (2025–2026 roadmap)
Skyports + TOPS logistics network expansion
Potential share buyback or new partnerships
VolanX Sentiment Monitor: trigger re-entry >0.80
⚠️ Risk Disclosure
This post is for educational purposes only. WaverVanir’s views are probability-based and do not constitute financial advice. Always model your risk.
“BLDE is not a meme. It’s a model. Accumulate where they forget, exit where they chase.”
🔐 Posted by: WaverVanir_International_LLC
#BLDE #SmartMoney #eVTOL #VolanX #WaverVanir #TradingView #AITrading #UrbanMobility

[LTF] Long TermHi there,
LTF is looking good for long term only if monthly candle closes above the ATH. Breakout of Cup and Handle is a strong uptrend.
This is only for educational purpose, pls consult your financial advisor before investing.

LT FOODS LTD on WeeklyLT FOODS LTD on this week give buy signal on our private indicator "VaultSignal Pro Weekly".
Watch W.ADR% and trade according to it.

NVIDIA"It’s clear that this stock is currently in a strong upward wave and could advance toward wave 5 of 3, targeting the $1,090–$1,350 range. After reaching this zone, it may enter a corrective phase as wave 4, which could bring a pullback to the $150–$250 range. Following that, the stock is expected to resume its main wave 5 rally, with targets between $5,000 and $7,200."

"Steal the Market: PLTR Trading Strategy Revealed!"🌟 Hola, Money Snatchers & Market Rogues! 🌟
Ready to hit the vault? 💰💸✈️
Here’s the ultimate plan for lifting loot from PLTR (Palantir Technologies Inc.) using the infamous Thief Trading Style. This is no rookie job—we’ve got the techs and the fundamentals to nail the target. Our sights are locked on the high-stakes Red Zone: nuclear resistance, overbought territory, trend reversals, and that sweet electric trap where traders and bearish bounty hunters lie in wait. 🏆💸 It’s time to bag those profits and live like a kingpin!
Entry Point 📈:
Doors are wide open! Snatch that bullish loot at any level—it’s a free-for-all! For extra stealth, set your buy limits around recent 15–30 min swing highs or lows. Pro tip: throw in some chart alerts to stay ahead of the game.
Stop Loss 🛑:
Our Thief SL lands at the recent 2h swing low (116.00) on a swing-trade basis—tight enough to dodge the cops but wide enough to let the heist breathe. Adjust based on your bankroll and risk appetite—don’t get greedy, and always plan your getaway.
🏴☠️ Target 🎯: 152.00—or duck out early if the sirens start blaring!
🧲 Scalpers, listen up 👀:
Only scalp on the long side—no backstabbing shorts here! If you’ve got the bankroll, go all-in; otherwise, team up with swing traders and ride the big wave. Use a trailing SL to keep your loot safe from sudden ambushes.
PLTR (Palantir Technologies Inc.) is on a bullish tear—thanks to a mix of market signals and that sweet fundamental juice:
📰🗞️ Stay locked in with the latest—fundamentals, macro reports, COT updates, geopolitical heat, sentiment, intermarket moves, index breakdowns, position shifts, and trend forecasts. Link’s in the bio—don’t miss it! 👉👉👉
📌 Pro Tip: Markets can flip faster than a getaway car—stay sharp and ready to pivot.
⚠️ Trading Alert:
News drops can spike the alarm system—here’s how to keep your loot safe:
🚫 Skip new trades during releases
🚏 Lock in profits with trailing stops—no one likes getting caught!
💖 Show some love for the crew—💥 Smash that Boost Button 💥—and keep the Thief Trading Style alive. Let’s make bank every day like true market outlaws! 🏆💪🤝❤️🎉🚀
Stay tuned—another big score’s just around the corner! 🤑🐱👤🤗🤩

+266% in ONE DAY from $1.30 to $4.75 $RCT🔥 +266% in ONE DAY from $1.30 to $4.76 🚀
Spotted the setup early, but my official safety criteria checklist wasn't all green due to price action until later when it was too late NASDAQ:RCT
Sometimes discipline keeps you out early on even when the move goes wild

NVIDIA(NVDA) Jackpot – Thief Trading Blueprint for Fast Profits!🚀 NVDA Stock Heist: The Ultimate AI Gold Rush (Scalping/Day Trade Plan)
🌟 Hey there, Market Pirates! 🏴☠️💰
Thieves, Traders, and Money Makers—gather around! Based on the 🔥Thief Trading Style🔥, here’s our master blueprint to loot NVIDIA’s AI-fueled rally. Follow the strategy on the chart—long entry is LIVE! Our escape? Near the high-risk Resistance Zone. Overbought? Consolidation? Reversal trap? Bears are lurking, but we’re stealing profits first! 🎯💸
🎯 Entry (The Vault is Open!)
"Swipe the AI gold at any price—the heist is ON!"
Pro Tip: Use buy limits within 15-30min near swing lows/highs for pullback entries.
🛑 Stop Loss (Thief’s Escape Route)
SL at recent swing low (4H timeframe)—adjust based on your risk & lot size.
Scalpers/Day Traders: Tighten SL if stacking multiple orders.
🏆 Target 🎯: 165.00 (The AI Jackpot!)
📈 Why NVDA?
Bullish momentum from AI dominance, earnings hype, and institutional FOMO.
Tech sector strength + chip demand = THIEF’S PARADISE.
📰 Fundamental Heist Intel
Need macro trends, sentiment, and intermarket analysis? 🔗 Check our bioo for the full robbery toolkit.
⚠️ Trading Alert: News & Position Control
Avoid new trades during earnings/news—volatility kills heists!
Trailing SLs = Locked profits. Don’t get greedy!
💥 Boost This Heist!
👊 Hit "Like" & "Boost" to fuel our next raid. Every click = More stolen profits! 🚀💰
🤑 Stay tuned—more heists coming! NVIDIA today… what’s next? 🤫🐱👤

Profit Raiders’ Guide to Conquering AMAZON Stock!Hello, Wealth Warriors! 🌟
Stock market adventurers, let’s embark on a thrilling quest to dominate AMAZON stock with our cunning Raider Trading Strategy! 🗡️📈 Fueled by razor-sharp technical analysis and robust fundamental insights, this plan targets high-reward zones while dodging market traps. Follow the long-entry map, aim for the golden profit zone, and stay vigilant for overbought signals, consolidation, or bearish ambushes that could shift the trend. 🐻🔍 Secure your gains and celebrate your victory! 🎉
Entry 📈
The treasure chest is wide open! 🏰 Seize the bullish momentum at the current price of $206.02—your adventure begins! For precision, set Buy Limit orders on a 15 or 30-minute chart for pullback entries, targeting a retest of recent highs ($206.69) or lows ($202.19).
Stop Loss 🛑
📍 Place your Raider Stop Loss at the recent swing low ($196.00) on a 4-hour chart for day trades. Adjust based on your risk tolerance, position size, and number of trades to stay in control. 🛡️
Target 🎯
Set your sights on $217.00 or exit early to lock in your profits! 💸 Refer to the finance card above for price trends.
Scalpers, Stay Sharp! 👀
Focus on quick long-side trades. Large accounts? Strike now! Smaller portfolios? Join swing traders for the raid. Use a trailing stop to safeguard your gains as the stock moves. 🧲💰
AMAZON Stock Market Insights 📊
AMAZON is charging bullish, driven by strong fundamentals. 📈 Dive into earnings reports, macroeconomic trends, geopolitical events, market sentiment, sector correlations, and future price projections for a complete view. As of May 28, 2025, at 12:04 AM EST (UTC-5), the stock’s momentum is supported by a market cap of $2.17 trillion and a year-to-date high of $242.52. Stay informed! 🔗
⚠️ Trading Alert: News & Risk Management 📰
Market-moving news can strike fast! Protect your gains:
Avoid opening trades during major news events.
Use trailing stops to secure profits and minimize losses. 🚫
Join the Raid! 💥
Support our battle plan—smash the Boost Button! 🚀 Let’s conquer the market with the Raider Trading Strategy and stack profits like true stock market legends. 💪🤝 Prepare for the next adventure, raiders! 🤑⚔️🎉

AMAZONAMZN needs some more upside before a pullback.
Disclosure: We are part of Trade Nation's Influencer program and receive a monthly fee for using their TradingView charts in our analysis.
