SHOP watch $126.79-127.28: Major Resistance may start a RetraceSHOP surged into a significant resistance at $126.79-127.28.
Zone of a Golden Genesis fib paired with a Covid Simulus fib.
Looking for a Break-n-Retest or Dip-to-Fib for long entries.
.

Zscaler May Be OversoldZscaler recently climbed to a three-year high, and now it’s pulled back.
The first pattern on today’s chart is the May 30 gap after earnings and revenue beat estimates. That may reflect positive fundamentals.
Second, the cybersecurity stock has retraced half the move following results. Stabilizing here may confirm direction is pointing higher.
Third, prices are trying to stabilize near the rising 50-day simple moving average.
Fourth, stochastics have dipped to an oversold condition.
TradeStation has, for decades, advanced the trading industry, providing access to stocks, options and futures. If you're born to trade, we could be for you. See our Overview for more.
Past performance, whether actual or indicated by historical tests of strategies, is no guarantee of future performance or success. There is a possibility that you may sustain a loss equal to or greater than your entire investment regardless of which asset class you trade (equities, options or futures); therefore, you should not invest or risk money that you cannot afford to lose. Online trading is not suitable for all investors. View the document titled Characteristics and Risks of Standardized Options at www.TradeStation.com . Before trading any asset class, customers must read the relevant risk disclosure statements on www.TradeStation.com . System access and trade placement and execution may be delayed or fail due to market volatility and volume, quote delays, system and software errors, Internet traffic, outages and other factors.
Securities and futures trading is offered to self-directed customers by TradeStation Securities, Inc., a broker-dealer registered with the Securities and Exchange Commission and a futures commission merchant licensed with the Commodity Futures Trading Commission). TradeStation Securities is a member of the Financial Industry Regulatory Authority, the National Futures Association, and a number of exchanges.
TradeStation Securities, Inc. and TradeStation Technologies, Inc. are each wholly owned subsidiaries of TradeStation Group, Inc., both operating, and providing products and services, under the TradeStation brand and trademark. When applying for, or purchasing, accounts, subscriptions, products and services, it is important that you know which company you will be dealing with. Visit www.TradeStation.com for further important information explaining what this means.

COIN (Update) -- Potential Max Price TargetHello Traders!
Coin seems to potentially have a little bit more steam left. If it does make one more push... where will price go?
At $429.54 we have the All Time High for COIN.. interesting enough that price was hit on the first day of trading for COIN which adds to the significance of this price level. There is also a trendline connected from pivot to pivot. These two factors converge and create a significant level of resistance.
Most likely I will be entering a short position at this level.
Thanks everyone and best of luck on your trading journey!

BABA: triangle with tensionOn the weekly chart, BABA has already formed a golden cross - price is above both MA50 and MA200, confirming a bullish trend shift. The stock is now approaching the upper edge of the symmetrical triangle and the key resistance at $122, which also aligns with the 0.5 Fibonacci level.
The numbers inside the triangle represent the contraction phases, not Elliott waves. This is a classical consolidation before a potential breakout. If the $122 level is broken and retested, upside targets are $128 (0.618), $137 (0.786), and eventually $148–181 (1.0–1.618 extension).
Volume is rising, MACD is flipping bullish, and RSI is climbing out of oversold territory — all signs point to growing bullish momentum.
Fundamentally, Alibaba benefits from China's economic rebound, possible regulatory relief, and ongoing share buybacks. With Chinese tech rotating back into favor, BABA could lead the rally.
So if you're still waiting for a signal - it's already here. The golden cross is done, price is flying above moving averages, and all that’s left is a clean breakout. Watch $122 — that’s the launchpad.

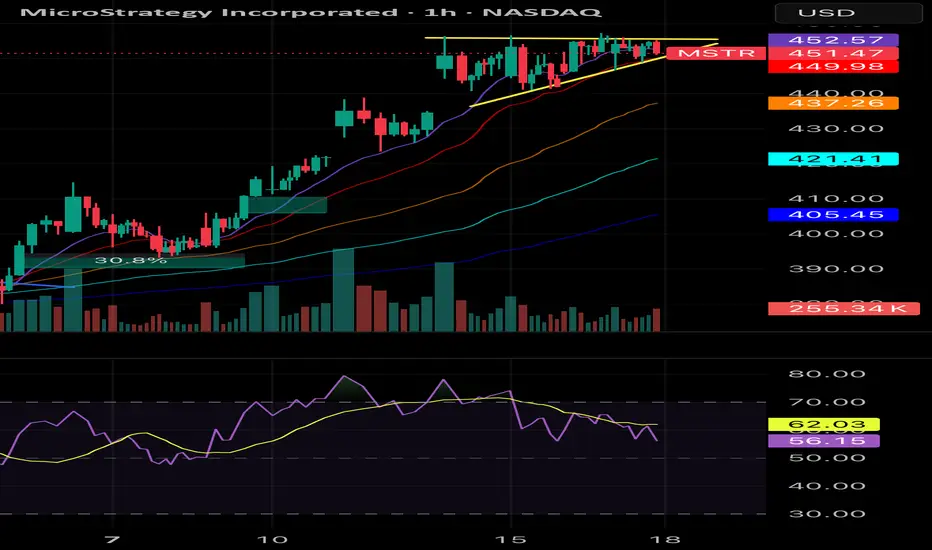
MSTR's ASCENDING TRIANGLEMstr appears to be in an ascending triangle. Broke out of a wedge I tracked a while ago, crypto is breaking out in general and bullish crypto legislation is being passed. MSTR thus has potential to breakout all the way up to 500 or more. nfa
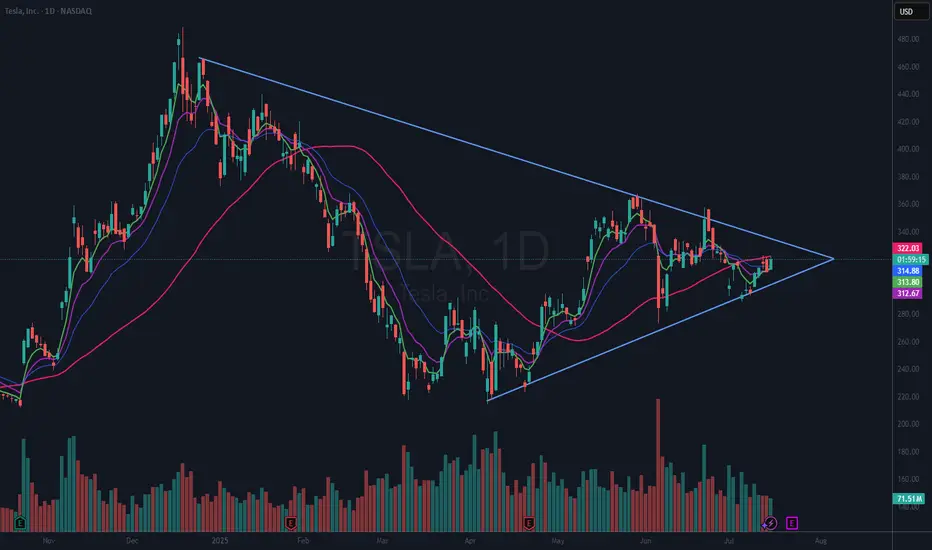
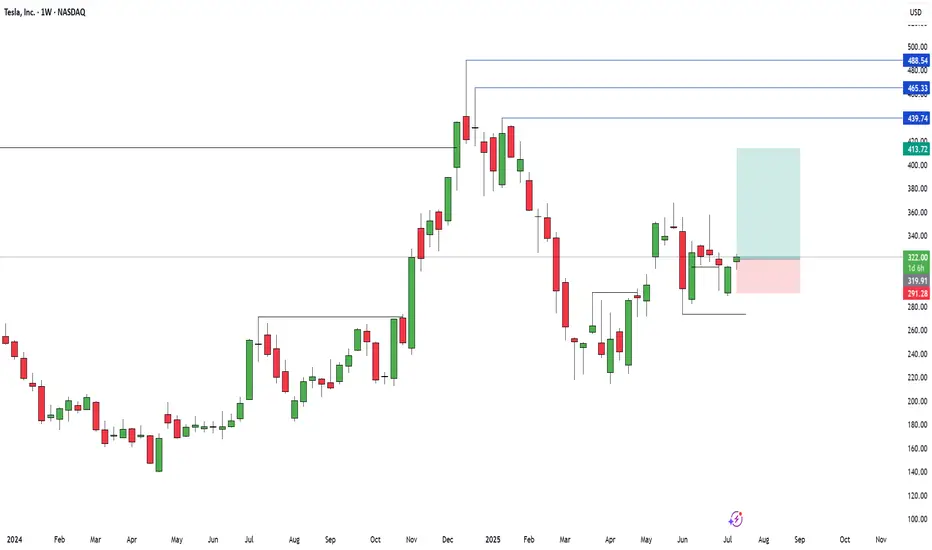
$TSLA Giant Wedging Pattern (VCP)NASDAQ:TSLA is in a giant 7 month wedging pattern. It can be seen as a VCP (Volatility Contraction Pattern) as well. These types of patterns can break either way. However, in this case we have a rising 50 DMA (red). That suggests to me that this will break to the upside.
I already have a small position in TSLA and I will look to add if or when it breaks above the 50 DMA and again if or when it breaks above the upper downtrend line. If it breaks the lower line, I am out.
Be aware that Tesla reports earnings in 7 days, Wednesday, July 23rd, after the bell.
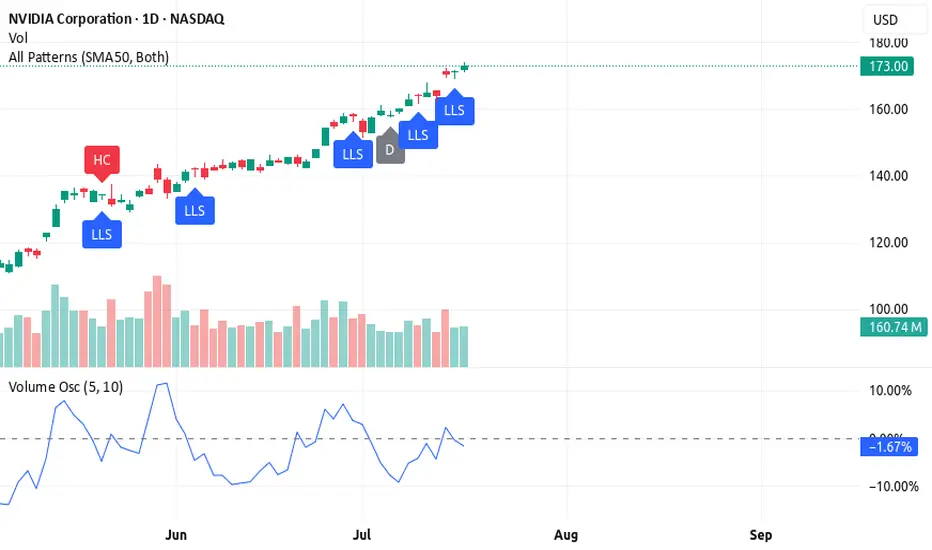
3 Reasons Why Nvidia (NVDA) Looks Bullish Right Now🚀 3 Reasons Why Nvidia (NVDA) Looks Bullish Right Now
Nvidia is showing strong signs of a bullish breakout. Here are 3 solid technical reasons why NVDA could be ready to lift off 📈
1️⃣ Candlestick pattern – long lower shadow
The long lower shadow signals buyers stepped in after early selling pressure. This shows strong demand at lower prices — classic bullish behavior.
2️⃣ High daily volume
Nvidia is trading on increased volume today, confirming that big players are active. High volume validates the price action and increases the reliability of the bullish setup.
3️⃣ Reversal on the volume oscillator
The volume oscillator is reversing from below zero, signaling momentum may be shifting back to the bulls. This indicates a potential trend change just before a new rally begins.
🔥 Bonus: Rocket Booster Strategy
NASDAQ:NVDA fits the Rocket Booster Strategy:
Price is above the 50 EMA
Price is above the 200 EMA
A recent gap up confirmed by candlestick support
When all these factors align, it’s like lighting the engines for a bullish liftoff.
Rocket boost this content to learn more
---
⚠️ Disclaimer: Always use a simulation (demo) account before trading with real money. Learn proper risk management and profit-taking strategies to protect your capital.
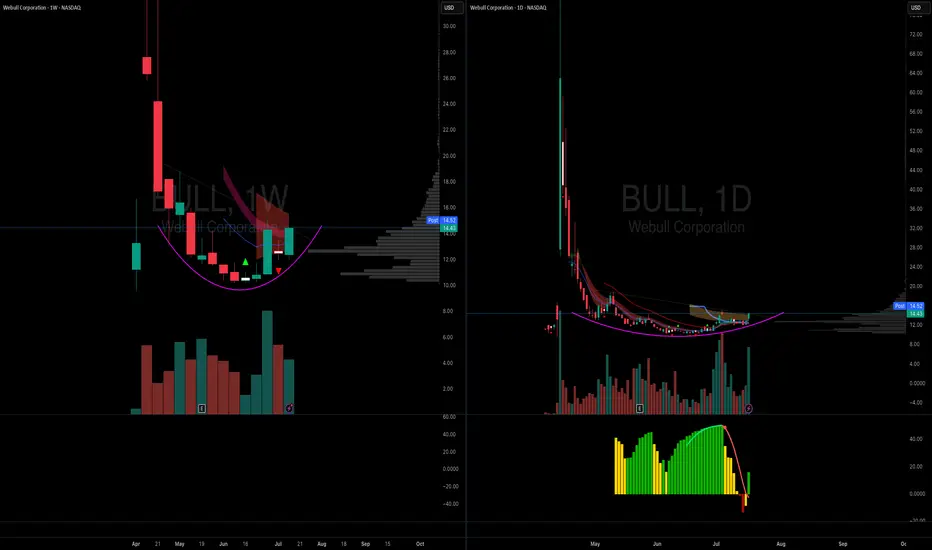
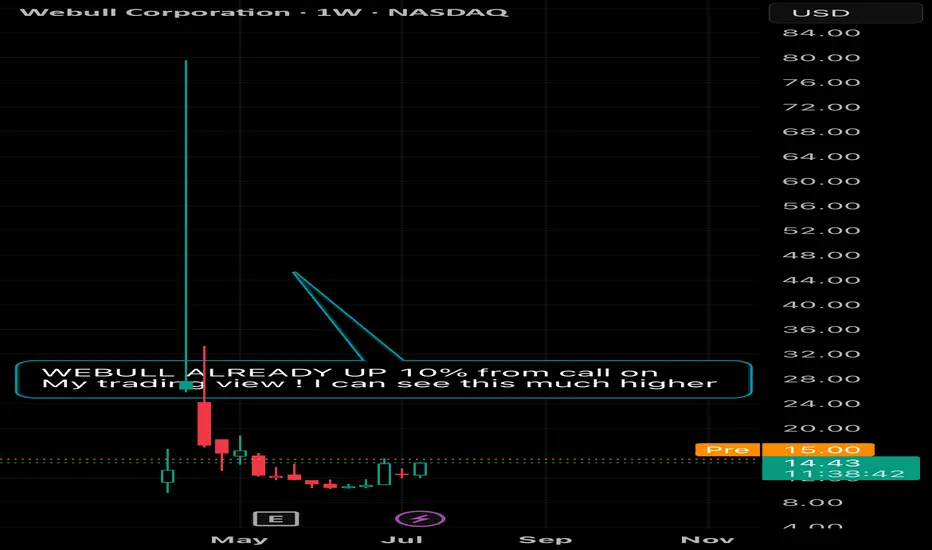
Webull gonna catch up now...?NASDAQ:BULL has a rounding base and a cranked inverted head and shoulders on the4 hour
this is a recent IPO
looks ready to go
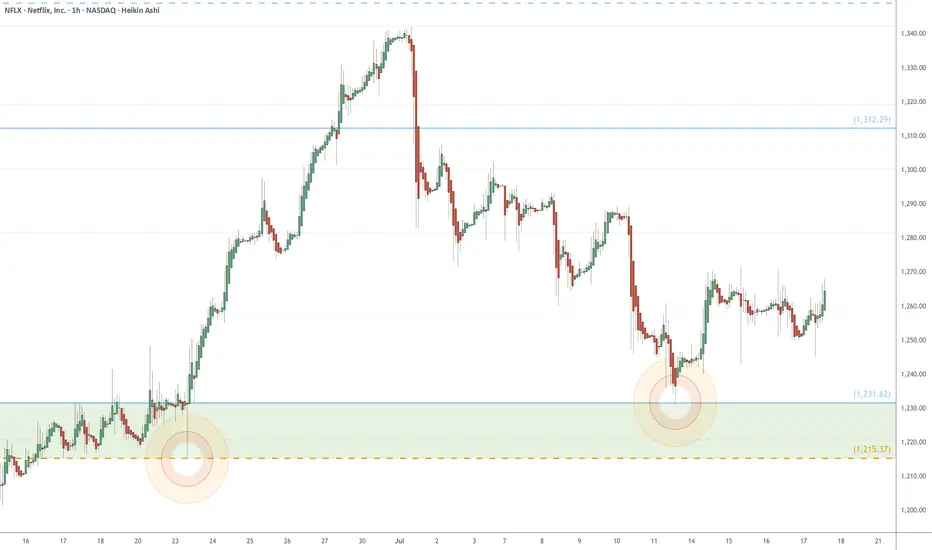
NFLX eyes on $1215-1232: poised for next leg UP with earningsNFLX broke and retested a key resistance zone.
Loud PING's on two major fibs announced support.
It is perfectly set to LAUNCH if earnings are good.
Positive earnings may push to mid $1500's above.
Negative may drop to $1061 Golden Genesis below.
Neutral report should continue uptrend from here.
.
See "Related Publications" for previous charts such as this BOTTOM CALL:
============================================
.
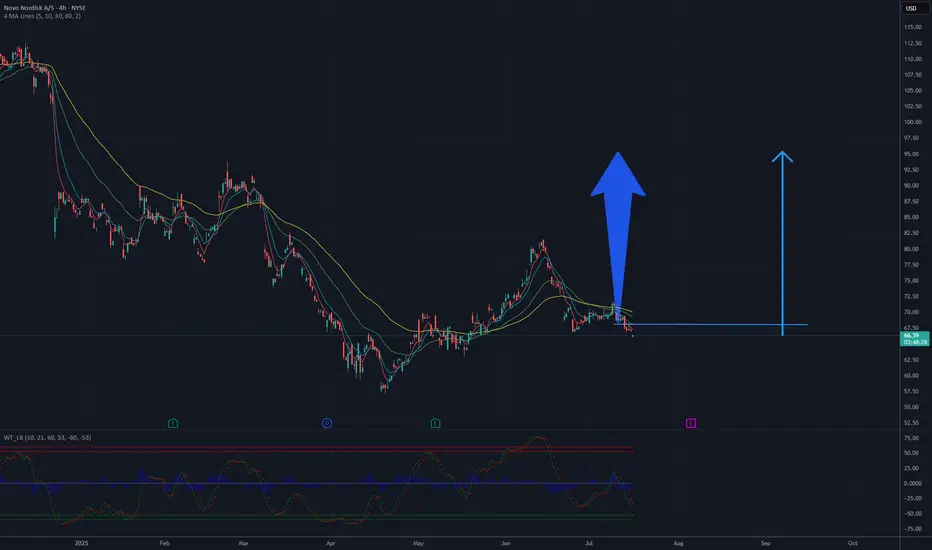
Potential Upside Move in Novo Nordisk Stock Toward the $90–$100 Based on the 4-hour chart of Novo Nordisk A/S (NYSE: NVO), the stock has undergone a strong downward correction from above $165, but is now showing signs of a potential technical bottom near the $65 level. Price action has stabilized, and oscillators indicate oversold conditions, suggesting a possible trend reversal.
The chart shows a short-term consolidation after a bounce, and the moving averages (MA 5/10/30/60) are converging — a setup that often precedes a bullish breakout. The $90–$100 area aligns with former support-turned-resistance zones, making it a natural target for a corrective upward move.
Conclusion: If the current momentum holds and the price breaks out of the local consolidation, a move toward the $90–$100 range appears likely as part of a broader rebound following the extended downtrend.
Potential TP : 90-95 USD
AMD Overview & Elliott Wave CycleAMD recently reported strong Q2 2025 results, with growth driven by Data Center and AI segments, notably thanks to the Instinct MI300 chip family. Revenue rose +15% YoY, with a significant boost from AI-related demand. Future projects include next-gen GPUs, AI platforms, deeper cloud integration, and investments in 3nm architectures.
From a technical perspective, AMD appears to be in a primary Elliott Wave cycle, which may have begun around October 2022. Such cycles typically last between 3 and 10 years. This insight comes from years of study, hands-on practice, and applied quantitative models,not guesswork.
If you found this interesting, share it with others: spreading thoughtful analysis matters.

$ACHR SQUEEZETime Frame: 1D
RSI : Neutral
MACD : Nearing bullish cross
Fib Levels : Retraced back to 50.0%
Targets:
#1: $13.09
#2. $16.94
Pattern invalidated of drop below 61.8% ($8.74) Fib level.

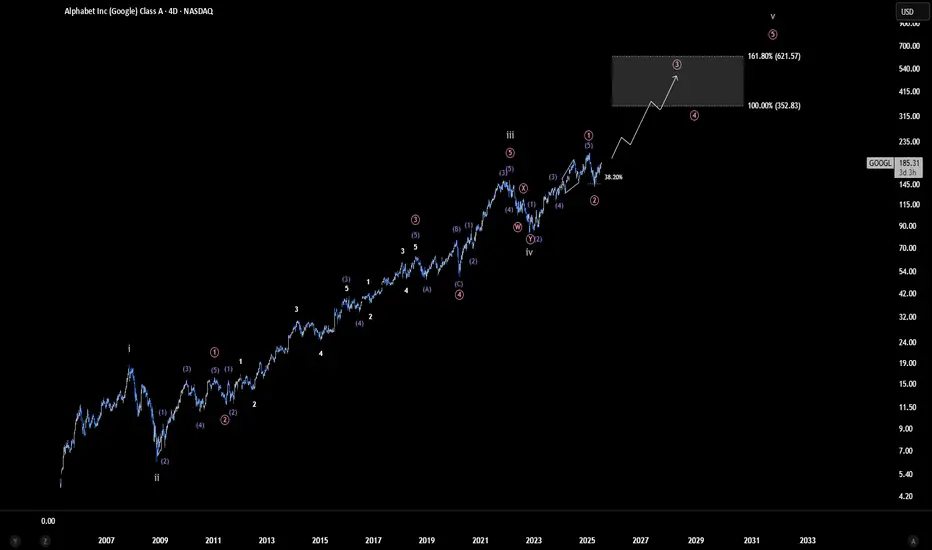
Alphabet (Google) - Ready to Surge Again? | Ew analysisWe appear to be in the final wave of a major bull run that began all the way back in 2005. If this count unfolds as expected, Google could potentially rally toward the $350–$620 range or even higher representing a gain of over 200% from current levels. This would mark the completion of the fifth and final wave before a major long-term correction sets in.
That said, it's important to stay cautious. A sustained break below the current gray wave 5 would invalidate this scenario and suggest that the long-standing bull cycle may already have come to an end.
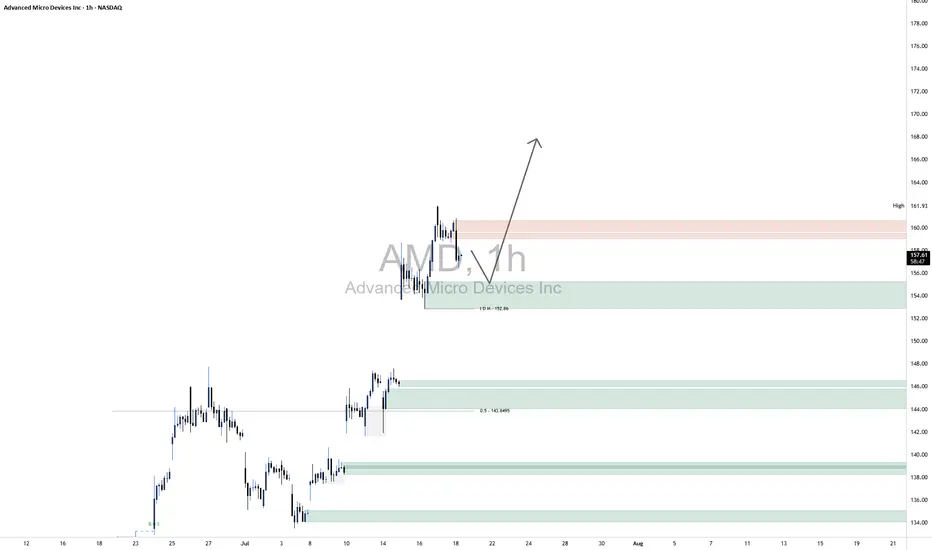
AMD LongKey Technical Insights:
Clean Rejection from Demand Zone:
Price recently tapped into a well-defined demand zone (highlighted green) around $152–$155.
The immediate bounce suggests that buyers stepped in with strength, likely absorbing sell-side liquidity.
Liquidity Grab Below Short-Term Lows:
Before the move up, price dipped just enough to trigger stops below recent lows, clearing out weak hands.
This kind of liquidity sweep is often used by smart money to build long positions before a directional push.
Current Price Action:
Price is consolidating just below a minor supply zone around $159–162.
This pause is constructive: it signals that momentum may be building for a breakout higher.
Upside Outlook (Based on Your Arrow)
Your arrow points to a bullish breakout — and that aligns well with current price structure.
Once supply near $161 is absorbed, price has a clear path to push toward the mid-160s and beyond.
The current higher-timeframe trend supports continuation, and any short-term dip into the $155–156 range may offer re-entry opportunities.
Will this stock skyrocket 500x to $700?Talk of the moment is tariffs and the impact they’ll have on business and individuals. Generally, nothing good. A zero sum game in WW opinion.
For a future preview, see Brexit for details. American citizens have chosen to impose economic sanctions upon themselves just like Brexit voters. As a result importers will be required increase their paperwork, add fees to raw materials prior to entering the country, impose checks and pass those costs onto the consumer. A consumer that is already weighted down on auto debt.
Ignoring the long term economic impacts one should appreciate the internal demand pressures from manufacturers now needed to replace expensive imports.
In my opinion a number of businesses now exist to reap this demand. The smaller the better.
“American Battery Technology” is one such business that stands to benefit from the surge in EV growth in the US. In particular on the topic of recycling. As tariffs take hold on the imports of raw material the recycling of old becomes an increasingly attractive alternative source.
The TA:
On the above 5 week chart price action has seen a 98% correction since January 2021. A number of reasons now exist for a bullish outlook, they include:
1) Price action and RSI resistance breakouts.
2) Regular bullish divergence, settings used the same as January 2020 impulsive wave.
3) Support on past resistance, look left.
4) No share splits since 2004, excellent.
5) Short interest 9%, after a recent 70% correction?!
6) The bull flag, should it confirm, forecasts a 50,000% move or 500x to $700 area by December 2026. That’s a market capital of $60b for the industry of car battery recycling. Still small potatoes.
Is it possible price action continues to correct? Sure. Sellers, they love it.
Is it probable? No.
Ww
Type: Investment
Risk: You decide
Timeframe for long entry: Now
Stop loss: will say elsewhere
Return: Lambo’s all round

BULL Webull price action has been very nice the past day. My people are DCAing into webull as we look at similar launch patterns to robinhood.
With crypto bills passed. Yorkville acquiring a deal and partnership with webull. And stocks market increasing in interest. I can see this being a very nice gain to 50$
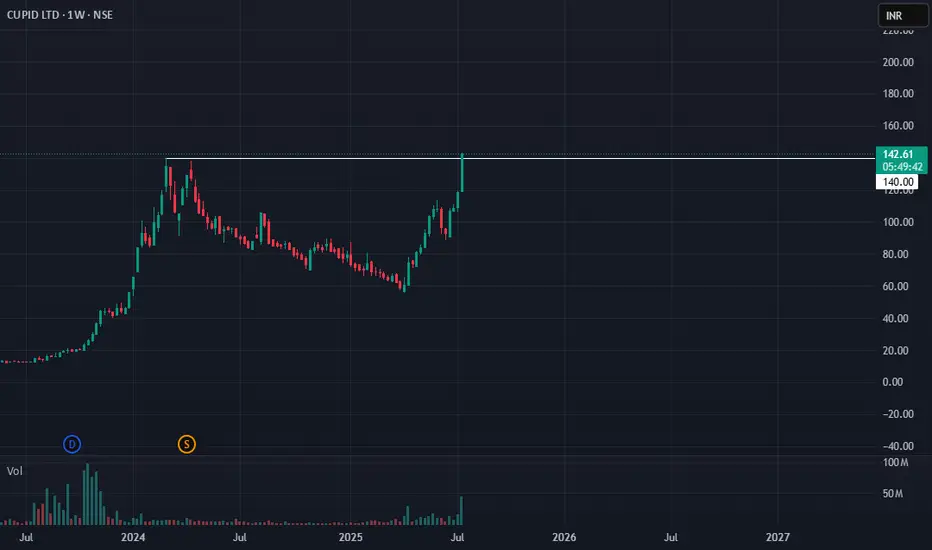
Cupid Ltd: Strong Weekly Volume Breakout!🚀 Cupid Ltd: Strong Weekly Volume Breakout! 🚀
📉 CMP: ₹141
🔒 Stop Loss: ₹88
🎯 Target: ₹220
🔍 Why Cupid Looks Promising?
✅ Rounding Bottom Breakout: Clear breakout on the weekly chart with strong volume support
✅ Volume Confirmation: High volumes indicate genuine buying interest and strength behind the move
✅ Big Stop Loss Strategy: Due to the nature of such breakouts, stocks often show large squats before continuing upward. Maintaining a big stop loss with controlled position sizing is critical to ride the trend.
💡 Strategy & Risk Management:
📈 Staggered Entry: Accumulate in phases to manage volatility
🔒 Strict SL: Keep stop loss at ₹88 and adjust position size to protect capital effectively
📍 Outlook: Cupid Ltd's technical setup suggests potential for significant upside, aligning with strong volume breakout patterns.
📉 Disclaimer: Not SEBI-registered. Please do your own research or consult a financial advisor before investing.
#CupidLtd #BreakoutTrade #VolumeBreakout #TechnicalAnalysis #SwingTrading #MarketInsights #InvestSmart
Let me know if you want breakout educational templates prepared for your upcoming weekend LinkedIn content plan.
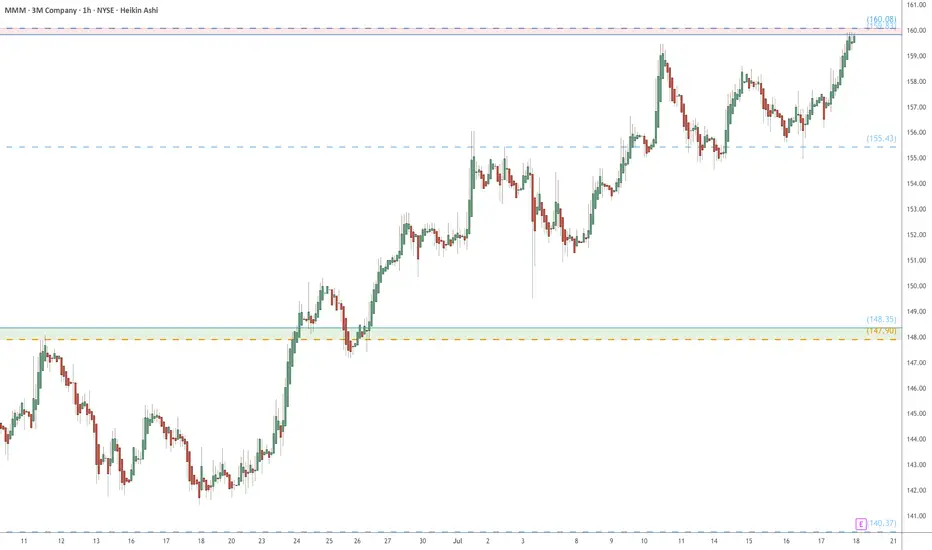
MMM eyes on $160: Resistance Zone waiting for Earnings reportMMM has been crawling off a decade long bottom.
Testing a significant resistance at $159.83-160.08
Earnings report tomorrow, so a key 24 hours here.
.
Previous analysis that caught the BREAK OUT:
Hit the BOOST and FOLLOW for more PRECISE and TIMELY charts.
========================================================
.
Long entry TSLA - Weekly Time FrameIt seems price failed to make a lower low that reversed the most "immediate" uptrend. Therefore, trying to play the entry against those who went short.
Lets see how it plays ouy
NVIDIA Robbery Plan: Bullish Swing Trade to Millions!🔥 NVIDIA (NVDA) Stock Heist Blueprint: Unlock Bullish Profits with Thief Trading Style! 🚀💰
🌟 Greetings, Wealth Warriors! 🌟
Hello, Ciao, Salaam, Bonjour, Hola, and Hallo to all you savvy traders and market masterminds! 🤑💸 Get ready to execute a high-octane trading plan with our Thief Trading Style—a bold fusion of technical precision and fundamental insights designed to crack the NVIDIA (NVDA) stock market vault! 💥📈
📝 The NVIDIA Heist Plan: Swing & Day Trading Mastery 🏆
Based on our proprietary Thief Trading Style, this plan targets NVIDIA (NVDA), currently riding a bullish wave fueled by strong fundamentals and technical setups. Follow the strategy outlined below to navigate the high-risk Red Zone—where overbought conditions, consolidation, and potential trend reversals create opportunities for sharp traders. 💪 Stay alert, as bearish players may set traps at key levels! 🕵️♂️
Entry Strategy: Crack the 🙂Vault! 🏦
Go long with confidence! The market is primed for a bullish breakout. Enter at current prices or set buy limit orders near recent swing lows/highs on the 15-minute or 30-minute timeframe. 📅
Pro Tip: Set price alerts on your chart to catch the optimal entry. Timing is everything in this heist! ⏰
Swing Traders: Look for pullbacks to key support levels for safer entries.
Scalpers: Focus on quick long-side trades with tight stops to maximize gains. 💨
Stop Loss: Protect Your Loot! 🔒
Place your stop loss (SL) below the recent swing low on the 30-minute timeframe (e.g., $162.00 for swing trades).
Adjust your SL based on your risk tolerance, position size, and number of orders. For larger accounts, consider tighter stops to lock in gains early. 🛡️
Scalpers: Use a trailing stop to secure profits while riding short-term momentum.
Take Profit Target: Cash Out Big! 💰
Aim for $191.00 as the primary target, or exit early if momentum slows.
Swing Traders: Hold for the full target if the trend remains strong.
Scalpers: Grab quick profits on smaller price spikes and re-enter on dips.
Pro Move: Use a trailing stop to let profits run while safeguarding gains. 🚀
📌Key Levels & Risk Management
Entry Zone: Market price or swing low – ideal for long positions. 📈
Stop Loss: $162.00 – based on 30m timeframe swing low. 🛑
Take Profit Target: $191.00 – primary target for swing/day trades. 🎯
Risky Red Zone: Overbought levels – watch for consolidation or reversal traps. ⚠️
💡 Why NVIDIA? The Bullish Case 📡
NVIDIA (NVDA) is powering through a bullish phase, driven by:
Fundamentals: Strong demand for AI, gaming, and data center chips. 📊
Macro Factors: Positive market sentiment and tech sector momentum. 🌍
COT Data (Latest Friday Update, UTC+1): Large speculators are increasing bullish positions, signaling confidence in NVDA’s upside (data sourced from reliable platforms). 📅
Geopolitical & News: Monitor upcoming earnings and industry developments for catalysts. 📰
Intermarket Analysis: Tech-heavy indices like the NASDAQ are trending higher, supporting NVDA’s rally. 📈
For a deeper dive, check fundamental reports, COT data, and sentiment analysis to align your trades with the bigger picture. 🔍
⚠️ Trading Alert: Navigate News & Volatility 🗞️
News releases can spark sharp price swings. To protect your capital:
Avoid new trades during major news events (e.g., earnings or Fed announcements). 🚫
Use trailing stops to lock in profits and limit downside risk. 🔐
Stay updated with real-time market developments to adjust your strategy dynamically. 📡
🚀 Boost the Heist! Support the Thief Trading Community 🤝
Love this plan? Hit the Boost Button to amplify our Thief Trading Style and empower our community to conquer the markets! 💥 Every like and share fuels our mission to make money with precision and style. 💪 Join us daily to unlock more high-profit heist plans! 🏴☠️
📌 Important Disclaimer
This analysis is for educational purposes only and not personalized investment advice. Always conduct your own research, assess your risk tolerance, and verify market conditions before trading. Markets move fast—stay sharp and adapt! ⚡
🌟 Stay tuned for the next heist plan, traders! Let’s keep stealing profits together! 🤑🐱👤🎉

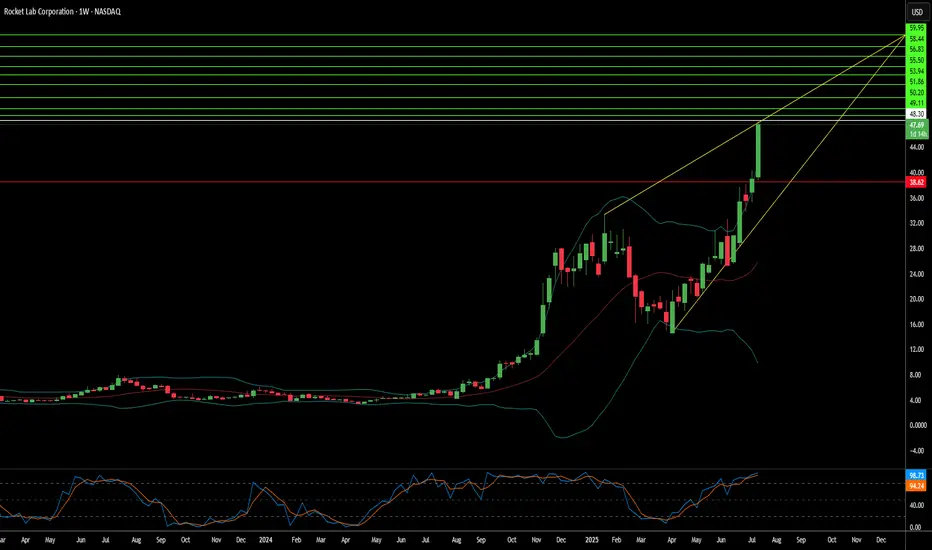
Is Rocket Lab the Future of Space Commerce?Rocket Lab (RKLB) is rapidly ascending as a pivotal force in the burgeoning commercial space industry. The company's vertically integrated model, spanning launch services, spacecraft manufacturing, and component production, distinguishes it as a comprehensive solutions provider. With key operations and launch sites in both the U.S. and New Zealand, Rocket Lab leverages a strategic geographic presence, particularly its strong U.S. footprint. This dual-nation capability is crucial for securing sensitive U.S. government and national security contracts, aligning perfectly with the U.S. imperative for resilient, domestic space supply chains in an era of heightened geopolitical competition. This positions Rocket Lab as a trusted partner for Western allies, mitigating supply chain risks for critical missions and bolstering its competitive edge.
The company's growth is inextricably linked to significant global shifts. The space economy is projected to surge from $630 billion in 2023 to $1.8 trillion by 2035, driven by decreasing launch costs and increasing demand for satellite data. Space is now a critical domain for national security, compelling governments to rely on commercial entities for responsive and reliable access to orbit. Rocket Lab's Electron rocket, with over 40 launches and a 91% success rate, is ideally suited for the burgeoning small satellite market, vital for Earth observation and global communications. Its ongoing development of Neutron, a reusable medium-lift rocket, promises to further reduce costs and increase launch cadence, targeting the expansive market for mega-constellations and human spaceflight.
Rocket Lab's strategic acquisitions, such as SolAero and Sinclair Interplanetary, enhance its in-house manufacturing capabilities, allowing greater control over the entire space value chain. This vertical integration not only streamlines operations and reduces lead times but also establishes a significant barrier to entry for competitors. While facing stiff competition from industry giants like SpaceX and emerging players, Rocket Lab's diversified approach into higher-margin space systems and its proven reliability position it strongly. Its strategic partnerships further validate its technological prowess and operational excellence, ensuring a robust position in an increasingly competitive landscape. As the company explores new frontiers like on-orbit servicing and in-space manufacturing, Rocket Lab continues to demonstrate the strategic foresight necessary to thrive in the dynamic new space race.
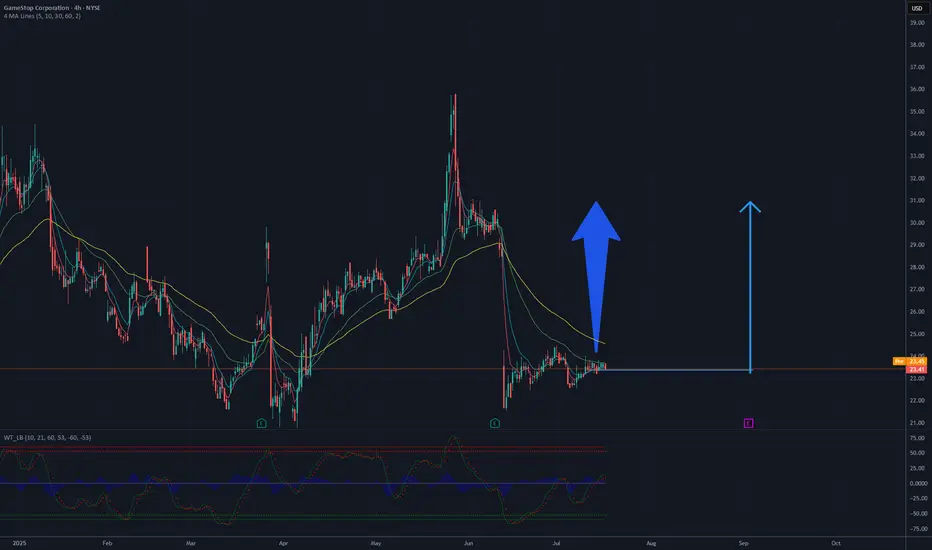
Is it a time for GAMESTOP? 30 $ in the sightAnalysis of the GameStop (GME) chart suggests a potential rise to 30 USD, based on current trends and technical levels. The 4-hour chart shows a recent decline following a sharp increase, with the price currently fluctuating around 23-24 USD. Key support is located at approximately 22 USD, which could act as a floor if the price starts to drop. The moving averages (e.g., 50-day and 200-day) indicate a previous upward trend, and current levels may represent a consolidation phase before the next upward move.
Breaking through resistance around 25-26 USD, which aligns with a previous peak, could pave the way for further growth. If demand increases and trading volume rises, the price could head toward 30 USD, a psychological and technical resistance level. Additional bullish signals, such as green candles or an increase in the oscillator (e.g., RSI) from current levels, could support this scenario. However, the risk of a sudden reversal should be monitored, especially if support at 22 USD is breached.
Potential TP: 30 USD
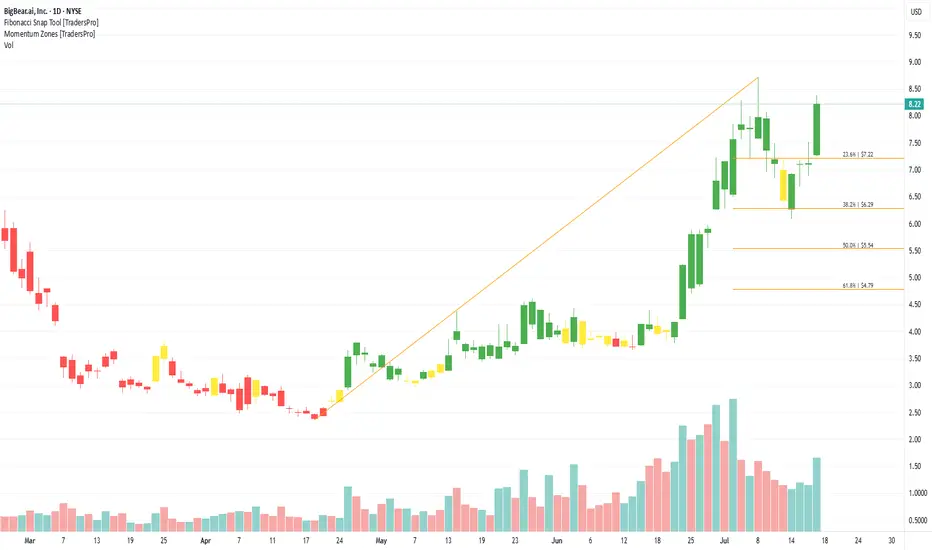
BigBear.ai, Inc. (BBAI) Powers AI-Driven DecisionsBigBear.ai, Inc. (BBAI) provides artificial intelligence-powered decision support solutions for defense, healthcare, logistics, and manufacturing. Its platform helps clients process complex data to make faster, smarter decisions using predictive analytics and machine learning. BigBear.ai’s growth is driven by rising demand for AI in mission-critical operations, growing defense tech budgets, and the need for data-driven insights across both government and commercial sectors.
On the chart, a confirmation bar with rising volume signals bullish momentum. The price has entered the momentum zone by breaking above the .236 Fibonacci level. A trailing stop can be placed just below that level using the Fibonacci snap tool to help protect gains while staying in the trend.