Mean Reversion Trade: PM1. RSI in oversold region
2. Price likely to rebound back the the mean
Trade Rules:
Entry Trigger - RSI has cross below oversold region, enter limit buy at close price
Exit Trigger - Close at market when close price cross above exit trigger (Red step line)

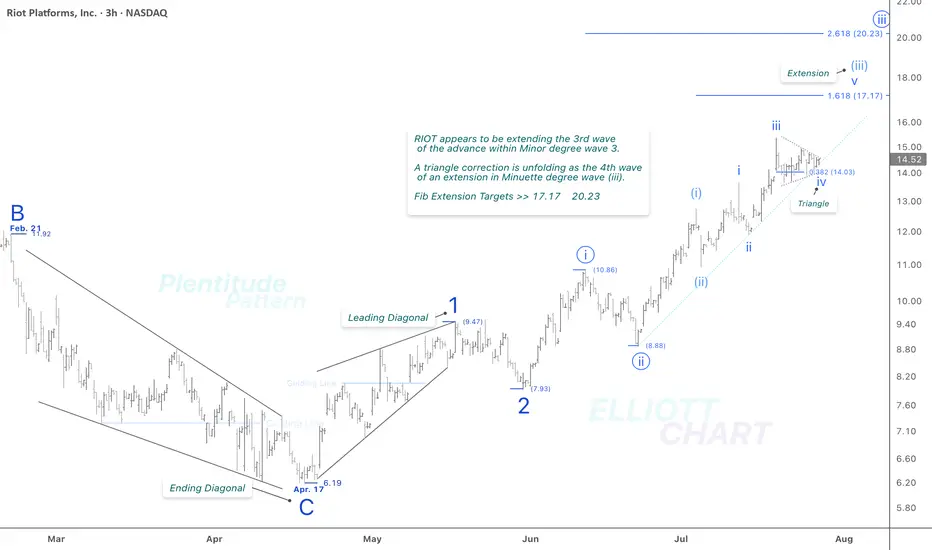
RIOT / 3hThere is no specific change in NASDAQ:RIOT 's previous analysis. As depicted on the 3h frame above, it appears to be extending the third wave of an impulsive advance within Minor degree wave 3. As anticipated, a triangle correction has emerged as the fourth wave within the ongoing extension of the Minuette wave (iii).
The Fibonacci extension levels of 17.17 and 20.23 remain valid and continue to align with the current wave structure.
>>> In this timeframe, I'm analyzing the initial rising tide within the ongoing Intermediate degree wave (1), where a nested series of waves have quite well revealed: 1, 2 → i (circled), ii (circled) → (i), (ii) → i, ii. The extreme high of this impulsive sequence lies beyond the visible range of the current chart.
NASDAQ:RIOT CRYPTOCAP:BTC BITSTAMP:BTCUSD MARKETSCOM:BITCOIN
#CryptoStocks #RIOT #BTCMining #Bitcoin #BTC
ETOR: Buying entry zoneETOR: Buying entry zone
.
Less supply volume at the bottom, successful shakeout and backtest.
Wait for a next move up ahead!
.
US STOCKS- WALL STREET DREAM- LET'S THE MARKET SPEAK!

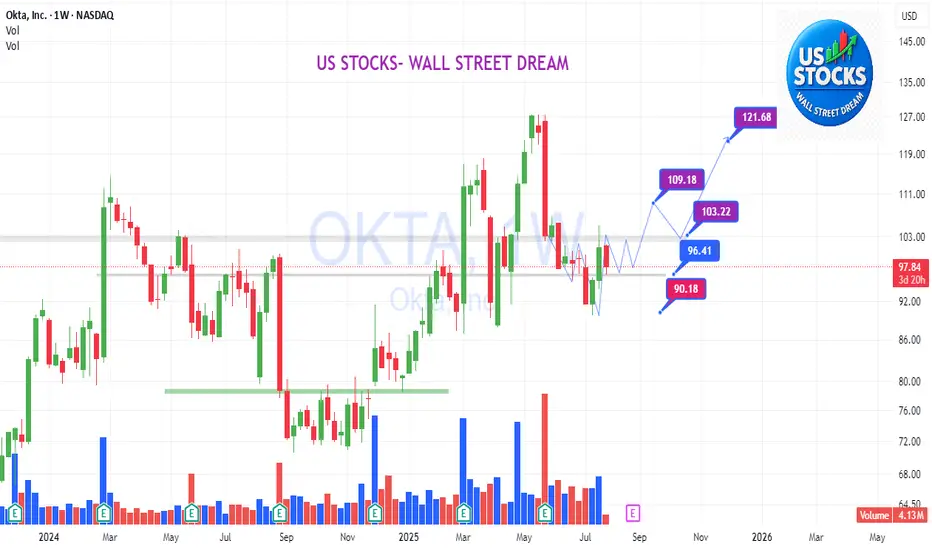
OKTA: swinging on accumulation range, shakeout confirmationOKTA:
.
Swinging on accumulation range, shakeout confirmation.
Inversed HnS pattern is being formed and confirmed.
Wait for next swing movements on right shoulder, before a jump.
.
US STOCKS- WALL STREET DREAM- LET'S THE MARKET SPEAK!
PharmAla Biotech Getting Very Tight, powerful break is imminentMDMA PharmAla Biotech Getting Very Tight, break is imminent. I have a bullish lean on this given the bullish tailwinds in the sector, the ramping up of bull volume on the weekly chart, and the lower wicks that look like accumulation to me on the monthly timeframe
I post regular analysis of the psychedelics sector, please like and follow to make sure you don't miss my next update!
Support: 0.090, 0.085
Resistance: 0.110, 0.115

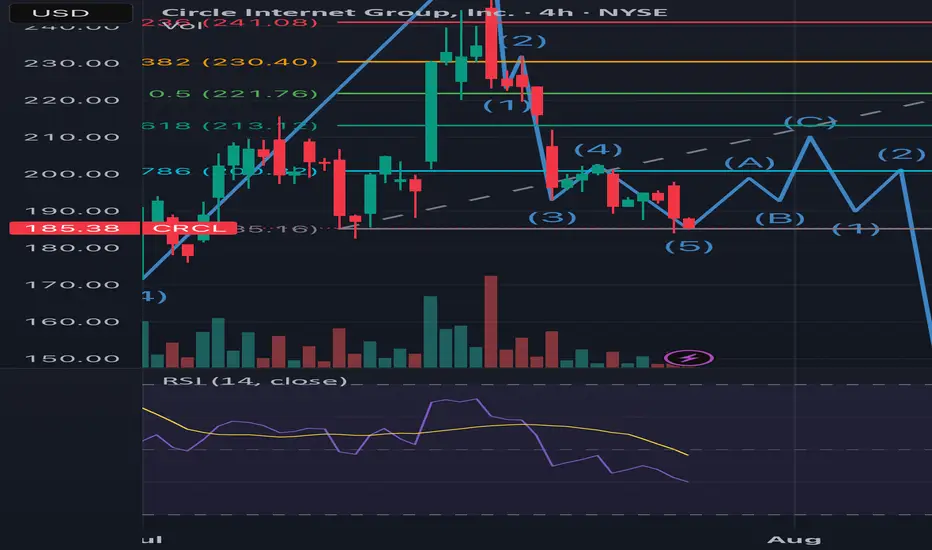
What goes around comes full CRCLFor the record, I bought in at ~$220 and looking to exit to ethical reasons. I believe that this stock will reach over $400USD for the end of the year but with every l opportunity left off for a greater cause, there will always be a greater reward.
1. Notice the end of the first 5 wave Elliot Impulse coincides with the passing of the GENIUS bill. Wave 3 peak was the ATH and wave 5 was the Friday peak of around $262.
2. We’ve entered the correction where sellers are looking to close from the hype
Wave 1 of the correction was the sell off from the wave 5 peak.
From the chart you can see the 3 wave correction is beginning with wave 1 of the 3 coming to an end.
Good news if you want to swing it to 213, this would be a good entry. Bad news if you want ito t hold it for ATH as it means you’d have to bear the third wave of the correction phase (gap fill ~$216), from there I’m expecting the huge sell off post earnings and FED expectations.
However, after retracing a new cycle will emerge led by major catalysts like the CLARITY Bill, CIRCLE’s bank charter application, USDT diminishing presence in the US and the adoption of USDC even possibly making it the standard stablecoin for all US crypto activity, DE-Fi growth and tradfi participation and growth in their MMF and remittance segments. This will kick start a new run where the highs of $400 will be achieved.
So target next high (earnings time) is $213. I assume price will not go below this region. But a recommended sell until q4
CYBN clearly the sector laggardCYBN is trading very differently from the rest of the sector which as significant bullish momentum which CYBN is the same price it was 7 weeks ago
I post regular analysis of the psychedelics sector, please like and follow to make sure you don't miss my next update!
Support: 7.74, 7.67, 7.55
Resistance: 7.99, 8.07, 8.18

CMPS potential daily bullflag setting upCMPS very healthy sideways consolidation after 100% bounce from the lows. 4hr downtrend is our guide and lower lows aren't seeing much followthrough, giving clues there may be a daily bullflag pattern shaping up. EARNINGS THIS WEEK!
I post regular analysis of the psychedelics sector, please like and follow to make sure you don't miss my next update!
Support: 4.25, 4.09, 3.83
Resistance: 4.41, 4.53, 4.68

MNMD healthy sideways consolidationNASDAQ:MNMD very healthy sideways consolidation after a 54% surge over the last 4 weeks. 4hr downtrend is our guide and lower lows aren't seeing much followthrough, giving clues there may be a daily bullflag pattern shaping up. EARNINGS THIS WEEK!
Support: 9.53, 9.37
Resistance: 9.79, 9.82, 10.09
I post regular analysis of the psychedelics sector, please like and follow to make sure you don't miss my next update!

ATAI bulls buy the dip on increasing bull volumeClose above daily EMA12, bulls aggressively bought the top above $3, the same price the sellers were stepping in over the last two weeks, speaking to demand outweighing supply at the present time. Bounce continuation is key into tomorrow as bulls want to create enough space to form a higher low above today's low 3.08 which is our most important short term support.
Support: 3.25, 3.20, 3.10, 3.08, 3.06
Resistance: 3.37, 3.48, 3.72, 4.00

WULF / 3hNASDAQ:WULF traded sideways today, as expected, with no significant change to the broader outlook. The ongoing consolidation continues to support the current wave structure—specifically, a developing triangle in wave iv (circled), which may be forming ahead of the anticipated final advance in wave v (circled).
The Fibonacci extension target >> 6.93 remains valid.
Trend Analysis >> Upon completion of Minor degree wave C, the countertrend advance of Intermediate degree wave (B), which has been unfolding since April 9, is likely to give way to a decline in wave (C) of the same degree. This downtrend might begin in the coming days and potentially extend through the end of the year!!
NASDAQ:WULF CRYPTOCAP:BTC BITSTAMP:BTCUSD MARKETSCOM:BITCOIN
#CryptoStocks #WULF #BTCMining #Bitcoin #BTC

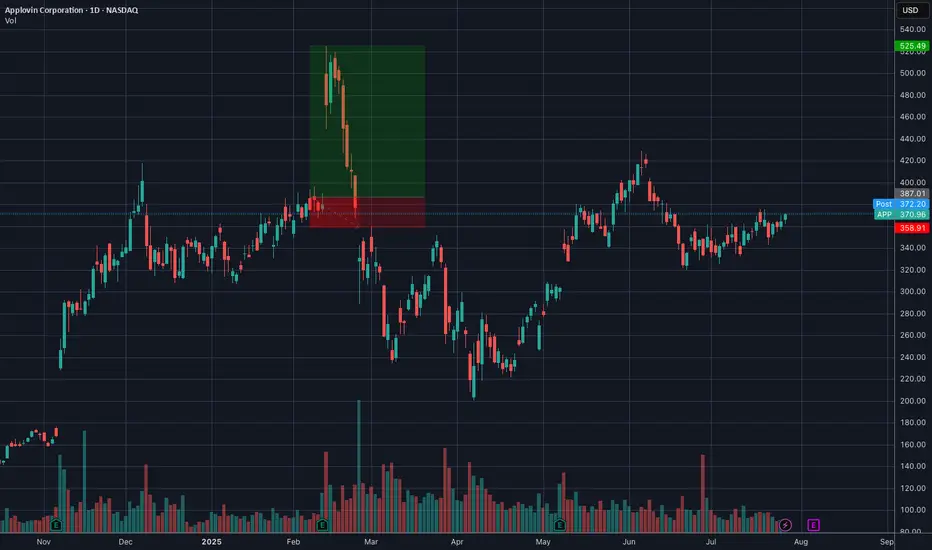
Buy Idea APP (Applovin Corp)Entry: $371 - 372
Stop: $342.50
Risk per share: $28.80
Earnings Catalyst Setup
• Flat base breakout above $370 zone, strong price structure
• Volume expanding into earnings — ideal for pre-earnings momentum pop
• Holding all major MAs: 21EMA, 50MA, 200MA clustered below
• MACD & Oscillators turning up, showing early momentum shift
• Institutional positioning appears supportive
• Earnings Date: ~9 days (6 Aug 2025 after mkt)
⚠️ Key Notes
• Pre-earnings breakout pattern, keep size light
• Possible re-rating if earnings surprise positively — watch for revenue growth in AI/game ads
• Sell partial above 1R to de-risk, trail rest
DISCLAIMER : The content and materials featured are for your information and education only and are not attended to address your particular personal requirements. The information does not constitute financial advice or recommendation and should not be considered as such. Risk Management is Your Shield! Always prioritise risk management. It’s your best defence against losses.
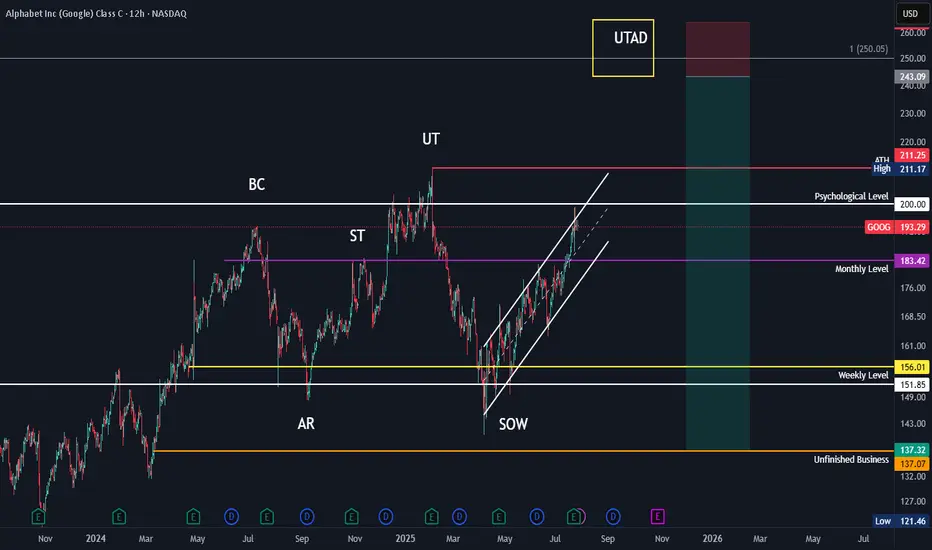
Google HTF Swing Short Wyoff Distribution PatternBased off HTF Wykoff Distribution Pattern. Overall target top 250ish Based off fibtrend/extensions. Followed by a ABC corrective pattern to play out over several months.
CLSK / 3hNASDAQ:CLSK has been trading with a slight upward bias ahead of a potentially final advance, projected to gain approximately 25% with a target near $15.00.
Wave Analysis >> As illustrated in the 3h-frame above, Minor wave C—completing the corrective upward move of wave (B)—appears to be unfolding as an ending diagonal, now likely in its final stages. Within this structure, the Minute wave iv (circled) has formed a correction. A final push higher in Minute wave v (circled) is now expected, which would complete the ending diagonal pattern of wave C, and in turn, conclude the countertrend advance of wave (B).
Trend Analysis >> Upon completion of the potential ending diagonal in Minor wave C, the broader trend is anticipated to reverse to the downside, initiating the final decline in Intermediate wave (C). This bearish phase may extend through the remainder of the year.
#CryptoStocks #CLSK #BTCMining #Bitcoin #BTC
NASDAQ:CLSK CRYPTOCAP:BTC BITSTAMP:BTCUSD MARKETSCOM:BITCOIN

Dollar General | DG | Long at $90.00Dollar General NYSE:DG took a massive hit this morning after revising their future earnings guidance. The economy is showing many signs of a recession, and this is a clear warning. From a technical analysis perspective, it has retouched my "crash" simple moving average and may dip further into the $80's in the near-term. But, like many overall strong companies that suddenly plummet, I view this as a future opportunity given the strength of NYSE:DG as a business (holistically). Dollar General is the only grocery and home goods store around in many rural locations. So, while there is doom and gloom in the near-term, Dollar General is in a personal buy zone at $90.00. I view this as a starter position, though, with the potential for future declines/opportunities for additional share accumulation in the near-term.
Target #1 = $100.00
Target #2 = $122.00
Target #3 = $200.00+ (very-long term outlook...)

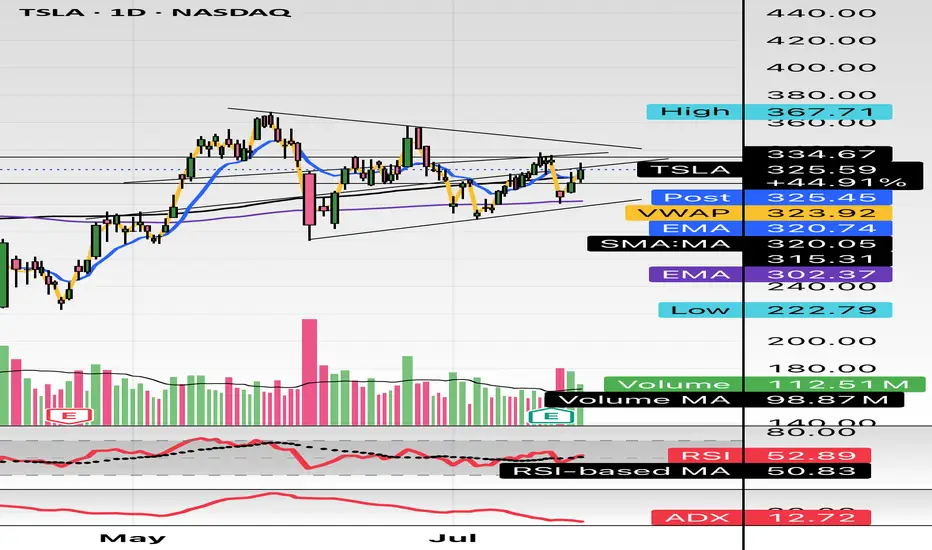
$TSLA either one big flag or massive short setting upHello,
Just some browsing, NASDAQ:TSLA hasn’t had any major moves prior to early May - June IMO. This is on my watch for a short swing setup. This is bull flagging but I see a short here. I’m conflicted. I do see the higher low but we are in a pitchfork and this has been consolidating in this $290-$340 area for about a month and half. There’s also a lower high. Just posting for some free dialogue and open ideas. Talk to me. Let me know what you see and think. We aren’t too far from 200EMA and 200SMA. It’s just curling above the 50 as well. Maybe we consolidate for another week or two? A massive move is brewing here I think. I’m talking $100 in a week up or down soon.
WSL
GE Healthcare Technology | GEHC | Long at $62.25GE Healthcare Technology $NASDAQ:GEHC. An aging and unhealthy population will only create an increased need for healthcare imaging services. Add AI to the diagnostic mix, and imaging will be imperative for routine health maintenance and screening. With a P/E of 15x, debt-to equity of 1x, earnings forecast growth of 8.36% per year, and bullish analyst ratings, this could be a good value play for the patient.
Thus, at $62.25, NASDAQ:GEHC is in a personal buy zone. Further drops are possible if trade wars make imaging materials/technology difficult to obtain, but that general statement applies to the whole market at this time...
Targets:
$70.00
$78.00

BearishI have a feeling that Micron's gonna retest $109 or blow through it and run for the 200 moving average. Waiting to see a bullish divergence in the RSI, or for it to get out of this little downtrend it's forming

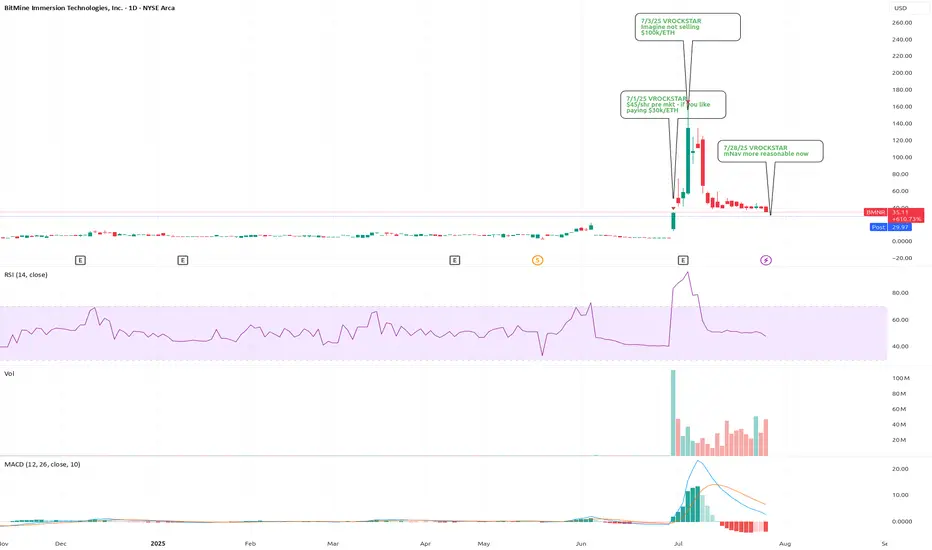
7/28/25 - $bmnr - mNav more reasonable now (1.3x at ~$30/shr)7/28/25 :: VROCKSTAR :: AMEX:BMNR
mNav more reasonable now (1.3x at ~$30/shr)
- i'd link the docs but tradingview wants you to do the digging and doesn't want me to "promote" doing your own DD. ironic.
- so here's how you get there
- go the sec dot gov website search edgar in google
- type in the ticker
- check out the latest 8K
- click presentation
- slide 30 shows "BMNR NAV Detail"
- about 23 bucks per share NAV on fully diluted shares
- AH this thing trading at $30 ish... so 1.3x mnav
- considering view that ETH becoming a captured/ "knighted" winner by the tradfi gremlins, $10k/eth or higher not unlikely this cycle
- this type of "ROE" on a Kc of probably 10-15% means a 3..4...5x mNAV at cycle top not unreasonabl
- so if ETH declines here 50% (also reasonable to expect the worst, you're at $10-15/shr assuming mnav toward 1)... and then a say 2x mnav on $10k/eth would mean shares (considering no additional moves/ accretion from here - also unlikely and conservative) would mean a 4x on the current share px so conservatively that's $100 again.
- does it get to ATH?
- honestly the way that euphoria trades if we make a run for $100... probably yeah moar ATH, but that's unlikely to happen ST unless ETH has a monster run (and it already has)
- nevertheless... i'm finally (VERY) slowly adding this to my exposure, which for me means 50 bps at the AH px of $30.
V
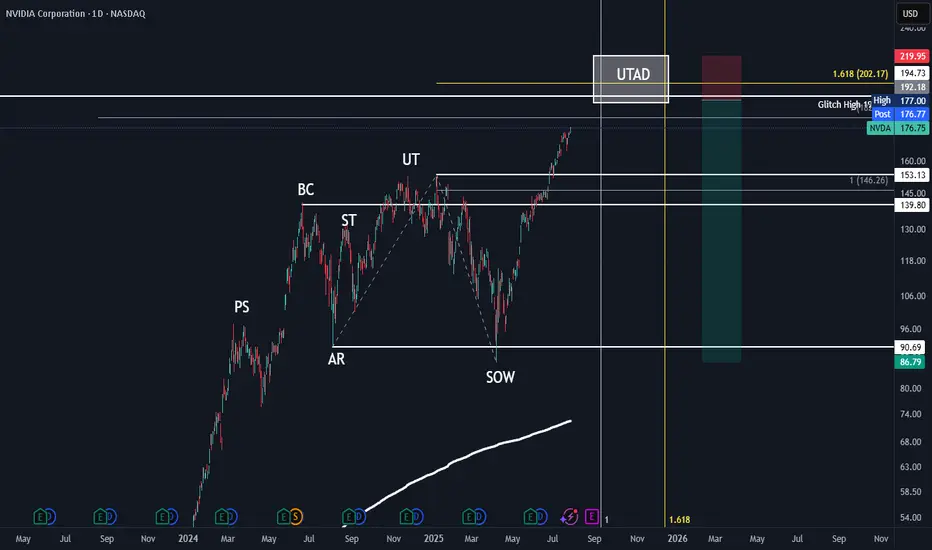
Nvidia HTF Wykoff Distribution PatternHTF Wykoff Distribution pattern in confluence with HTF fib trend/extension and fibonnacci time.
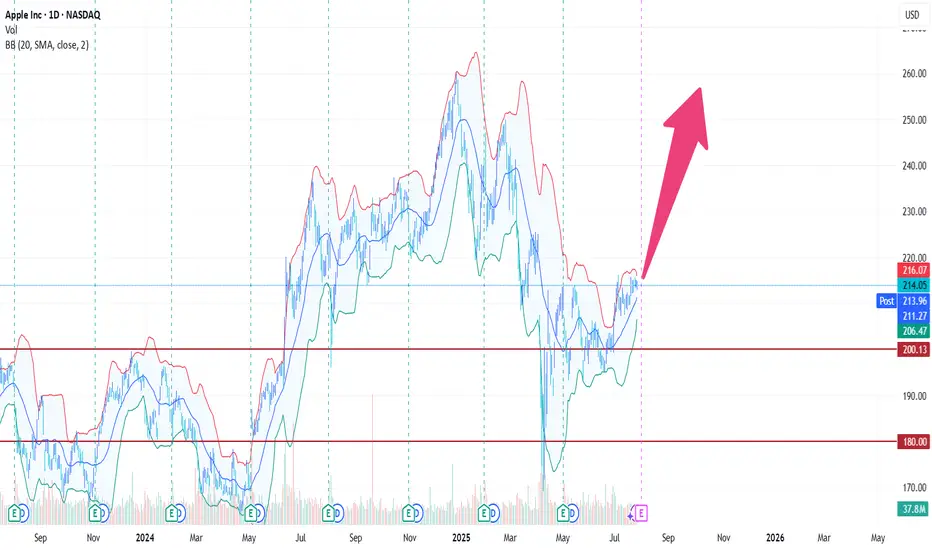
AAPL - A potential earnings rallyDoes not mean it has to straight up jump after earnings it also can shortly go into the opposite direction but the main direction is up for the moment
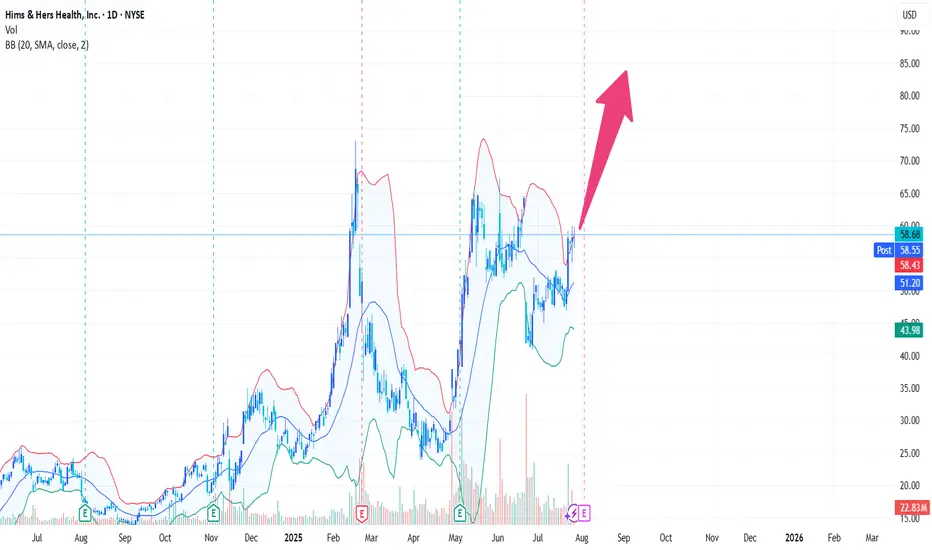
HIMS - 3rd times a charm!A really nice company with lots of growth potential, stock is used as playball for scalpers at this moment that turns down many big investors, but the less volatile it gets the more it will pump because it gets more attractive for bigger investors.
AMD Wave Analysis – 28 July 2025
- AMD broke resistance zone
- Likely to rise to resistance level 185.95
AMD recently broke the resistance zone between the resistance level 166.75 and the upper resistance trendline of the daily up channel from April.
The breakout of this resistance zone accelerated the active impulse waves 3 and (3).
Given the overriding daily uptrend, AMD can be expected to rise to the next resistance level 185.95 (former multi-month high from July of 2024).
