ZUARI | Buy @273 | Strict SL below 241 | Target 363Disclaimer:
This is not financial advice. Please do your own research or consult with a financial advisor before making any investment decisions. Investments in stocks can be risky and may result in loss of capital.

Premier Energies Ltd-PREMIERENEKeep on radar, Trading above 50EMA, RSI is shifting in upward direction, Keep a buy around 1080
Potential points can be earned 30, 50, 100... Within few weeks!

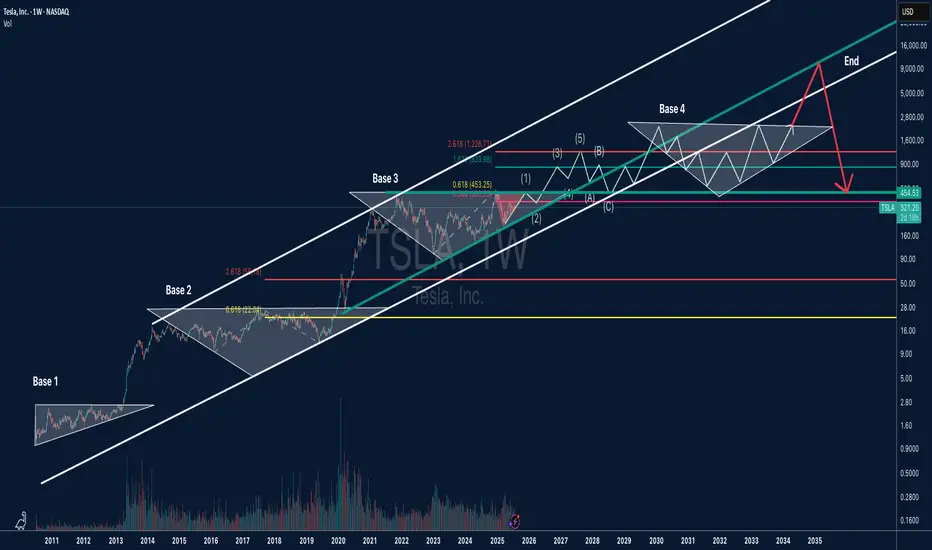
TSLA Long-Term Bold Projection (2025-2035)This is a long-term analysis of Tesla (TSLA) stock on the weekly timeframe, combining Elliott Wave Theory, Fibonacci extensions, and price structure (base formations) within a broad logarithmic trend channel.
Key Highlights:
🔹 Base Formations:
Base 1 (2010–2013): First consolidation before TSLA’s breakout.
Base 2 (2014–2019): A wide triangle structure leading to explosive growth.
Base 3 (2021–2024): Ongoing range suggesting wave (2) correction.
Base 4 (2026–2032): Projected future range before a possible euphoric blow-off phase.
🔹 Elliott Wave Structure:
Current wave count suggests TSLA is finishing wave (2) of a larger 5-wave structure.
Bullish impulse expected with wave (3), (4), and (5) leading to new ATHs, potentially into the $8,000–$10,000+ range.
A corrective ABC phase may follow, bringing price back toward key support (~$450 zone), aligned with Fibonacci retracements and channel support.
🔹 Fibonacci Levels:
0.618 and 2.618 extensions align with historical breakout points and future resistance zones.
Long-term projection targets include $1,226, $4,400, and potentially $8,000+, with eventual reversion to the mean.
🔹 Log Channel:
Price has respected a long-term ascending channel.
Midline and upper resistance bands guide potential future resistance zones.
$AI they sleep, i eat. Quiet danger..Hello,
Name has been on my watch for a week or so now, finally just sitting back and getting to a multi analytical chart.
To begin: Yes, I see the head and shoulders pattern forming, scary, I know. Aside from that just zoom out, this name has traded in this range for 1,200 days... the range of $20 to $30 with some bumps in the $40's and low $20's with taps in the teens. This name is quiet, not a loud player like other AI tickers. Something smells fun here. I'm going to be gearing in some $40 calls for 2026. I may risk 20% of my port here. I feel confident in this one, I do. The name is holding good support in the low $20 range and there are a lot more green candles than red. I know other names are getting more attractive like BBAI, you still have SMCI, CRWV, NVDA and so forth, which is fine, means nothing. This was a meme name type of stock about a year ago. I believe this will go on a run towards $50. If you have patience, $50 calls for 2027 would be appropriate and at a fair price for a swing and a possible short squeeze. For those who want to play the shorter term volatility $40 calls for Jan. 2026.
Good luck.
WSL.

$AFRM - Stock forming a triangle pattern on the daily time frameAFRM - Stock forming an triangle pattern on the daily time frame. Possible breaking out on both side possible. looking for puts below $66.50 and calls above $69. on high watch here.

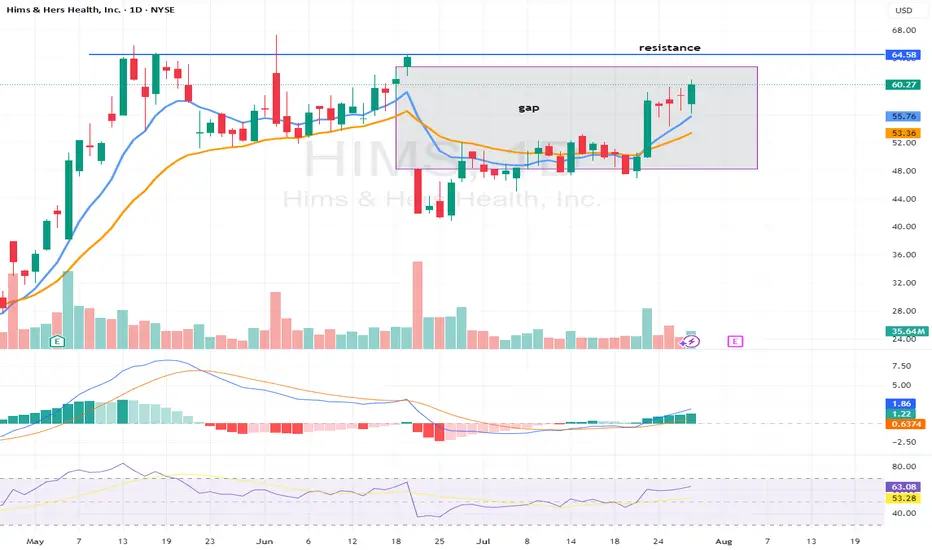
$HIMS - stock going for gap fill plus key resistance level. HIMS - Stock on the way to gap fill to $62.96. calls added in the group. Stock has been failing to hold after breaking $65 level. ON high watch if that level breaks for a move to the upside. Company to report earnings next week. Could see a move towards $65 pre earnings.
KSCP: Seek opportunities in the crowd's fearNASDAQ:KSCP
🌾🌾🌾
While the majority are fearful and busy searching for reasons why the market is dropping or correcting, the group keeps diligently searching for and sharing opportunities 🥰.
⚡️⚡️⚡️
US STOCKS- WALL STREET DREAM- LET'S THE MARKET SPEAK!

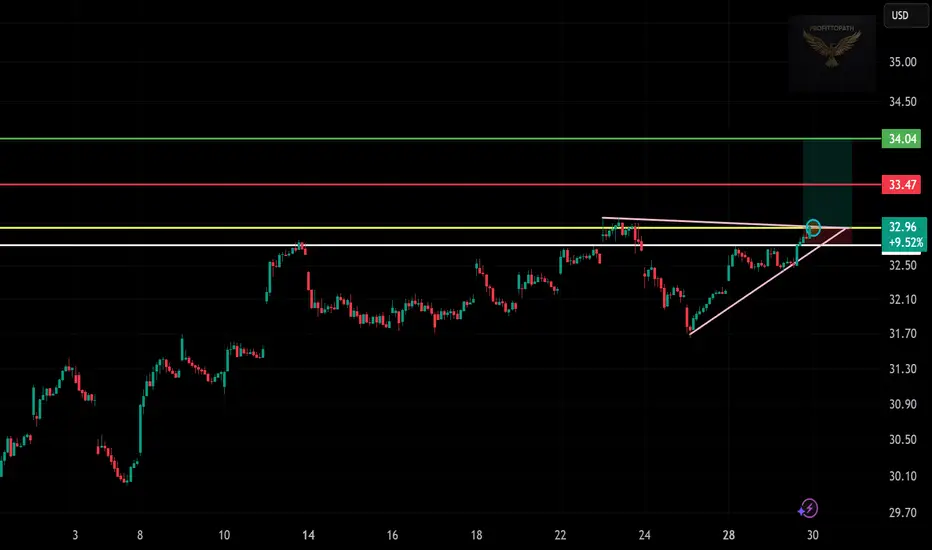
BP Breakout in Motion! – Triangle Sends a Signal”
📈 Trade Snapshot:
BP breaks above resistance with rising volume, forming higher lows on a clean ascending triangle. Breakout above $32.96 opens the door toward $34.04.
🎯 Setup Details:
→ Entry: $32.96
→ SL: ~$32.30
→ Target: $34.04
→ Resistance to clear: $33.47
📌 Pattern strength + structure breakout = potential momentum run.
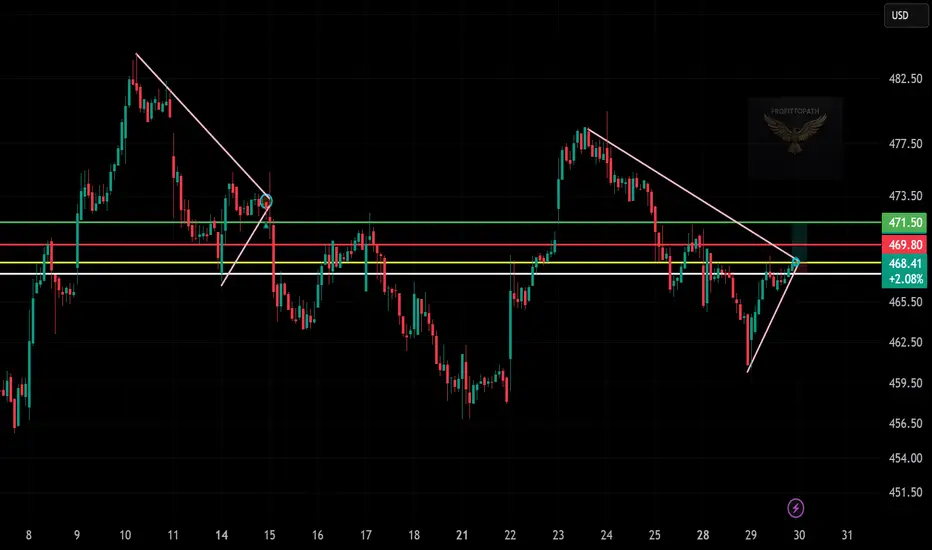
VRTX is pressing against trendline resistance after clean higher lows. A breakout above $469.80 could fuel a move toward $471.50.
🎯 Plan:
→ Entry: $468.41
→ SL: Below $466
→ Target: $471.50
⚠️ Wait for confirmation above structure.
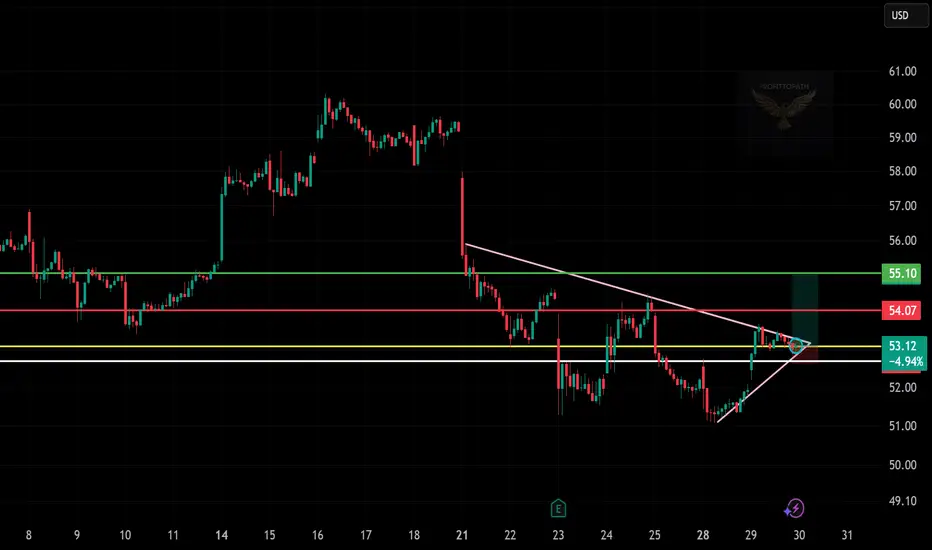
EQT Breakout Watch!📈
Triangle pattern tightening.
Entry: $53.10 | SL: ~$52.00 | Target: $55.10
Break above $54.07 = momentum shift.
Let price confirm, then strike. 🧠🎯
NH SWING TRADE IDEA (2025-07-29)
### 🩻 UNH SWING TRADE IDEA (2025-07-29)
**UnitedHealth Group – Bearish Setup**
📉 **Sentiment:** Moderately Bearish
📊 **Daily RSI:** 28.9 (Oversold!)
📉 **Momentum:** 5D/10D bearish
🔇 **Volume:** Weak (1.0x avg = low conviction)
💬 **Options Flow:** Neutral (C/P = 1.00)
🌬️ **VIX:** 15.71 — calm, tradable
---
### 🔻 Trade Setup
* **Play Type:** Naked PUT
* **Strike:** \$240.00
* **Expiry:** 2025-08-15
* **Entry:** \$0.85
* **Target:** \$1.35
* **Stop:** \$0.60
* **Risk Size:** 1 contract
* **Entry Timing:** Market Open
* **Confidence:** 75% 📉
---
### 🤖 Model Consensus (5 Models)
✅ All agree: **Bearish RSI + Downward Momentum**
⚠️ Disagree on *strength* of the trend: moderate vs strong
💡 Models: Claude, Grok, Gemini, LLaMA, DeepSeek
---
### ⚠️ Key Risks
* Neutral options flow = no crowd confirmation
* Weak volume = price may stall or fake out
* Watch for VIX spikes — could flip sentiment fast
---
### 🔎 Summary for Swing Traders
**UNH \$240P → \$0.85 → \$1.35**
🧠 RSI confirms downside
⛔ Low volume = trade light, manage risk
📅 Target expiry: Aug 15
🧲 Key level: \$247.13 — if broken, ride lower

MU WEEKLY TRADE IDEA (2025-07-29)
### 🚀 MU WEEKLY TRADE IDEA (2025-07-29)
**Micron Technology (MU) – Bullish Call Play**
🔹 **Sentiment:** Moderate Bullish
🔹 **C/P Ratio:** 2.91 (Bullish Flow)
🔹 **RSI (Weekly):** 53.6 📈
🔹 **Volume:** Weak (⚠️ caution — low conviction)
---
### 🎯 Trade Setup
* **Strike:** \$116.00
* **Type:** CALL (LONG)
* **Expiry:** 2025-08-01
* **Entry:** \$0.62
* **Target:** \$0.89
* **Stop:** \$0.31
* **Risk:** 2–4% of account
* **Confidence:** 65% 🧠
* **Entry Timing:** Market Open
---
### 🤖 Multi-Model Consensus
5 AI Engines Agree:
✅ Buy \$114–\$116 Calls
🧠 Models: Grok, Gemini, Claude, Llama, DeepSeek
📉 Main Risk: Weak volume divergence despite strong options flow
---
### ⚠️ Key Notes
* 📊 Institutional call buying ✅
* ⚠️ Low volume = reduced confirmation
* 🎯 Play is short-dated — gamma spikes expected
* 💥 Manage exits actively near target zones
---
### 🧠 Quick Recap (for speed-readers)
**MU 116C ➜ \$0.62 → \$0.89**
💥 Weekly flow supports upside
⚠️ Volume = weak, but RSI rising
⏱️ Hold short-term with stops

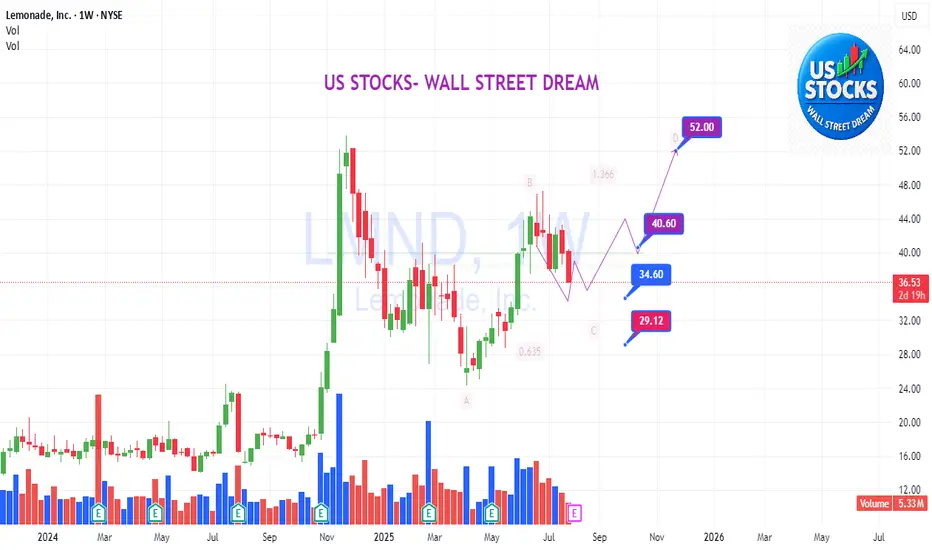
LMND: Catching the dip!LMND
.
Catching the dip!
✨✨✨
In fact, good entry points are usually either boring or when the crowd is fearful — not when everyone is excited and FOMO-ing.
🌺🌺🌺
US STOCKS- WALL STREET DREAM- LET'S THE MARKET SPEAK!
HIMS WEEKLY TRADE IDEA (7/29/25)*
**💊 HIMS WEEKLY TRADE IDEA (7/29/25)**
**🔥 Bullish Flow + Rising RSI + Institutional Volume**
**📈 Trade Setup**
• **Stock**: \ NYSE:HIMS
• **Direction**: CALL (LONG)
• **Strike**: \$64.00
• **Entry**: \$0.92
• **Target**: \$1.38
• **Stop**: \$0.46
• **Size**: 2 contracts
• **Expiry**: Aug 1, 2025 (3DTE)
• **Confidence**: 80%
• **Entry Timing**: Market Open
---
**🧠 Why This Trade?**
✅ **Call/Put Ratio = 1.37** → Bullish sentiment
✅ **RSI Daily: 65.2 / Weekly: 61.3** → Momentum building
✅ **1.8x Weekly Volume Surge** → Institutional accumulation
✅ **\$64C OI = 2,616** → High liquidity + interest
⚠️ **Gamma Risk + Fast Decay** → Time-sensitive play
---
**🎯 Strategy**
→ Play the momentum spike into expiry
→ Exit quickly on profit target or 50% stop
**#OptionsTrading #HIMS #SwingTrade #EarningsPlay #TradingViewSetup #FlowTrade**

Swing & Positional Trading and Stock Options Setup _ High Beta✅ Final Setup for Positional and Swing Trades (High Beta Liquid Stocks for Cash and Options)
This trading guide outlines a simple and effective setup for both positional and swing trades, focused on high beta, highly liquid stocks. Follow the rules strictly for better consistency and profitability.
🔹 Positional Trade Setup
Chart Setup:
• Open the Monthly Chart of the stock.
• Add the RSI (Relative Strength Index) indicator.
• Uncheck all levels (30, 50, 70) and only keep one level at 60.
• Edit the level from 70 to 60 and highlight it in green.
Entry Criteria:
• Stock must cross the 60 RSI level on the monthly chart.
• Entry is only triggered if the price breaks the previous month's high.
Stop Loss:
• Place the initial stop loss below the previous month's low.
Trailing Stop Loss:
• Trail the stop loss to the current month’s low, but only after the monthly candle closes.
• Continue trailing the stop loss every month using this method until exit.
Exit Rule:
• Exit the positional trade only if the current month’s candle closes below the previous month’s low.
⚡ Note: The RSI 60+ setup is a powerful momentum strategy with high reward probability.
🔹 Swing Trade Setup
Precondition:
• Monthly RSI must cross above the 60 level.
• Switch to the Daily Chart of the stock.
• Entry Criteria:
• Identify the current swing high on the daily chart.
• Entry is triggered only when the stock breaks the swing high.
Stop Loss:
• Place the stop loss below the current swing low.
• If unsure how to mark swing low, then use a daily close below RSI 60 as your stop.
Trailing Stop Loss:
• If the trade moves in your favor, trail the stop loss to each day’s low.
Exit Rule:
• Exit the swing trade only if RSI crosses back below 60 with a daily candle close.
🔥 Stock Options Trading Strategy – Built on Core Swing/Positional Principles (75% Win Rate Setup)
I’m now sharing a Stock Options Trading Concept that follows the same core principles but is tailored specifically for liquid stock options.
For this strategy, you will strictly focus only on those High Beta Liquid Stocks provided below-
✅ Strategy Setup
🔹 Timeframe Filters:
• Monthly RSI > 60 (RSI has crossed and is holding above 60)
• Weekly RSI > 60 (same condition as above)
• Daily RSI: RSI must be crossing 60 or on the verge of crossing
Now, on the Daily Chart, mark the current swing high and swing low.
📌 Two Entry Approaches:
Approach 1: Breakout Entry
• Entry: When swing high is broken.
• Stop Loss (SL): Swing low or previous week’s low.
Approach 2: Pullback Entry
• Wait for a retracement from swing high (should not exceed 50% retracement).
• Confirmation of pullback weakness: Volume bars should be shrinking/decreasing.
• Entry: On breakout of the last candle high of the pullback.
• Stop Loss: Swing low or previous week’s low.
Once in the trade, trail your stop loss to cost after 3 consecutive bullish candles.
📤 Exit Rules
• Exit the Stock Options position only if the Daily RSI closses below 60 level.
⚠️ Important Guidelines for Stock Options
• 💡 Trade with only 1 lot. Never exceed your lot size.
• 📅 Enter after 2 days of the monthly expiry and exit before 2 days of next monthly expiry to avoid smart money manipulation.
• 🎯 Choose strike prices in multiples of 25, 50, 75, or 100 for better liquidity.
Example: If stock is at 1564, choose 1550 ITM or 1575 ATM.
• ⏱️ For quick exits, always place exit orders at round numbers like 5 or 10 levels.
• Example: If you entered at ₹70 and the option is at ₹144, place an exit at ₹140 or ₹145—not any random price.
For PE buying-
Monthly RSI < 40
Weekly RSI < 40
Daily RSi crossing 40 or below
Same process for PE with 2 approach as you like but in reverse form.
📊 75 High-Beta, Highly Liquid NSE Stocks
These stocks are liquid, fundamentally strong, and mostly traded in the F&O segment — giving you both flexibility and depth.
🚗 Auto
• Bajaj Auto
• Bosch Ltd
• Eicher Motors
• Hero Motocorp
• Maruti Suzuki
• TVS Motors
• Tata Motors
🏦 Banking & Financial Services
• Bank of Baroda
• Kotak Mahindra Bank
• Axis Bank
• ICICI Bank
• HDFC Bank
• IndusInd Bank
• Bajaj Finserv
• Bajaj Finance
• SBI
🧪 Chemicals
• Aarti Industries
• Atul Ltd
• Navin Fluorine
• UPL
• Tata Chemicals
🍫 FMCG
• Britannia Industries
• Godrej Consumer
• Tata Consumer
• DMart
• Hindustan Unilever
• Dabur
💊 Pharma & Healthcare
• Apollo Hospitals
• Alkem Labs
• Biocon
• Divis Labs
• Dr. Reddy’s
• IPCA Labs
• Laurus Labs
• Lupin
• Aurobindo Pharma
• Sun Pharma
• Cipla
💻 IT Sector
• HCL Technologies
• Infosys
• LTIMindtree
• TCS
• Tech Mahindra
• Wipro
⛓️ Steel & Metals
• APL Apollo Tubes
• JSW Steel
• Jindal Steel
• Tata Steel
• Hindalco
• L&T
🛢️ Oil & Gas
• Reliance Industries
• Gujarat Gas
• Indraprastha Gas (IGL)
• Mahanagar Gas (MGL)
• Tata Power
🏢 Realty
• DLF Ltd
• Godrej Properties
• Lodha (Macrotech Developers)
• Oberoi Realty
• Phoenix Mills
🛋️ Durables & Others
• Sona BLW (Sona Comstar)
• Amber Enterprises
• Bata India
• Crompton Greaves
• Dixon Technologies
• Titan Company
• ACC Cement
• Ambuja Cement
• Ultratech Cement
• Voltas Ltd
• Polycab India
• Mazagon Dock (Mazdock)
• Asian Paints
• Berger Paints
📝 Final Thoughts
This is not just a strategy — it’s a framework to reprogram your trading mindset. Use higher timeframes, respect structure, and focus only on high-probability setups. You’re not here for noise. You’re here for moves that matter.
If this helped you, prepare a trading journal based on this strategy. Stay focused. Be consistent. Trade less, but trade right.
Midcap and Small cap stocks are only used for Positional Trading Long Setup for longer periods ex 6 months to a year.
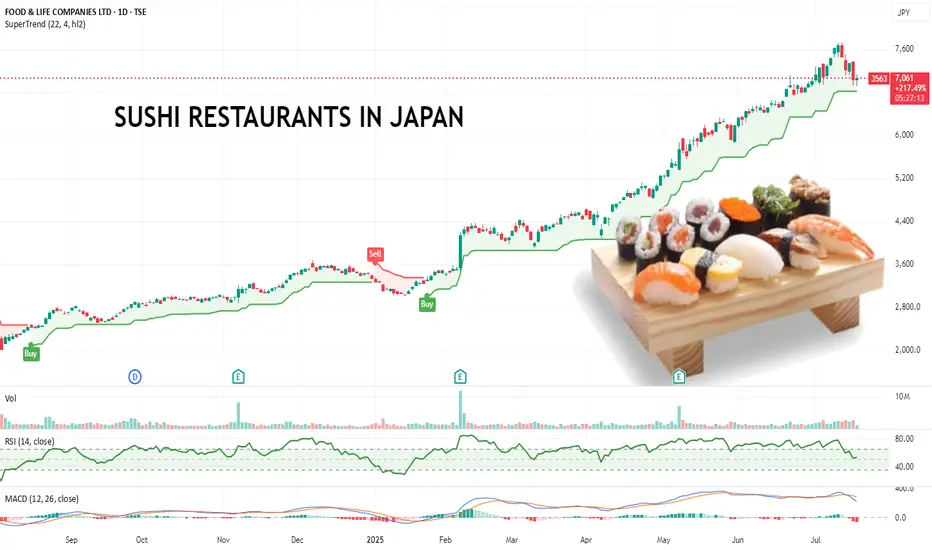
Pullback Over? This Japanese Sushi Chain Might Be Running Again.Food & Life Companies runs a major chain of sushi restaurants and is listed on the Tokyo Stock Exchange under the code 3563.TSE
From July 2025, I’ve started focusing more on scanning for high-momentum stocks globally, regardless of exchange. This one caught my eye with a clean, steady uptrend and a strong 200% move over the past year with minimal deep pullbacks.
It recently dipped, found support, and looks like it’s picking up again. That kind of price action gives a clear structure for managing risk if it rolls over. Makes it easy to identify where to put a stop loss to manage risk.
Also worth noting they’re aggressively expanding into Southeast Asia and beyond, which could help sustain the growth story.
Also. I like sushi. Wonder if there is a kebab stock...
Anyway, might be worth a watch.
Is Novo Nordisk a buy? Novo Nordisk $NYSE: NVO plummets 22% on July 29, wiping out $57.5B in market value!
Here's what's happening and how I see it.
Here’s the breakdown on why the stock hit its lowest since Nov 2022:
Slashed 2025 Guidance: Sales growth cut to 8–14% from 13–21%, operating profit to 10–16% from 16–24%. Weak U.S. demand for Wegovy & Ozempic, plus competition from cheaper compounded GLP-1 drugs (i.e. grey market), cited as key issues.
CEO Shake-Up: Lars Fruergaard Jørgensen out, Maziar Doustdar in as CEO effective Aug 7. Investors worry Doustdar’s limited U.S. experience could hurt Novo’s edge in its biggest market (57% of sales).
Competition: Eli Lilly’s Zepbound (20.2% weight loss vs. Wegovy’s 13.7%) & Mounjaro are stealing market share. Compounded GLP-1s from Hims & Hers add pricing pressure.
Here's what I see:
There's a strong bearish sentiment, but the stock is very underpriced.
Considering the current stock price, EPS is at an all-time high. This means investors get more earnings for their stock.
P/B, P/E, and P/S ratios are at the lowest level since 2017! This is despite revenue growth of 25%+ for 3 consecutive years.
Operating margins are still quite healthy.
The company still has a very significant share (over 50%) of the GLP1 drugs worldwide.
The valuation of this company is now at the best level of the last 7-8 years.
There might be more volatility ahead, but I see the recent price drop as an opportunity to buy a pharma giant at a big discount, giving investors a margin of safety.
Quick note: I'm just sharing my journey - not financial advice! 😊

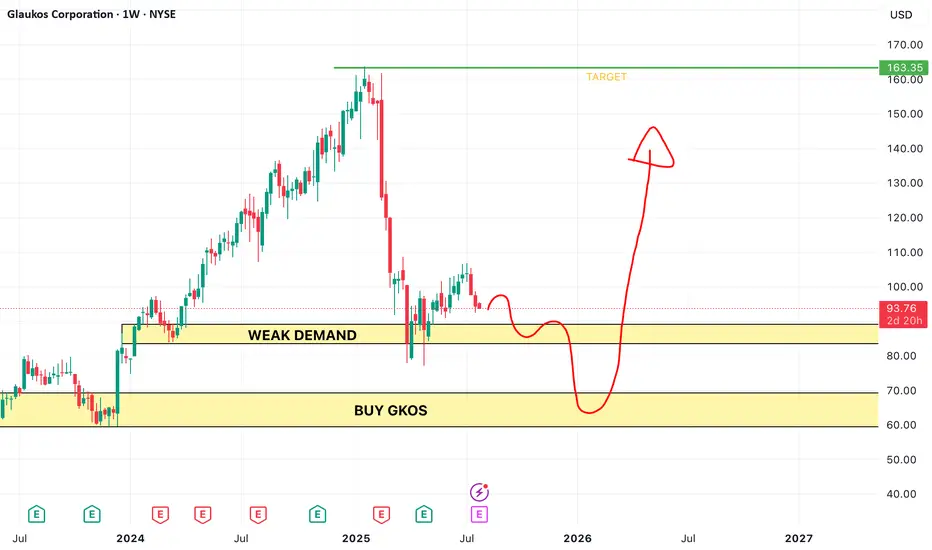
GKOS SET&FORGETWe have identified our weak demand zone and our strong demand zone. Expect the current level to simply act as a zone to pull in early buyers before the stock drop to take our the buyers.
Expect the bottom zone to be the real demand zone for which price will respect.
AAON BUYERS BEWARE!!!This is a classic early buyer inducement trap. Expecting this level to break and take out buyers before dropping to our demand zone.

ALL-IN NOVO!!!We have reached a significant demand zone from which we shall accumulate some buy orders. Expecting this stock to turn around from this zone and break into new all-time-highs.

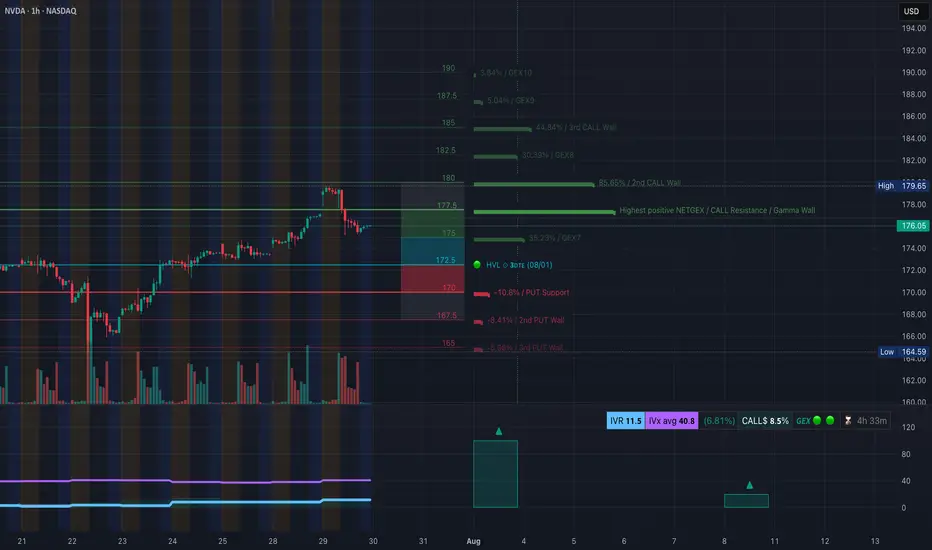
NVDA Rejection From Supply! July 30NVDA Rejection From Supply! Will Gamma Walls Trap Bulls Below 178? 🔥
🧠 GEX-Based Options Outlook (1H GEX Chart)
NVDA currently trades around $176, just below the key Gamma Wall at $178, which aligns with the Highest Positive NETGEX zone and a Call Wall cluster between $178–$180. This setup suggests that any move above $178 will face strong gamma resistance, and market makers will likely hedge by shorting, making it harder for price to rally.
* GEX Zones Overview:
* Strongest Call Walls: $180, $182.5, $185
* Gamma Wall: $178 (Major resistance)
* PUT Walls: $170, $167.5, $165 (Defensive zones)
* IVR is very low at 11.5, and IVx is near average at 40.8 — implying premiums are cheap, and buyers of options may benefit if volatility spikes.
📉 Bias: Neutral-to-Bearish short-term unless NVDA cleanly reclaims $178 with volume.
💡 Options Suggestions:
* Put Debit Spread: Buy 175 Put / Sell 170 Put (limited risk, targeting a move to GEX7 zone)
* Call Credit Spread: Sell 178 Call / Buy 182.5 Call (fade the resistance zone with defined risk)
* Directional Put: Buy 175 Put for potential flush to 172 or lower if GEX support fails
📊 1-Hour Intraday Technical Analysis
Market Structure & Smart Money Concepts:
* A clear Change of Character (CHoCH) occurred after price failed to hold the ascending trendline from July 24–29.
* Break of Structure (BOS) at $176.75 confirmed the shift from bullish to corrective.
* Price is now under the order block rejection zone (highlighted pink) and has respected a bearish supply reaction.
Support/Resistance:
* 🔻 Resistance: $176.75 (previous BOS), $178 (Gamma Wall)
* 🟢 Support: $172.94 (FVG zone) and strong PUT wall at $170
* Critical liquidity zone sits between $165–$168 — this is a potential magnet if downside accelerates.
EMA 9/21 Status:
* Bearish crossover already triggered.
* Price now trades below both EMAs, reinforcing bearish short-term control.
Volume Analysis:
* Last few red candles show increasing sell volume — institutional exit or short entry likely occurred.
🔀 Scenarios to Watch
Bullish Intraday Setup:
* If NVDA reclaims $176.75 with strong momentum and breaks above $178 (Gamma Wall), potential to squeeze to $180 and $182.5.
* Entry: $177.20+ reclaim
* Stop: $175.90
* Target: $179.65 → $182.50
* ⚠️ Needs strong volume and VIX relief to work
Bearish Intraday Setup (High-Probability):
* Price stays below $176 → fade any retest of $176.75
* Entry: $175.90 or below
* Stop: $177.30
* Target 1: $172.94
* Target 2: $170
* Extended: $167.5 if GEX support collapses
📌 Final Thoughts
NVDA just triggered a bearish shift in structure after a strong run. With IV still low and GEX pressure mounting at the $178 level, the setup leans more toward bearish-to-sideways chop unless bulls reclaim key resistance. Ideal strategy is to fade into resistance and scale out near the lower GEX walls.
This analysis is for educational purposes only and does not constitute financial advice. Always do your own research and trade responsibly.
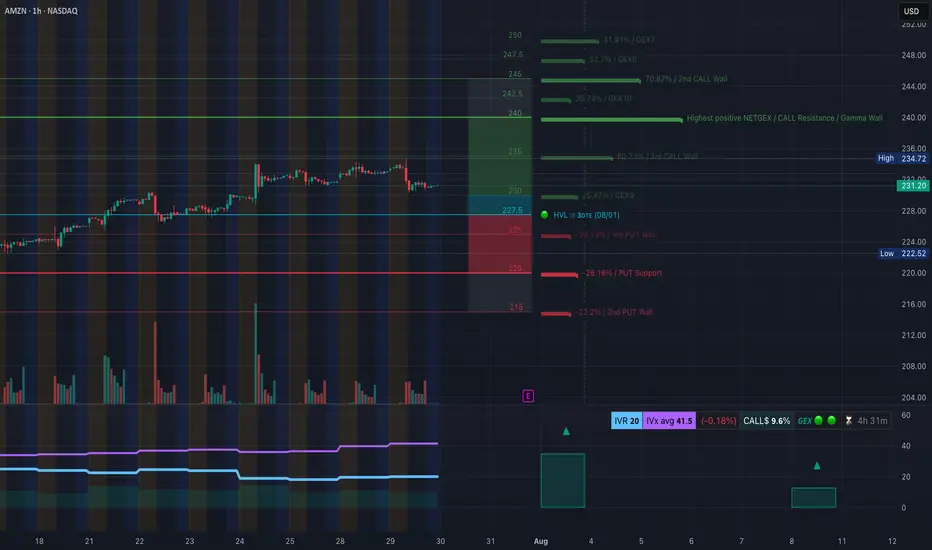
Will $222 Hold or Are We Heading for $215 Flush? July 30AMZN Breakdown in Progress!
🔍 GEX Insights & Options Trading Thoughts (1H Perspective)
Amazon (AMZN) is transitioning from a distribution phase into a potential gamma-driven selloff, and the current GEX setup confirms that bias. The GEX walls are sharply stacked on the downside, while call walls remain heavy above current price—creating strong overhead pressure.
🔸 Gamma Exposure Breakdown:
* Highest Positive GEX (Call Resistance):
* $236 → this is where market makers lean short, and we see strong rejection wicks from this zone.
* 3rd Call Wall: $236
* 2nd Call Wall: $242.5
* GEX Flip Zone / Transition Area: $231–227.5
* Below this = gamma turns negative, increasing downside velocity
* PUT Walls:
* $225 = 3rd PUT Wall (-20.13%)
* $220 = Major PUT Support (-26.16%)
* $215 = 2nd PUT Wall (-22.2%)
The positioning suggests a gamma gravity pull toward $225 → $222, with high risk of flush to $215 if $222 breaks.
🔸 Options Setup Suggestions:
* Bias: Bearish
* Ideal Option Play:
* Aug 2 / Aug 9 $225P or $220P
* Enter on failed retest of $231
* Exit partial at $225, full at $222 or $215
* Avoid chasing puts too late—look for retest rejection near $231–232
If you're conservative, watch for a break and close below $227.5 to confirm further drop before entering.
🧠 1H Intraday Technical Analysis (TA)
Market Structure:
* AMZN broke below the ascending trendline, showing a clean CHoCH (Change of Character) after price rejected $236 twice—clear sign of distribution.
* BOS → CHoCH sequence confirmed, showing the shift from bullish to bearish order flow.
* Price is now trapped below the former support zone ($231.5), which has turned into supply.
Supply & Demand Zones:
* Supply Zone (Resistance): $234.5–236
* Micro Supply (Retest Area): $231.5–232.5
* Demand Zone (Support): $223–222
* Next Key Demand: $215
* If $222 fails, there’s minimal liquidity support until $215
Volume & Confirmation:
* Volume profile shows declining participation on upside pushes, followed by heavy sell volume candles post-CHoCH.
* This supports the idea of institutional distribution above $234.
🧭 Trading Outlook
🔻 Bearish Intraday Play (Favored):
* Entry 1: Retest rejection at $231.5–232
* Entry 2: Breakdown below $227.5
* Target 1: $225
* Target 2: $222.5
* Target 3: $215 (if panic flush triggers)
* Stop Loss: Above $234
🔼 Bullish Reclaim (Less Likely):
* Needs to reclaim $234.5 with strength
* Would target $236, $240
* Not supported by GEX or volume—low probability
🧠 Final Take:
AMZN is now trapped beneath heavy call walls and has shifted structure with a confirmed CHoCH. GEX shows negative gamma territory below $227.5, creating a slippery slope toward $222. The option market is positioning for further downside while intraday structure aligns for a potential flush into lower demand zones. Unless bulls reclaim $234+ with volume, this setup remains bearish biased with favor to PUT side trading.
🛑 This breakdown is for educational purposes only and does not constitute financial advice. Trade at your own risk and always manage your positions carefully.
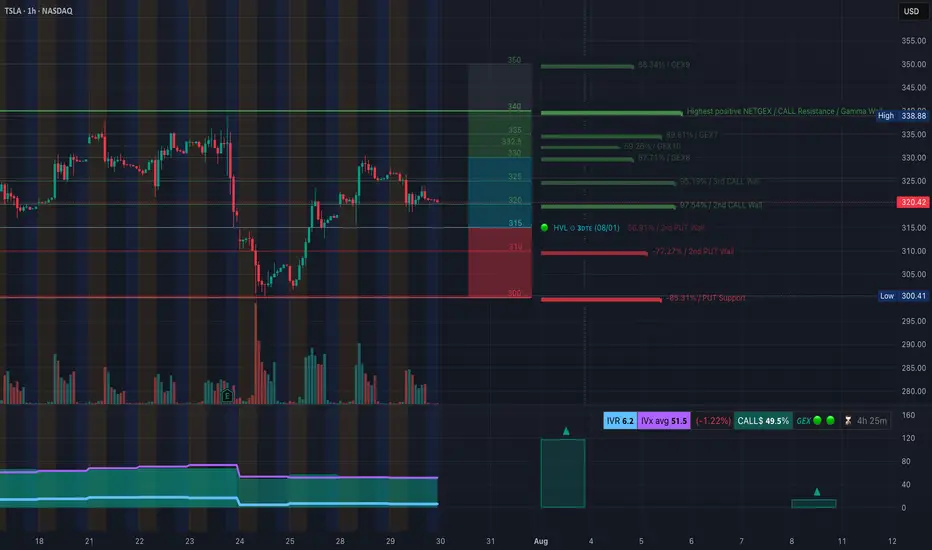
TSLA Rejection at Supply! Breakdown & Options Outlook. Jul 30🔍 Technical Analysis (1H Chart)
TSLA failed to hold above the mid-supply zone around 330–335, rejecting cleanly after forming what looks like a double top on the 1-hour chart — a bearish reversal pattern. Price has since made a CHoCH (Change of Character), confirming shift in market structure from bullish to short-term bearish.
We now see price hovering just above 320, which aligns with GEX and SMC support zones. Volume on the rejection candle was higher than average, confirming strong selling pressure.
A bearish BOS (Break of Structure) also aligns with the double top, adding conviction that bulls are weakening.
🧠 GEX & Options Sentiment (Options GEX Chart)
* Highest Gamma Wall (Call Resistance): 338.48
* Current Price: 325.78
* Gamma Weak Zone: 325–335
* PUT Wall (Support): 300
* IVX avg: 51.5 (neutral/low vol), IVR: 6.2
* Call/Put Sentiment: Balanced — Calls: 49.5%
GEX sentiment shows TSLA is pinned in a gamma transition zone, stuck between heavy resistance above and decent put support near 300–310. That’s your battlefield.
🎯 Trading Scenarios (1H View – Swing)
Bearish Setup
* Entry: Below 319 confirmation
* Target 1: 310
* Target 2: 300 (GEX put support)
* Stop: 326 (above CHoCH zone)
* Bias: 🔻 Until demand zone or reclaim of 330
Bullish Reclaim Scenario
* Entry: Above 330 with volume
* Target: 338 then 345
* Stop: 324
⚡ 15 Min Intraday Scalping Outlook
* Bias: Bearish unless reclaim 326+ with strong volume
* Expect short-term bounces off 315 or 310 for scalp CALLs
* VWAP resistance will be key intraday
* Keep an eye on MACD crossover + OB (Order Block) entries on micro pullbacks
🎯 Suggested Options Play
For Bearish Move (if 319 breaks):
* 🛑 Buy TSLA Aug 2 PUT 320 or 315
* 🎯 Target IV expansion near 305
* Tight stop — re-evaluate above 326
For Bounce from 310–315 Zone:
* 🎯 Buy TSLA Aug 2 CALL 320 if strong reversal + OB entry
* Scale out near 325–328
* Risk defined: below 310
🔚 Summary
TSLA shows weakness after forming a double top and CHoCH at the 330–335 level. Gamma levels suggest pressure toward 310–300 unless bulls defend fast. Watch the reaction at 319–320 for short entry, or at 310–315 for scalping bounce setups.
Disclaimer: This analysis is for educational purposes only. Always do your own research and manage risk accordingly.