NGD - Looking for a nice pullback after Gold's exhaustionJust an example of 1 of many gold miner ideas i'm cooking up. Looking for future entry points for long term holds (1-4) years at the moment. I feel gold is going to have a huge role to play in the future monetary system as countries lose trust in each other and people lose trust in fiat currencies.

UPS is currently in the Wyckoff Accumulation Phase### **Wyckoff Phase: Accumulation**
1. **Prior Downtrend:** The weekly chart (left) clearly shows a prolonged and significant downtrend through 2024 and into early 2025. This fulfills the "Markdown" phase that precedes accumulation.
2. **Stopping Action and Base Formation:** The daily chart (right) shows that the steep decline halted around March-April 2025. The price then rallied automatically and has since been consolidating sideways. This sideways trading range, following a major downtrend, is the hallmark of the Accumulation phase, where "smart money" may be absorbing shares and building a cause for a future rally.
3. **Confirming Indicators:** The "Neutral" rating from the technicals gauge confirms the current lack of a strong trend. Furthermore, the positive performance in the last week (+1.45%) and month (+3.62%) shows that selling pressure has subsided and short-term demand is emerging, which is consistent with the early stages of accumulation.
### **Suggested Option Strategy: Poor Man's Covered Call (PMCC)**
Given the analysis that UPS is building a base in an Accumulation phase (implying a neutral to bullish long-term outlook), a **Poor Man's Covered Call (PMCC)**, also known as a long call diagonal debit spread, is a suitable strategy.
This strategy allows you to establish a bullish position with less capital than buying 100 shares, while potentially generating income during the expected consolidation period.
**How it Works:**
This is an advanced strategy and should be approached with a full understanding of the risks.
1. **Buy a Long-Term, In-the-Money (ITM) Call:** Instead of buying 100 shares of UPS, you buy a single call option with a long time until expiration (e.g., 6-12 months). Choosing an in-the-money strike (a strike price below the current stock price) makes the option behave more like the stock.
2. **Sell a Short-Term, Out-of-the-Money (OTM) Call:** Against your long call, you sell a call option with a near-term expiration (e.g., 30-45 days) and a strike price that is above the current stock price.
**Goal of the Strategy:**
The objective is for the short-term call you sold to decrease in value faster than your long-term call due to time decay (theta). Ideally, the short call expires worthless, and you keep the premium. You can then repeat the process by selling another short-term call, continuously reducing the net cost of your long-term bullish position while you wait for the stock to potentially begin its "Markup" or uptrend phase.
***
*Disclaimer: This information is for educational purposes only and is not financial advice. Options trading involves significant risk and is not suitable for all investors. You should consult with a qualified financial professional before making any investment decisions.*

SNAP - Bullish Reversal in Playhi traders,
* Reclaimed Support Zone
Price has successfully reclaimed a key historical support around the $8.06–$8.72 range, which previously acted as a base before major rallies. This suggests growing buyer interest at this level.
* RSI Breakout
On the RSI, we’ve seen a clean breakout from a long-term descending trendline, which has capped momentum since late 2023. This momentum shift increases the probability of a bullish continuation.
* Reward/Risk Outlook
This setup shows two potential targets:
🎯 Target 1: $12.80 (mid-range resistance)
🎯 Target 2: $17.34 (multi-year resistance level)
Stop-loss is strategically placed below the reclaimed support zone at around $7.76–$7.79, offering a favorable risk/reward profile.
The confluence of technical signals—price reclaiming support and momentum confirmation via RSI breakout—indicates a possible trend reversal. Bulls could be regaining control, making this an attractive swing opportunity.

Is ADANIENT Ready to Fly? – With Detailed Analysis & TargetDisclaimer:
This is not financial advice. Please do your own research or consult with a financial advisor before making any investment decisions. Investments in stocks can be risky and may result in loss of capital.

JSW Steel : symmetrical triangle pattern breakout1. Long-term trend : In uptrend ✅
2. Pattern formed : A Triangle is formed. Multiple touchpoints on the upper and lower trend lines from
March 25 to June 25.(3 Months) ✅
3. Breakout : Multi-Frame breakout.
Two breakouts on the same day, June 25, 2025 ✅
Breakout on Daily Chart
1. Triangle upper trend line breakout with higher volume - 1.9M
2. Recent resistance 1015 - 1018
Breakout on Monthly Chart
4. Volume at breakout: higher volume - 1.9M ✅
5. RSI : Above 50
6. Confirmation : On June 26, the green candle closed above the previous breakout candles' high. ✅
7. Entry : 1028
8. Exit :
1. Based on Fib extension 1.68 golden zone - **1208**
2. Based on the first swing high and swing low at the start of the triangle pattern - **1198**
9. Total Upside: ~16-17%
No Buy Or Sell Recommendations

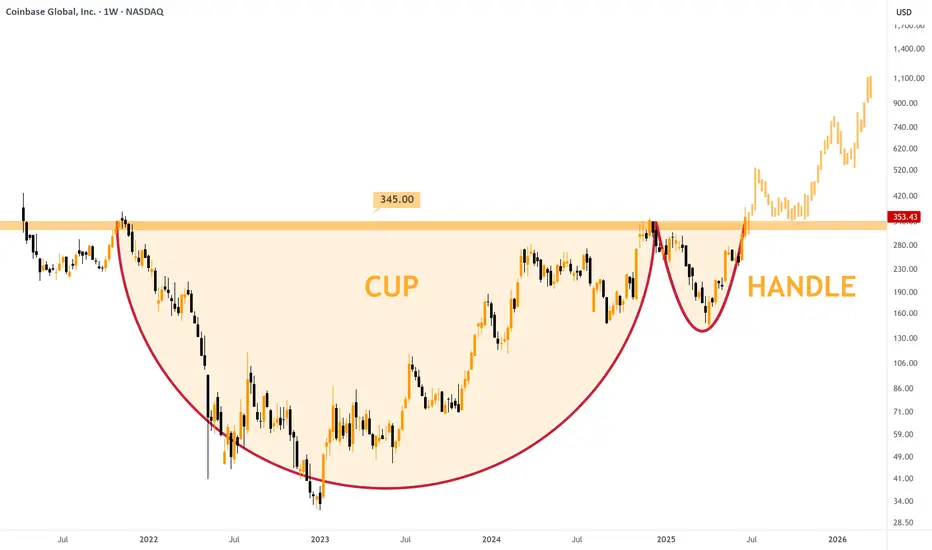
$COIN — Most Bullish Stock NowThe title of the idea is not lying, NASDAQ:COIN offers one of the most bullish charts I've seen on the stock market in a while - there is a HUGE Cup & Handle pattern.
On the 1W charts we can see a multi-year rounding bottom that began in late 2021, followed by a clean handle consolidation and a breakout above the $345 neckline. The breakout of the $345 neckline implies long-term targets between $650 and $1,000 if momentum persists.
Fundamentals of the company suggest a sharp growth as well:
NASDAQ:COIN joined the S&P500 Index which attracted money from thousands of investors
Launch of Coinbase Payments, tapping stablecoin growth (USDC revenue up ~31% QoQ to ~$296M), perfectly fit for the narrative about stables in USA
Coinbase's most recent earnings show strong growth: in Q1 2025, the company generated about $2.0 billion in total revenue, reflecting a substantial 24% year-over-year increase
To sum up, I can find zero reasons why you shouldn't have this stock in your mid-long-term portfolio.
Om infra All mantra is doing a great job in India for bringing water to every house in India.
This was also on the list of legendary investor Mr Kedias list.
I feel that the stock has got the potential of doing at least 7x in the next two years.
The management is good. The fundamentals are right and as you can see the technicals on the chart are saying that it has just done a major retracement and this is the right time to buy.

M & MBuy @ cmp - 3220
Stoploss - 2933.60
Target - 3777.10
3494.90
3575.75
3685.45
Happy Trading.
Jail Hind

highest ever weekly close : breakout on chartsHPCL witnessed its highest ever weekly frame close with a clean clear breakout
volumes are healthy with stock clocked more than 11% jump last week.
rsi witnessed healthy improvement and suggest the momentum to continue

ATGL: RSI improved significantly, good R:R Stock near a multi-tested support and witnessed a sharp move last week
the momentum indicator RSI indicates strength.
risk reward seems healthy for bulls with enough room for stock to inch higher

CYPARK - 52 WEEK HIGH CYPARK - CURRENT PRICE : RM0.925
CYPARK made a NEW 52 WEEK HIGH on 26 JUNE 2025. It also breakout a significant down trendline - indicating strong bullish momentum. Nearest target will be the measurement of flag pattern price target which is RM0.980. Then if it continues to rise, RM1.02 will be second target. Stop loss level is RM0.850.
ENTRY PRICE : RM0.920 - RM0.930
TARGET : RM0.980 and RM1.02
STOP LOSS : RM0.850

Long Probably!Hello All. because of No Pre-Cluster, market will reverse on the Node on versa Cluster. be happy(wink)

RAIN INDUSTRIES ' s Key Support Zone This is the one hour chart of RAIN INDUSTRIES.
Rain Industries is moving within an ascending parallel channel with support around 140 range and resistance around 160 range.
If this level is sustain , then we may see higher prices in the
Rain Industries
Thank You !!

Patent PricingA small stock with a market value of about $6 million has managed to get its patent rights for more than double that price.
Tp1,Tp2

DANGSUGAR LONG IDEARecently, the price of DANGSUGAR stock has broken out of a bearish trendline with a strong bullish weekly candle. This shows a strong intention to continue the buying momentum. To take advantage of the long opportunity, you can buy at the current market price while you can also wait for price to drop to N42.95. The stop can be at N37.70 while the target are N47.85 and N63.50 (final target). If this zone should fail, then the next long opportunity will be at N33.50 with a stop at N30.35 based on market structure.
Confluences for the long idea:
1. Trendline and resistance breakout with a strong bullish weekly candle.
2. Strong volume momentum on the volume indicator.
3. Market structure is bullish.
Disclaimer: This is not a financial advice. The outcome maybe different from the projection. Don't take the signal if you're not willing to accept the risk.

Triple top pattern failedTemporary postponement of repeat of the 1997 Eastern financial crisis by breaking the previous ceiling
Triple top pattern failed

FIDELITYBK: HOLD OR SELL?FIDELITYBK is running up towards its target after mitigating a valid demand zone within the discount level at a price of N17.25. If you have this stock in your portfolio, it's a good idea to hold the stock as it has a potential to go as high as N24.95. Although, the weekly swing high is the actual target, which is at a price of N21.55. Afterwhich, a drop in price is anticipated in order to create another long opportunity. Nevertheless, with the market structure being bullish, it's a good idea to ride on the higher prices that can be created in a bullish market.

Ye Chart Kuch Kehta Hai - Prime Focus LimitedPrime Focus Ltd’s stock shows strong technical momentum on the monthly chart, supported by high volume, price above key moving averages, and positive price forecasts. Fundamentally, the company’s leadership in media post-production, expanding digital solutions, and improving operating margins underpin its growth potential despite some profitability challenges. These factors combined suggest a favorable outlook for the stock’s growth in the near to medium term.
Technical Rationale (Monthly Chart)
Strong Uptrend Momentum: The stock price recently surged nearly 20% in a single day, closing at ₹136.83, well above its 50-day average (~₹108.7) and 200-day average (~₹118.1), indicating strong bullish momentum on the monthly scale.
Volume Surge: The volume of over 20 million shares traded is significantly higher than the average volume (~694,580), suggesting strong buying interest and potential continuation of the upward trend.
Price Recovery from Lows: The stock has rebounded from a low of ₹85 to current levels near ₹137, showing a recovery phase that often precedes further gains on monthly charts.
Positive Price Targets: Forecasts indicate a bullish trend with mid-year 2025 targets around ₹137.61 and year-end targets near ₹160, supporting the technical outlook for continued growth.
Fundamental Rationale
Market Position and Business Model: Prime Focus Limited is a global player in media and entertainment post-production services, including visual effects, 3D conversion, and cloud-based media solutions, serving major Hollywood studios, OTT platforms, and broadcasters. This diversified service portfolio positions it well in a growing digital content market.
Revenue and Operating Profit: Despite some volatility, the company reported strong operating profit margins recently (22% in FY2025) and operating profit of ₹786 crore, indicating operational efficiency improvements.
Growth Prospects: The company’s digital transformation offerings (CLEAR cloud media ERP suite) and global footprint across 18 cities enhance its growth potential in the expanding entertainment technology sector.
Valuation and Intrinsic Value: The stock currently trades at a premium of about 63% over its median intrinsic value estimates, reflecting positive market sentiment and growth expectations.
Return Ratios and Challenges: While ROE remains negative (-15.8%) and sales growth has been modest (4.21% over 5 years), the improving operating margins and strategic investments in technology could drive future profitability and shareholder returns.
Promoter Holding and Market Cap: Promoter holding slightly decreased recently but remains significant, and the market cap stands around ₹4,240 crore, indicating a mid-cap stock with room for institutional interest and growth.

Ye Chart Kuch Kehta Hai - IDFC First BankThe weekly technical chart for IDFC First Bank (NSE:IDFCFIRSTB) indicates a positive outlook for the stock due to several key factors:
Strong Buy Signals from Moving Averages: All major moving averages (5, 10, 20, 50, 100, and 200 periods) are signaling a "Buy" on the weekly chart, reflecting strong upward momentum and trend strength.
Positive RSI and MACD Indicators: The Relative Strength Index (RSI) stands at around 57.4 on the weekly scale, which is in a healthy bullish zone below overbought levels, suggesting room for further upside. The MACD is also positive, reinforcing bullish momentum.
Support from Ultimate Oscillator and Other Indicators: The Ultimate Oscillator reading is above 50, indicating buying pressure. Although some oscillators like CCI and ADX show mixed signals, the overall technical consensus leans bullish.
Price Above Key Pivot Points and Supports: The current price is trading above key pivot levels and support zones, which typically act as strong floors for price action and reduce downside risk.
Recent Price and Volume Trends: The stock price has risen about 4.58% over the past week and 6.12% over the last month, indicating sustained buying interest. Mutual fund holdings have also increased recently, which often supports price appreciation.
Analyst Sentiment and Growth Indicators: Over 50% of analysts recommend a "Buy" rating with an average target price near current levels, reflecting confidence in the stock’s growth potential. The company has shown consistent revenue growth and outperformance relative to peers in recent quarters.
In summary, the weekly technical chart for IDFC First Bank shows a confluence of bullish signals from moving averages, momentum indicators, and price action, supported by positive market sentiment and fundamental growth trends. This technical setup suggests a likely upward movement in the stock price in the near term on a weekly basis

BANCOINDIA - Earnings Gap up (EP)
- Strong prior buying force
- Narrow range consolidation near ATH
- Volume dry up
- Small SL , High R:R

IRENs Incredible Surge Continue next wWeek?NASDAQ:IREN has been on a rampage since the April surging 175% and nearing all time high! A great couple of trades for us so far!
Price is likely to hit all time high next week with such a strong trend, where resistance and a pullback is a high probability.
The weekly pivot is $9.77, the most likely area for price to find support just above the 0.382 Fibonacci retracement (which will be dragged up to the weekly pivot once a new high is made).
Price discovery terminal target are the R3 & R5 weekly pivot points at $28 and $40.
Safe trading

Ye chart Kuch Kehta Hai - Jio Financial Jio Financial Services stock shows strong potential for growth on the weekly technical chart based on multiple technical indicators and moving averages signaling bullish momentum:
Strong Buy Signals Across Moving Averages: All key moving averages (5, 10, 20, 50, 100, and 200-day SMAs and EMAs) are indicating a "Buy" or "Strong Buy" signal, reflecting sustained upward price momentum over various time frames.
Bullish Technical Indicators: Indicators such as MACD, ADX, CCI, ROC, and Ultimate Oscillator are all showing buy signals, supporting a positive trend continuation. For example, MACD is positive and rising, ADX at 46.6 indicates a strong trend, and CCI at 177.7 confirms bullish momentum.
Overbought but Strong Momentum: Although the RSI (14) is overbought at 81.3, which typically signals caution, in strong trending markets this can indicate continued strength rather than an immediate reversal.
Price Action and Pivot Levels: The stock price is currently above key pivot points and resistance levels, with classic pivot resistance around 329-335 levels, suggesting room for further upward movement before significant resistance is encountered.
Recent Price Performance: Jio Financial has gained nearly 10% in the past week and over 11% in the last month, demonstrating strong recent buying interest and momentum.
Volatility and Volume Support: The ATR (Average True Range) indicates high volatility, which can fuel strong price moves, and the Bull/Bear Power indicator confirms buyers' dominance.
In summary, the weekly technical chart for Jio Financial Services reflects a robust bullish setup with multiple moving averages and momentum indicators aligned on the buy side, supported by recent strong price gains and favorable pivot levels. This technical landscape suggests a high probability of continued price appreciation in the near term on the weekly timeframe

Potential outside week and bullish potential for CXOEntry conditions:
(i) higher share price for ASX:CXO above the level of the potential outside week noted on 27th June (i.e.: above the level of $0.1025).
Stop loss for the trade would be:
(i) below the low of the outside week on 20th June (i.e.: below $0.083), should the trade activate.
