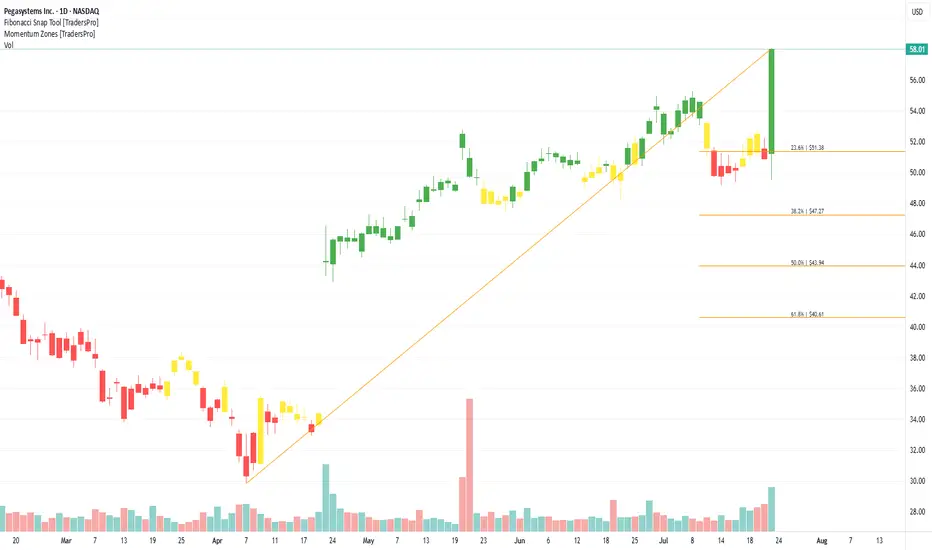
Pegasystems Inc. (PEGA) Powers AI Business WorkflowPegasystems Inc. (PEGA) is a software company that delivers AI-powered workflow automation and customer engagement solutions for large enterprises. Its platform helps businesses streamline operations, improve customer experiences, and adapt quickly to changing needs. Pegasystems’ growth is driven by digital transformation across industries, demand for low-code development tools, and the growing importance of personalized customer interactions.
On the chart, a confirmation bar with rising volume shows strong interest. The price has moved into the momentum zone by breaking above the .236 Fibonacci level. Using the Fibonacci snap tool, traders can set a trailing stop just below that level to help lock in profits while allowing for additional upside potential.
GBRK: Fundamental Analysis +46 %With 2024 revenue of $2.1 billion, Green Brick Partners is the 3rd largest builder of single-family homes in the Florida, Georgia, and Texas regions. EverStock identifies a fundamental revaluation potential of + 46 %.
Valuation at 7.7x net earnings
Currently valued at $2.94 billion, Green Brick Partners posted a profit of $382 million in its latest fiscal year (2024).
Balance sheet and debt
In Green Brick’s latest annual report, tangible net asset value stood at $1.58 billion, giving a market capitalization / tangible net asset value ratio of 1.75.
The gearing ratio is excellent, at 0.24.
Current share price : $66.98
Target price : $97.57
Upside potential : + 46 %
Dividend : $1.44
Yield : 2.15%
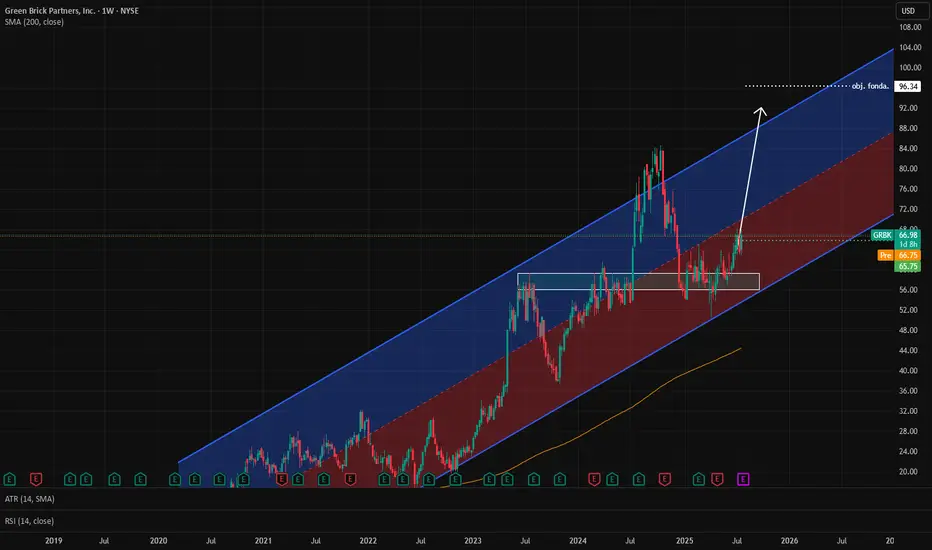
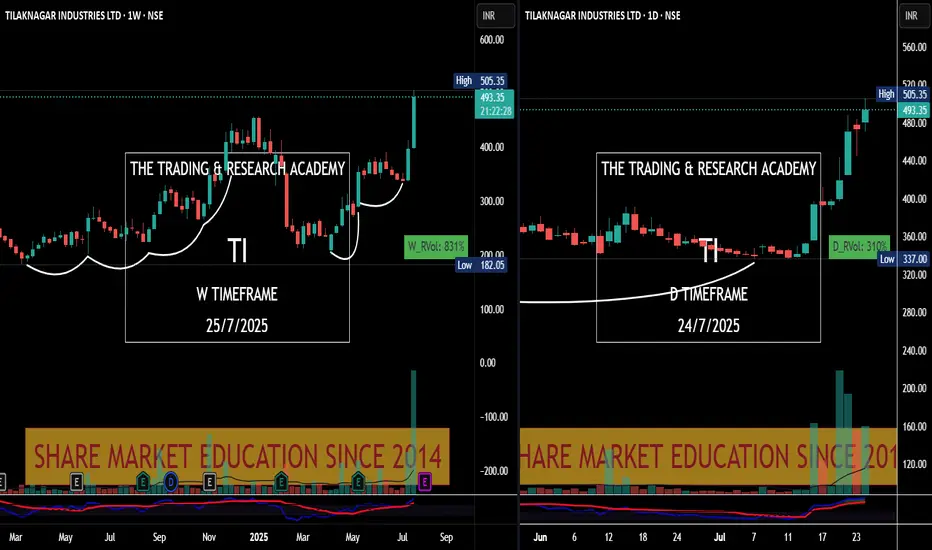
Chart Speaks- Tilak Nagar Ind
#Price leads the #News! Tilak Nagar Ind #tilaknagar see the chart v/s News.
News came yesterday, have a look at chart. Someone was accumulating it since long.
Chart Speaks
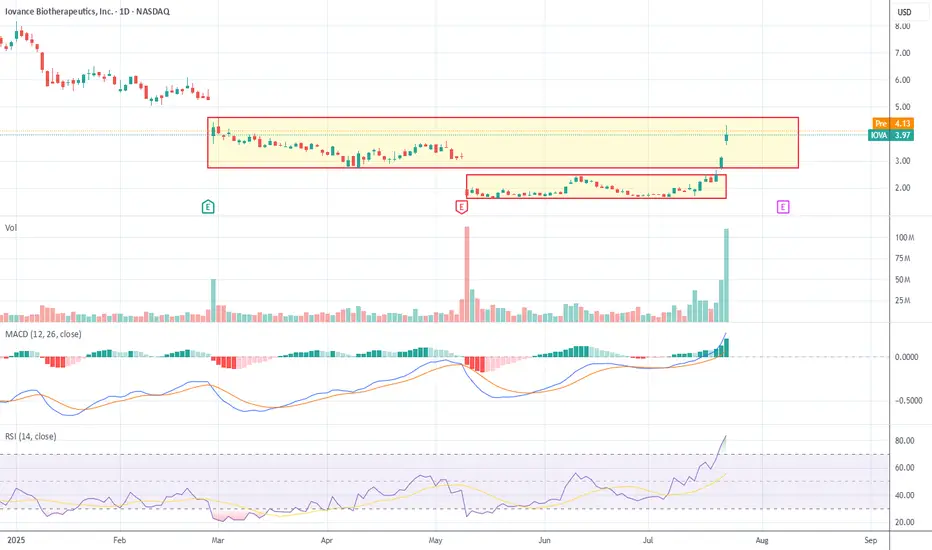
IOVA Just Woke Up: Base Breakout, Volume Surge and $5+ in SigthIOVA is breaking out in style. This is a rebound towards prior levels but the volume is impressive. Let's break it down
The latest candle is a marubozu (strong close near high), coming after a clean upside range expansion. Previous session was a high-volume thrust bar as well — together they create a bullish continuation pattern after a consolidation zone.
RSI confirms — now at 83.51, signaling extreme buying pressure. No topping pattern yet. This is trend continuation, not exhaustion — but it’s getting extended.
Trend: Just emerged from a multi-month base. MACD just had a clean crossover above zero. Histogram increasing — confirms ignition. Volume surging for multiple sessions — this is institutional accumulation or news-driven demand. RSI above 80 = emotional phase. Still bullish, but vulnerable to a short-term shakeout. Looks like funds that watched this base for months are now piling in fast.
Box Analysis
Old box was around $2.00–$2.50 → breakout started 3 sessions ago. Now price is forming a new box upper edge around $4.15–$4.30. Support zone: $3.20–$3.50 (prior gap, volume cluster). Resistance at $4.30.
If price consolidates under $4.30 for 1–3 sessions, this could turn into launchpad structure for next leg up.
Fibonacci Levels
Using recent swing low (~$1.60) to today’s high ($4.33):
Retracements:
23.6% = $3.70
38.2% = $3.25
50% = $2.96
61.8% = $2.68
Extensions:
127.2% = $5.08
161.8% = $5.72
Actionable Read
Long bias traders: Can trail stops under $3.70 or wait for consolidation near $4.15 to add.
Dip buyers: Watch $3.25–$3.50 zone for re-entry if price pulls back.
Shorts: No signal yet. Only viable if rejection forms at $4.30 or extended wick with volume divergence.
Next 3 likely playbook paths?
Continuation: Pushes to $5.08+ (127.2%) if volume remains strong.
Pullback & flag: Consolidates $3.50–$4.30 for 1–3 days, then resumes.
Fakeout: Breaks $3.20 and closes under $3.00 = bull trap.
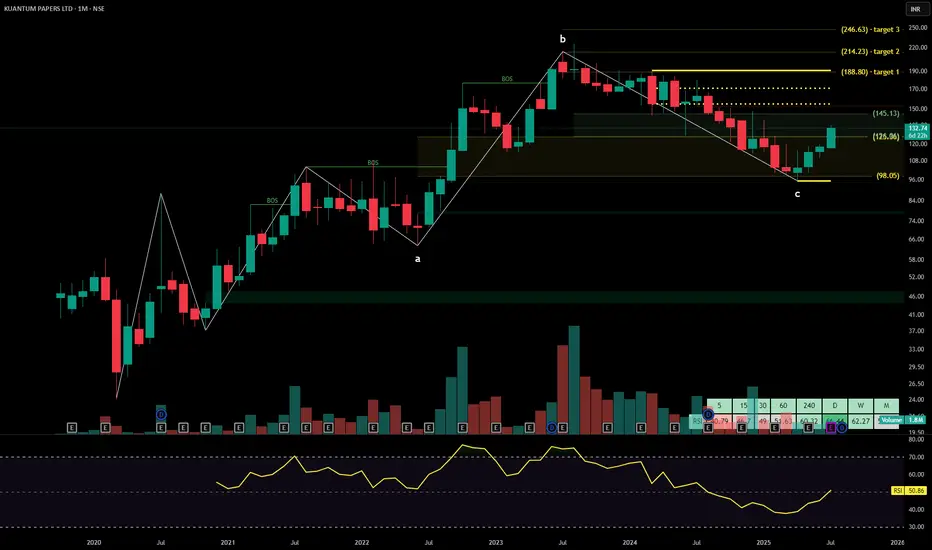
KUANTUM PAPERSKuantum Papers Ltd. is a leading paper manufacturing company with integrated production facilities and a strong portfolio across writing, printing, packaging, and specialty paper segments. The company focuses on eco-friendly processes and operational efficiency, catering to domestic and institutional clients. The stock is currently trading at ₹145.13.
Kuantum Papers Ltd. – FY22–FY25 Snapshot
Sales – ₹582 Cr → ₹612 Cr → ₹652 Cr → ₹695 Cr – Steady topline growth from volume expansion and pricing mix Net Profit – ₹53.8 Cr → ₹61.2 Cr → ₹68.4 Cr → ₹76.3 Cr – Earnings driven by capacity utilization and margin stability
Order Book – Moderate → Moderate → Strong → Strong – Expansion in institutional orders and packaging segment
Dividend Yield (%) – 0.52% → 0.55% → 0.58% → 0.60% – Gradual payout growth aligned with profitability Operating Performance – Moderate → Strong → Strong → Strong – Improved efficiency and raw material cost
Equity Capital – ₹8.12 Cr (constant) – Lean capital base with no dilution
Total Debt – ₹76 Cr → ₹72 Cr → ₹68 Cr → ₹64 Cr – Gradual deleveraging supported by internal accruals
Total Liabilities – ₹228 Cr → ₹236 Cr → ₹243 Cr → ₹252 Cr – Expansion aligned to capex and working capital needs
Fixed Assets – ₹102 Cr → ₹107 Cr → ₹113 Cr → ₹118 Cr – Capacity enhancement toward high-value grades
Latest Highlights FY25 net profit rose 11.6% YoY to ₹76.3 Cr; revenue increased 6.6% to ₹695 Cr EPS: ₹9.40 | EBITDA Margin: 22.7% | Net Margin: 10.98% Return on Equity: 17.82% | Return on Assets: 11.26% Promoter holding: 50.06% | Dividend Yield: 0.60% Premium paper grades and packaging demand boosting margin profile Ongoing backward integration and biomass energy support sustainability focus
Institutional Interest & Ownership Trends Promoter holding remains firm at 50.06%, with no pledging or dilution. Institutional activity is limited but stable, with visible accumulation by PMS and HNI desks in recent quarters. Delivery volume trends suggest quiet positioning aligned with mid-cap FMCG and specialty packaging consumption themes.
Business Growth Verdict Yes, Kuantum Papers continues to scale steadily across its core and value-added segments Margins remain healthy supported by operational leverage Debt is declining, enhancing balance sheet visibility Capex supports long-term margin mix and ESG compliance
Company Guidance Management expects mid-to-high single-digit revenue growth in FY26, supported by product mix optimization, energy cost control, and expansion in institutional packaging clients.
Final Investment Verdict Kuantum Papers Ltd. represents a disciplined play in India’s paper manufacturing and packaging ecosystem. Its steady financial metrics, sustainability initiatives, and growing institutional demand position it well for compounding. The consistent profitability, improving cash flows, and conservative debt structure make it attractive for investors seeking mid-cap exposure to industrial FMCG-linked consumption.
Stock Of The Day / 07.23.25 / FI07.23.2025 / NYSE:FI
Fundamentals. The earnings report exceeded expectations.
Technical analysis.
Daily chart: Downtrend
Premarket: Gap Down on increased volume. We mark the premarket low of 136.0
Trading session: The price did not continue the downward movement and formed an uptrend after the initial impulse down. The key moment is the reaction to the level of 136.0: if the downward trend will continue or the trend change to an uptrend will be confirmed. We observe the price tightening to the level of 136.0 against the uptrend with a clear hold of the level, after breakout the level. We consider a long trade to continue the upward movement in case tightening structure is broken upward.
Trading scenario: pullback along the trend (false_tightening) to level 136.0
Entry: 137.21 when the tightening structure is broken with exit upwards.
Stop: 135.79 we hide it behind the tail of the last pullback.
Exit: You can hold the position until the end of the session with due patience.
Risk Rewards: 1/4
P.S. In order to understand the idea of the Stock Of The Day analysis, please read the following information .

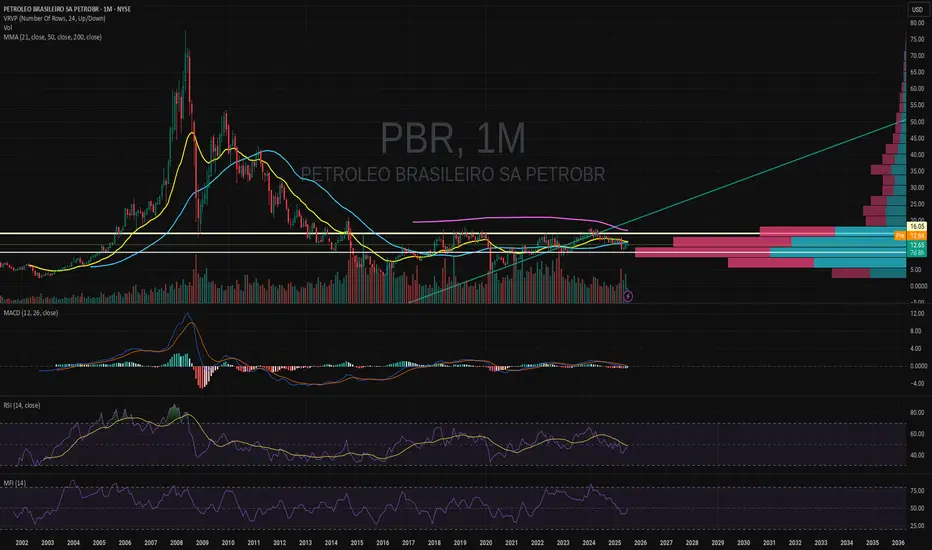
PBR - LongPBR
Well PBR has been making some ground.
I'm just going to make this chart as a way for me to track it in the coming years.
I like it.
cheers
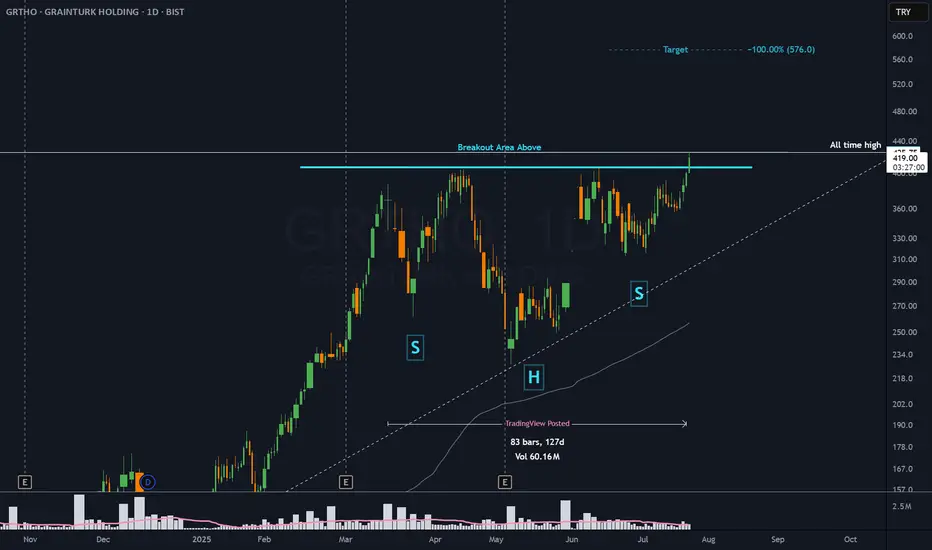
GRTHO - 3 months HEADS & SHOULDERS══════════════════════════════
Since 2014, my markets approach is to spot
trading opportunities based solely on the
development of
CLASSICAL CHART PATTERNS
🤝Let’s learn and grow together 🤝
══════════════════════════════
Hello Traders ✌
After a careful consideration I came to the conclusion that:
- it is crucial to be quick in alerting you with all the opportunities I spot and often I don't post a good pattern because I don't have the opportunity to write down a proper didactical comment;
- since my parameters to identify a Classical Pattern and its scenario are very well defined, many of my comments were and would be redundant;
- the information that I think is important is very simple and can easily be understood just by looking at charts;
For these reasons and hoping to give you a better help, I decided to write comments only when something very specific or interesting shows up, otherwise all the information is shown on the chart.
Thank you all for your support
🔎🔎🔎 ALWAYS REMEMBER
"A pattern IS NOT a Pattern until the breakout is completed. Before that moment it is just a bunch of colorful candlesticks on a chart of your watchlist"
═════════════════════════════
⚠ DISCLAIMER ⚠
The content is The Art Of Charting's personal opinion and it is posted purely for educational purpose and therefore it must not be taken as a direct or indirect investing recommendations or advices. Any action taken upon these information is at your own risk.
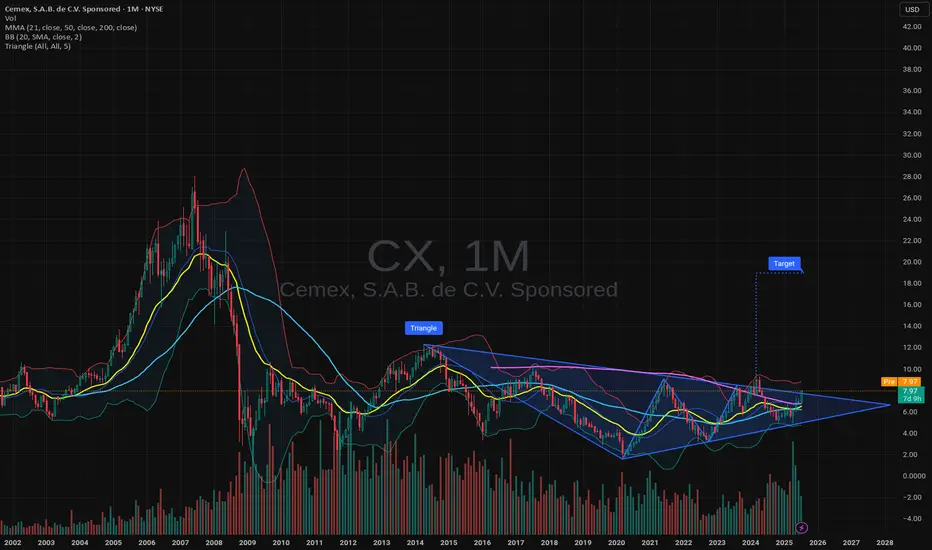
CX - LongCX
I have liked this one for a while now.
We will see how much Latin America will grow.
I think they have more growth in them.
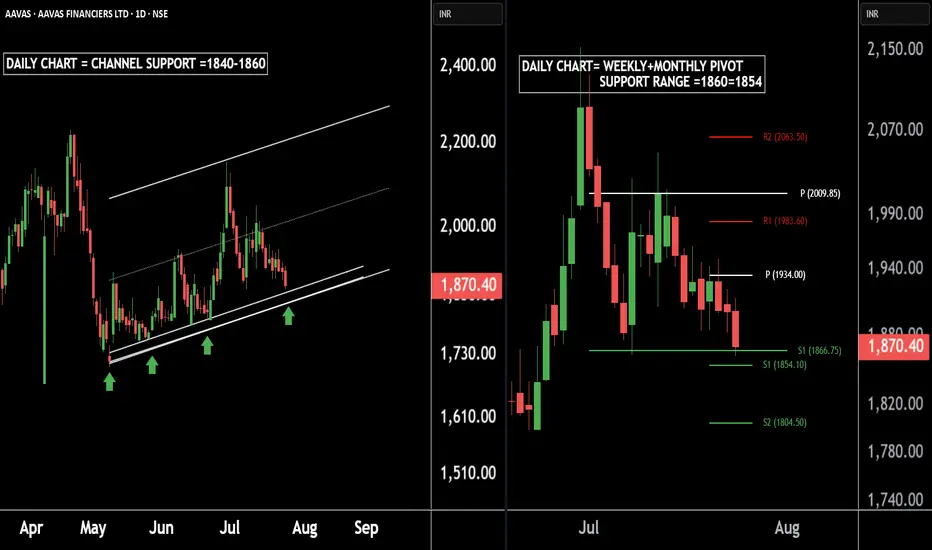
AAVAS Housing – A Hidden Gem for Medium-Term InvestorsThere are two charts of AAVAS FINANCIERS.
On the first chart AAVAS FINANCIERS is moving in a well defined parallel channel with support near at 1840-1860.
On the second chart AAVAS FINANCIERS is taking Weekly + Monthly support near at 1866-1854.
If this level is sustain ,then we may see higher prices in AAVAS FINANCIERS LTD.
Thank You !!
EOY based on yesterday's earnings and the flywheel effect# Alphabet's Accelerating Flywheel: Q2 2025 Earnings Validate the Strategy
technicals grounded in an anchored pitchfork hinged on the pre-covid levels (covid bottom just makes the path too aggressive for EOY) and fib retracements of the 2022 bear market decline. General and simple targets since moving averages aren't providing much clarity. Single stock analysis is even more voodoo than large sector indexes, so I'll focus on fundamentals instead:
## The Flywheel In Action: Q2 2025 Results
Alphabet's blowout Q2 2025 earnings provide concrete evidence that their integrated AI flywheel is already spinning faster. **Revenue grew 14% to $96.4 billion, crushing expectations**, while the company raised its 2025 capital expenditures from $75 billion to **$85 billion**—a bold investment that initially spooked some investors but actually signals the flywheel's acceleration.
### Why the $85 Billion Capex Increase is Strategic Genius
The additional $10 billion isn't just spending—it's **strategic reinvestment in the flywheel's core components**:
**Infrastructure Dominance:** Google Cloud revenue surged 32% to $13.6 billion, now approaching a $50+ billion annual run rate. The capex increase funds the massive data centers and TPU clusters needed to serve exploding AI demand.
**Competitive Validation:** Even OpenAI, Google's biggest AI rival, is now renting Google's TPU chips to power ChatGPT—choosing Google's proprietary hardware over Nvidia GPUs for cost-effective inference. This partnership alone validates the integrated hardware-software advantage.
**Market Leadership:** With AI Overviews reaching 2+ billion users (up from 1.5B last quarter) and Gemini hitting 450+ million users, Google is proving it can deploy AI at unprecedented scale while generating immediate revenue.
## The Core Flywheel System
**The Engine:** World-class AI research (DeepMind, Google AI) creating increasingly capable models that serve as tools for invention, not just products. Gemini's rapid user growth proves the models are competitive.
**The Fuel:** Search and YouTube revenue provides patient capital for long-term moonshots, while diverse data from billions of users continuously improves AI models. Q2's strong advertising performance ($64B+) funds the entire system.
**Custom Hardware Advantage:** Proprietary TPUs optimized for their AI software create faster, more efficient training and inference than competitors using general-purpose chips. OpenAI's adoption proves TPUs offer superior cost-performance.
**The Multiplier:** Quantum computing research that could eventually solve problems impossible for classical computers, creating step-change advantages in materials science and optimization.
## AI Integration Across the Ecosystem: The Ultimate Moat
Alphabet's true competitive advantage lies in **embedding AI across their existing billion-user platforms**, creating compound defensibility:
**Search Dominance:** AI Overviews now appear in 2+ billion monthly searches across 200+ countries, fundamentally changing how users interact with information while maintaining Google's search monopoly. Users increasingly expect AI-powered results, making switching costs even higher.
**Productivity Lock-in:** Gmail's Smart Compose, Google Docs' AI writing assistance, and Sheets' intelligent data analysis create sticky enterprise and consumer habits. Once teams adopt AI-enhanced workflows in Google Workspace, migration becomes exponentially more difficult.
**Developer Ecosystem:** Google's coding tools (Colab, Android Studio) now feature AI pair programming, while languages like Go and Dart benefit from AI-optimized development. This creates a generation of developers trained on Google's AI tools.
**Educational Moat:** Chromebooks in schools now include AI tutoring and personalized learning, creating habits among students who will become tomorrow's decision-makers. Google for Education's AI features make alternative platforms seem primitive.
**Entertainment Integration:** YouTube's AI-powered recommendations, creator tools, and content moderation have become so sophisticated that creators and viewers alike can't imagine the platform without them. This strengthens YouTube's dominance over TikTok and other competitors.
**Mobile and Browser Dominance:** Android and Chrome's AI features (Smart Reply, intelligent autofill, predictive text) create seamless experiences that competitors struggle to match without Google's data advantages.
## Near-Term Flywheel Accelerators
**Physical AI & Robotics:** Moving from digital-only AI to robots that can perceive and manipulate the physical world. Waymo has now driven 100+ million autonomous miles, generating unique physical-world training data.
**AI Biology:** DeepMind's protein folding breakthroughs and Isomorphic Labs' drug discovery pipeline could create massive pharmaceutical revenues while advancing the core AI engine.
**AI Materials Science:** Already discovering thousands of new materials that could dramatically improve batteries, semiconductors, and other hardware across all ventures—feeding back into better TPUs and infrastructure.
## The Compounding Network Effects
**Data Flywheel:** More users → More training data → Better AI models → Better products → More users. AI Overviews now drive 10%+ more queries for the types of searches that show them.
**Revenue Flywheel:** AI success → Higher cloud/advertising revenue → More R&D investment → Better AI → Market expansion. Google Cloud's 32% growth funds continued AI leadership.
**Talent Flywheel:** Best AI infrastructure → Attracts top researchers → Better models → More ambitious projects → Attracts even better talent. The recent $2.4B Windsurf acquisition shows Alphabet winning the talent war.
**Infrastructure Flywheel:** More AI demand → Larger TPU deployments → Better hardware optimization → Lower costs → More competitive offerings → More demand.
**Ecosystem Lock-in:** AI features across Gmail, Docs, YouTube, Search, and Android create switching costs that compound across products. Users don't just leave Google Search—they'd have to abandon their entire digital workflow.
## The Strategic Moat Widens
While competitors excel in individual areas, Alphabet's advantage comes from **deep integration creating compound effects**:
- **Capital Moat:** The $85B capex commitment (13% increase from 2024) exceeds most competitors' total revenues
- **Integration Moat:** OpenAI using Google TPUs despite being competitors proves the hardware-software integration is unmatched
- **Scale Moat:** 2+ billion AI Overview users and $50B+ cloud run rate create network effects competitors can't replicate
- **Ecosystem Moat:** AI embedded across Search, Gmail, YouTube, Android, Chrome, and Workspace creates compounding switching costs
- **Innovation Velocity:** Time from AI research to deployed products at billion-user scale continues compressing
## The Key Insight
The Q2 earnings reveal that Alphabet isn't just building an AI company—**they're building the infrastructure that accelerates invention itself**. Each breakthrough feeds back into the system: new discoveries generate revenue that funds more research, create better tools for the next breakthrough, and attract top talent.
More importantly, they're embedding AI so deeply into users' daily workflows—from Gmail to YouTube to Search—that switching becomes not just inconvenient but practically impossible. When your email, documents, entertainment, and information all work seamlessly together through AI, why would you ever leave?
The $85 billion capex increase signals management's confidence that they're approaching "escape velocity"—where their innovation rate becomes impossible for competitors to match. While others debate AI spending, Alphabet is already demonstrating profitable AI deployment at unprecedented scale while simultaneously investing in the next acceleration phase.
**The Bottom Line:** Alphabet's integrated flywheel of AI research, proprietary hardware, massive data, and patient capital is creating an innovation velocity that competitors are finding increasingly difficult to match. But their true moat is embedding AI so deeply into billions of users' daily habits that the entire Google ecosystem becomes indispensable—and the Q2 results prove this strategy is already working.

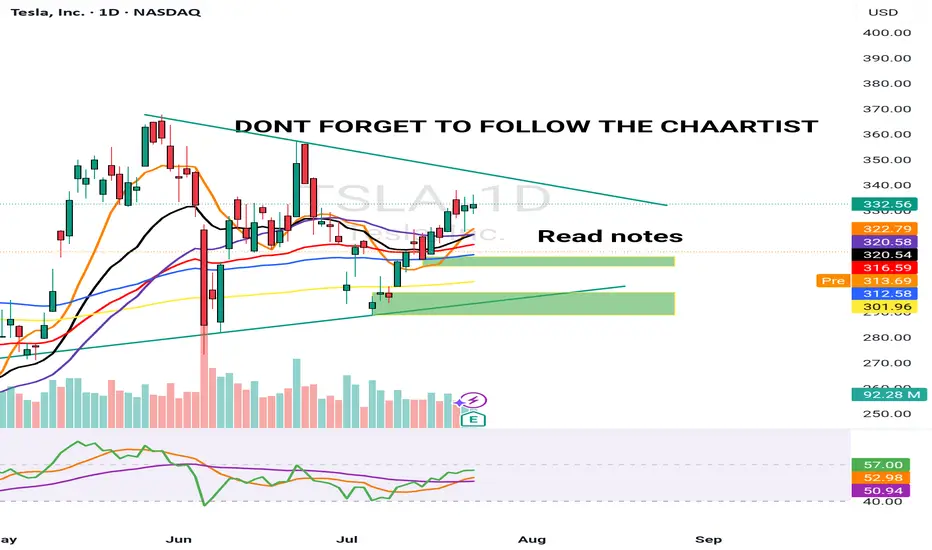
TSLA 24 JULY 2025I have marked 2 levels in green boxes. Price is inside this box pre market and TSLA is down -8.5% from the highs of $338 post market till $310 & -7.5% down from yesterday's close
A better level is the lower demand zone but its not the best. Price has not hit any major resistance.
My job is to read the data & trade. I am still bullish & 10% up down move is normal for Tesla &
This could be a "BEAR TRAP".
NCNA could double from here Target 0.2$🚀 Why NuCana plc (NCNA) NASDAQ:NCNA Could Double from Here
📉 Attractive Valuation & Technical Setup
Trading around $0.052–$0.053, NCNA is holding strong near key support.
Recent volume spikes and price bounces off moving averages suggest growing buying interest.
A breakout above resistance could send NCNA soaring toward double its current price.
💉 Biotech Catalysts
Upcoming clinical trial results, approvals, or partnerships could trigger sharp jumps.
Biotech stocks often rally hard on positive news, especially low-priced ones like NCNA.
📊 Market Sentiment & Volume
Volume surges indicate potential accumulation by institutions or investors.
Strong fundamentals and possible deals could boost confidence further.
🎯 Price Targets
A move toward $0.10–$0.11 (about 2x current price) is feasible with positive momentum or news.
Summary: NCNA’s solid technical base, promising biotech catalysts, and increasing volume may drive a substantial rally—potentially doubling soon.

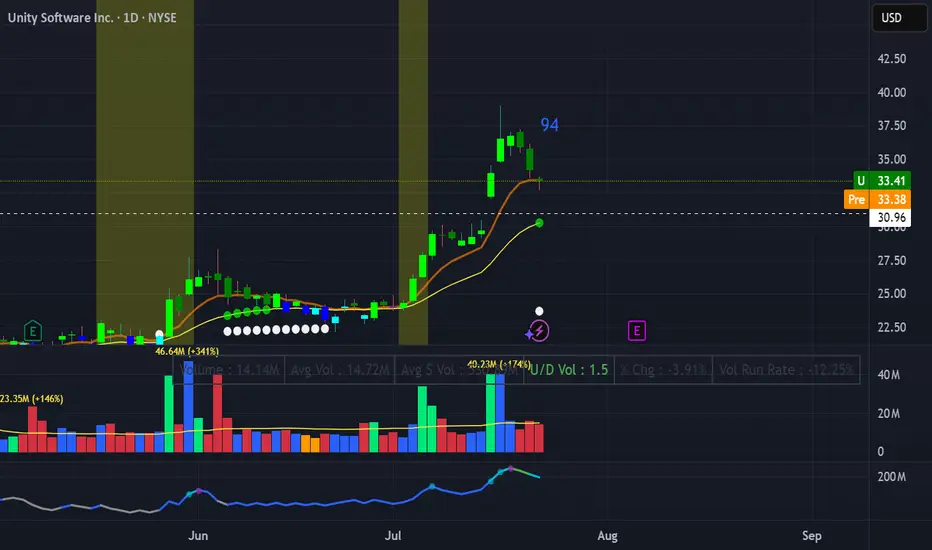
U Retest gap upSetup: Retest after gap up (on news)
RS 94
-uptrend
-volum contraction
-gap up not on EPS/Sales just on news. De volume when the news is damn high
Play:
entrty: Break above yesterday high , small position "buy the rumor sell the news" next earnings on 6/8
Stop loss; under candle yesterday
Target 2.5R, pivot
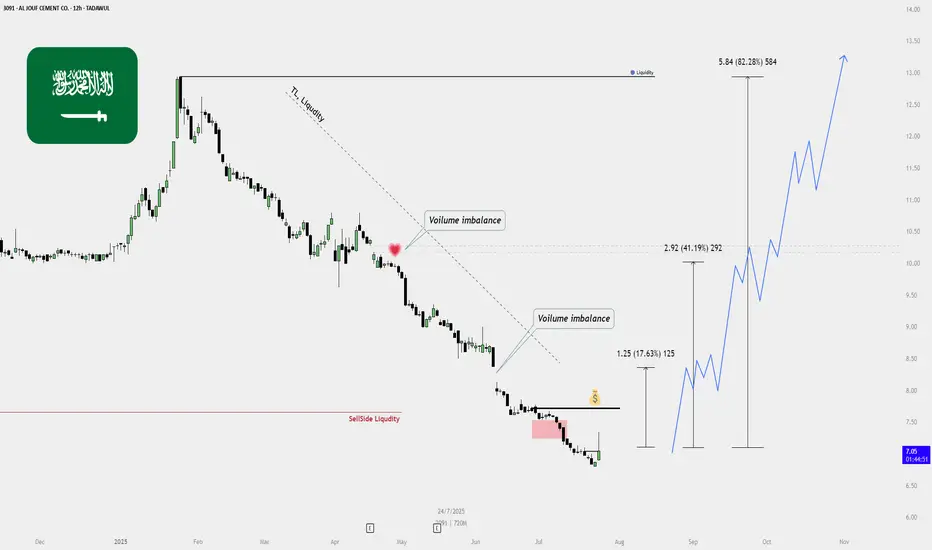
AL JOUF CEMENT – BUY PLAN (TADAWUL: 3091)📈 AL JOUF CEMENT – BUY PLAN (TADAWUL: 3091)
✅ Current Status:
Price: 7.09 SAR
Action: Initial entry taken — some shares added to My portfolio.
🔍 Technical Overview:
Sell-side Liquidity Cleared:
Previous lows taken out, triggering liquidity sweep.
Strong reversal suggests potential shift in market sentiment.
Volume Imbalances (Voids):
Bullish targets marked based on unfilled volume gaps:
📍 Target 1: 8.34 SAR (➕17.63%)
📍 Target 2: 10.01 SAR (➕41.19%)
📍 Target 3: 12.93 SAR (➕82.28%)
Trendline Liquidity Above:
Long-term descending trendline can act as a magnet for price, drawing it upward.
Bullish Confirmation:
Price has reacted from a bearish fair value gap.
Clean bullish engulfing and strong volume — suggests start of reversal.
🎯 Buy Strategy Breakdown:
Step Action
✅ Partial buy/entry completed (accumulation started)
📉 Wait for small pullback or bullish continuation to add more
🛡️ Stop Loss: Below recent swing low (around 6.50 SAR)
🚀 Targets: TP1 – 8.34, TP2 – 10.01, TP3 – 12.93
🔁 Re-evaluate plan if price closes below 6.70 with volume
Autonomous Maritime Platforms & AI: OPTT at the Crossroads 🔧 Core business
Ocean Power Technologies develops low-carbon, autonomous maritime systems: PowerBuoy® platforms combining wave, solar, and wind energy, and WAM‑V® autonomous surface vessels for sectors like defense, offshore energy, scientific research and environmental.
Their integrated Merrows™ AI suite enables advanced ocean monitoring with subsea sensors and 5G connectivity.
📈 Past 3 Years (2022–2025)
2022: DOE grant to advance MOSWEC wave energy converter and refine the PowerBuoy design
Ocean Power Technologies
2023–2024: OEM partnership with Teledyne Marine, strategic alliances with Red Cat (drone integration) and distribution with Remah International in the UAE for deployment of PowerBuoys and WAM‑Vs
May 2024: Approached 15 MWh of global renewable energy production across deployments in the Atlantic, Pacific, Mediterranean, and North Sea
Late 2024: Completed over four months of offshore testing of its Next‑Gen PowerBuoy off New Jersey, with 100% data uptime and battery state-of-charge above 90%.
Pipeline and backlog surge: Q3 FY25 backlog raised to $7.5 M, pipeline ~$92 M, up sharply year-on-year
Cost reductions: Operating expense declined by 39% in Q1 FY25, net loss narrowed, on track for profitability in calendar 2025
March 2025: Added sales executive for U.S. defense agencies; showcased WAM‑V and PowerBuoy AI at NAVDEX Abu Dhabi with RIG
🚀 Next 3 Years (2025–2028)
Plan to reach profitability in 2025, transitioning fully from R&D to commercialization
Expanding into Latin America, Middle East, Europe, and strengthening U.S. defense market presence through new reseller agreements
Deploying PowerBuoy and WAM‑V systems for defense, hydrographic surveys, maritime monitoring, and environmental projects.
Further technology enhancements—AI-based autonomy, enhanced sensor payloads, modular marine energy systems.
Participating in global conferences and trade shows to boost visibility and strategic networks (over 15 events globally in early 2025)
This study it's pulished only as a case study.
This is not a financial advise, please do your own research.

Breakout on Vodafone?Looks like a Head and shoulders reversal, plus breakout this week. Too early to say though as it still needs confirmation. Could still be a fake-out?
This is not a solicitation to trade in Vodafone shares.

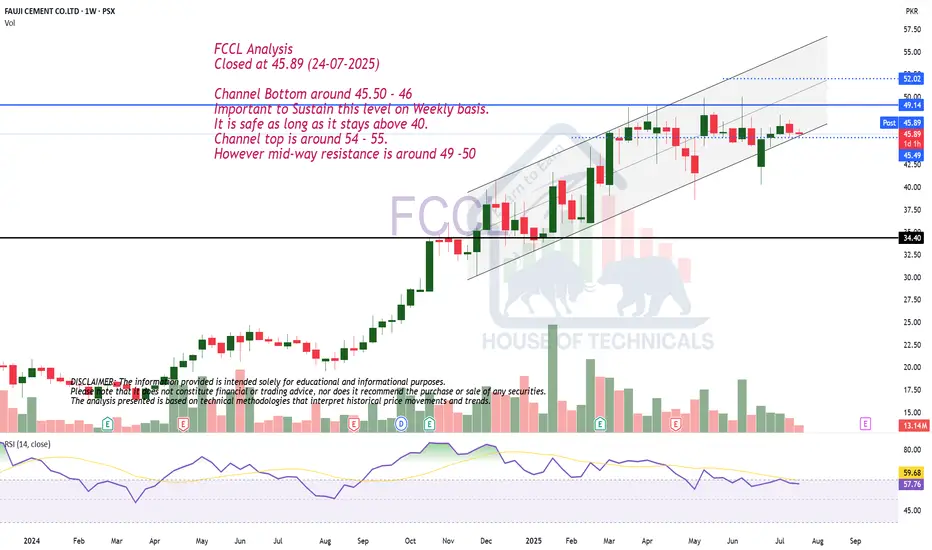
Channel TradingFCCL Analysis
Closed at 45.89 (24-07-2025)
Channel Bottom around 45.50 - 46
Important to Sustain this level on Weekly basis.
It is safe as long as it stays above 40.
Channel top is around 54 - 55.
However mid-way resistance is around 49 -50
Rocket Lab to new all time highs as more things go to spaceRocket Lab build rockets. CEO has an extremely bright aura. Hard to find a better story-driven pure space play with SpaceX being private. I like Rocket Lab and invested because as more and more things fly and go to space, it has the wind at its back.

Intel to 40. A bet on America's chip when the chips are downIntel is an interesting stock. I made a bet on it this week. It’s very cheap trading at book value. Lots of bad news has destroyed this stock while other chip stocks are at all time highs. With a new CEO running the show and investing in next gen chip production, I think he turns it around.
I think it's at 40 within a year, and makes new all time highs after that.

Breakout.POWER Analysis
Closed at 14.50 (24-07-2025)
Breakout.
a Very Strong Support seems to
be around 13.80 - 14.
Sustaining this level may lead it
towards 15 - 16.

Pull back slingshot GRPNNASDAQ:GRPN
Setup : pull back slingshot
-RS 98
-uptrend
-contaction in volume
-EPS double digit up (2/3) ,Sales down( 0/3)
Play:
Entry trigger 34.69 break out with enough volume
Stop loss: under break out candle
Target: 2.5R or ride the EMA next pivot point 41,16
!!Not covered by fundamentals!!

TSLA: Sell ideaHigh probability of a decline in TSLA according to the pattern shown on the chart. Target 271.62.
