SMCPL on the daily TFTotal day end volumes were 3.082M, which were approx. 6.50x of the Avg vol 20 days. Fresh volume of 0.709M got injected / added today, which is approx. 30% w.r.t to previous day.
Daily RSI 88.46 and ADX at 50.16
Indicators are +ve and can be watched, BUT with caution, please

TGT: Breakout From a 6-Month Base — Structure, MomentumThis NYSE:TGT setup is a great example of how structure + signal alignment can give traders a clean, high-probability play without chasing hype.
🔍 Breakdown: Why This Setup Matters
6-Month Base Breakout
Target spent half the year building a rounded base just below the Ichimoku cloud. The breakout above $100 is more than a number — it’s a psychological + structural shift. Buyers are finally in control.
Ichimoku Confirmation
Price cleared the cloud with a bullish TK cross weeks ago. Now, we’ve broken R1 pivot resistance and are sitting cleanly above the cloud. The trend is now officially flipped.
MACD Momentum
The MACD has been rising steadily, supporting the move. Green bars are growing in strength — no divergence or fade.
Risk/Reward
Entry: $102.43
Target: $127.07 (+23.31%)
Stop: $94.09 (–8.14%)
R/R: 2.87 — not extreme, but solid and realistic

Markets Running Out SteamWatch the vol as we head into resistance
XLF IWM are weak. Still in earnings season
have stops in place

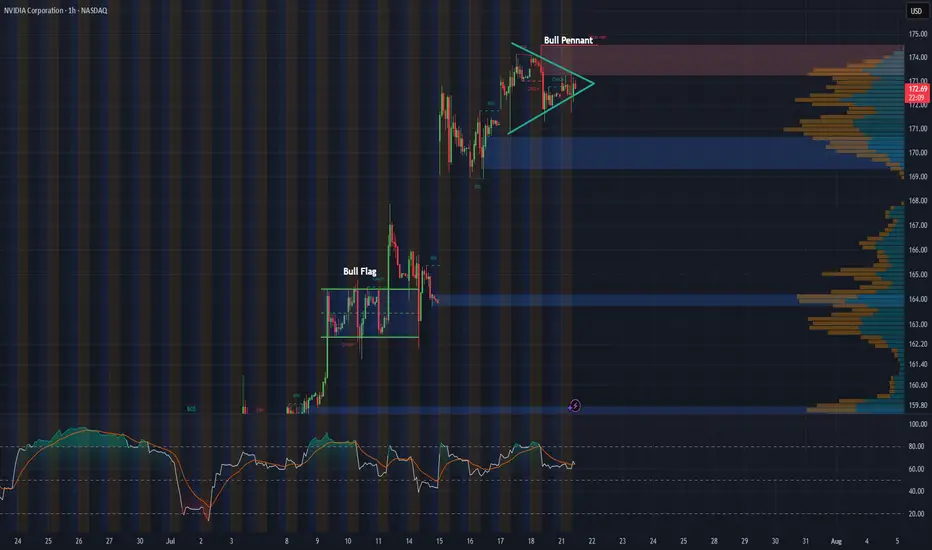
NVDA 1-Hour Chart UpdateHey everyone, just wanted to share a quick update on NVDA’s 1-hour chart. Following last week’s bull flag breakout, the stock appears to be consolidating into what looks like a solid bull pennant formation.
With major tech earnings on the horizon and the recent approval to sell H20 chips to China, this pattern could be setting the stage for another breakout. Will NVDA continue its impressive rally, or is this just a breather before the next move?
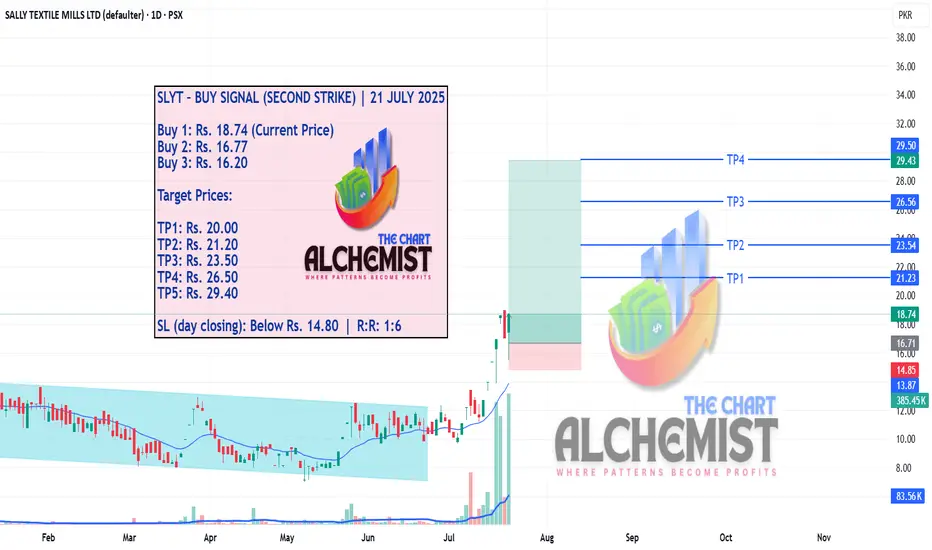
SLYT – BUY SIGNAL (SECOND STRIKE) | 21 JULY 2025 SLYT – BUY SIGNAL (SECOND STRIKE) | 21 JULY 2025
We previously gave a buy call for SLYT, which achieved all its targets. As highlighted earlier, the stock experienced a sharp downtrend from Rs. 45.10 to Rs. 10.90, followed by a multi-month accumulation phase from November until its recent breakout.
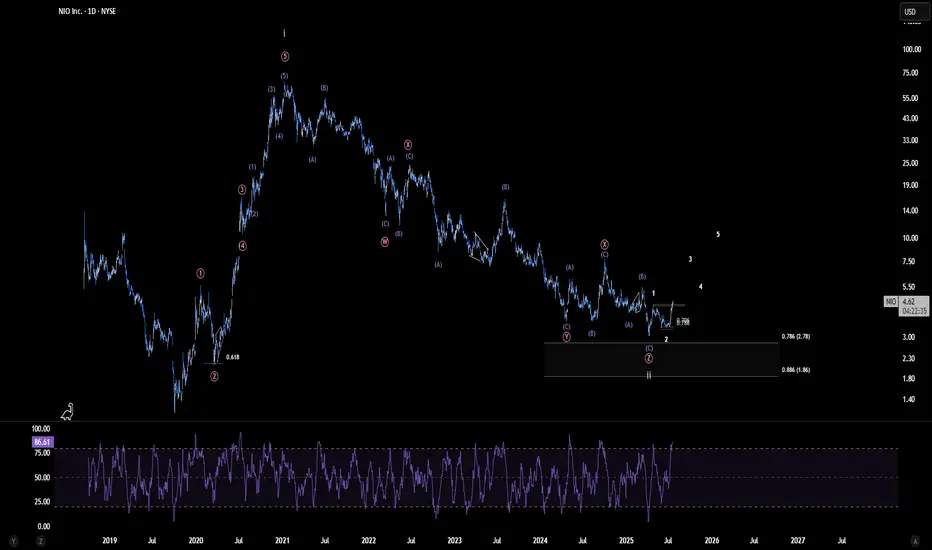
NIO - Start of a major Breakout? | Ew analysisPersonally, I see only two realistic scenarios for NIO: either the major correction has already concluded, or we are very close to its completion. The scenario presented here appears the most compelling, as it allows for the possibility of a significant bullish impulse beginning to unfold toward the end of Q4 2025—potentially fueled by improved profitability prospects and the company's continued push toward long-term operational efficiency.
SMCPL – BUY SIGNAL (FIFTH STRIKE) | 21 JULY 2025 SMCPL – BUY SIGNAL (FIFTH STRIKE) | 21 JULY 2025
We previously gave four successful buy calls for SMCPL, all of which achieved their targets. After the last breakout, the stock entered a shallow pullback, which now appears to be complete. With strong support holding, the setup indicates readiness for a fifth upward leg toward fresh quantified displacement targets.

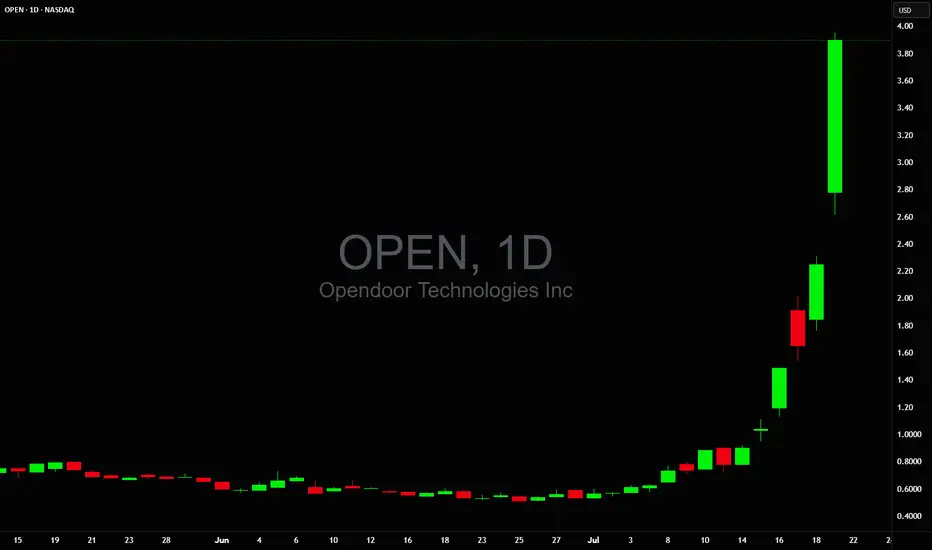
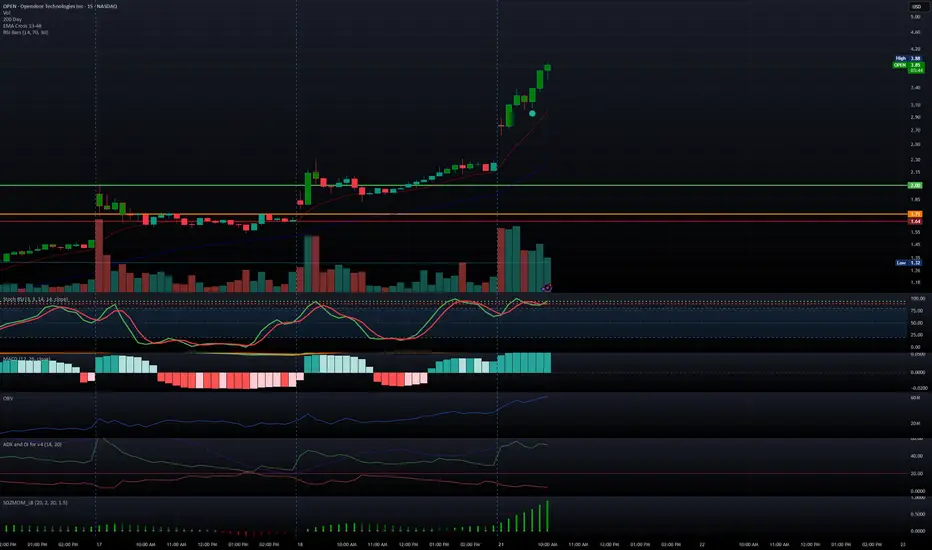
$0.50 to $4.00 up nearly 1,000% in the past trading days😲 $0.50 to $4.00 up nearly 1,000% in the past trading days 💥 600 Million shares traded today so far
People must be thinking NASDAQ:OPEN means stock of OpenAI, hey everyone this is not ChatGPT stock
IGIHL – BUY SIGNAL | 21 JULY 2025IGIHL – BUY SIGNAL | 21 JULY 2025
IGIHL has been trending within a prolonged trading range and recently gave a breakout above Rs. 220. After the breakout, the stock completed a spike phase, marking a high around Rs. 299, followed by a lateral pullback. This pullback now appears to be over, and the stock is positioned to resume its ascent toward multiple qualified displacement targets.

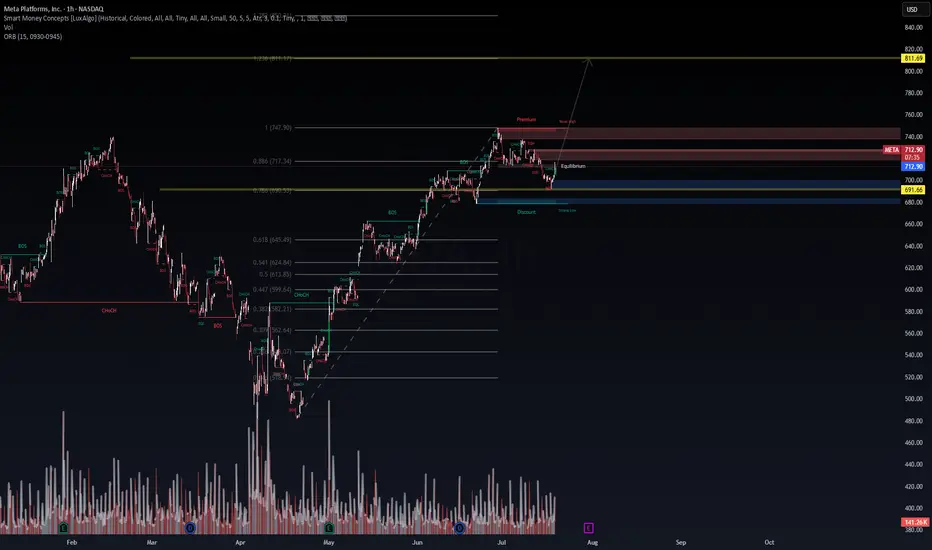
META – Institutional Buy Setup Active | VolanX Protocol Update📡 META – Institutional Buy Setup Active | VolanX Protocol Update
🧠 Price Intelligence Framework: WaverVanir DSS
The institutional model forecasts META to reach $760.64 in the next 15 trading days with a 95% confidence interval between $748.81 – $762.83. Signal is confirmed by 9/9 bullish model consensus.
🔍 Smart Money Concepts (SMC)
Price is rebounding from Equilibrium Zone (~$712.98) after discount mitigation. Liquidity structure favors bullish continuation toward:
🎯 Target 1: $727.63
🎯 Target 2: $760.64
🏁 Extended Target: $811.69 (1.272 extension)
📉 Risk Parameters (From DSS):
Entry: $713.36
Stop: $684.68 (4.0% risk)
Risk/Reward: 1.65:1
Volatility: 1.54% (low)
Capital Allocation: 25% of strategy layer
📈 Options Flow Validation:
Unusual activity observed across $720–$750 calls (Jul 25–Aug 22). Institutions are loading positions aggressively with >$2M notional in call sweeps.
Thesis: META is in an SMC bullish structure with alignment from AI forecasting, liquidity mapping, and options flow. VolanX Protocol confirms directional probability with low variance risk.
📌 Watch zone: $760 → $811
📌 Increased momentum if $717.34 (0.886 Fib) breaks cleanly
📌 Invalidation on close below $684
#META #VolanX #WaverVanir #SmartMoneyConcepts #OptionsFlow #TradingView #AITrading #InstitutionalSignals #Fibonacci #BreakoutSetup #LSTMForecast #TechnicalAnalysis
NRSL – BUY SIGNAL (SECOND STRIKE) | 21 JULY 2025 NRSL – BUY SIGNAL (SECOND STRIKE) | 21 JULY 2025
We previously issued a buy call for NRSL, which remains valid. The stock recently marked a high of Rs. 38.10 before entering a pullback. That pullback now appears complete, and the stock is showing signs of resuming its upward move toward fresh displacement targets.

ASTM – BUY SIGNAL (SECOND STRIKE) | 21 JULY 2025 ASTM – BUY SIGNAL (SECOND STRIKE) | 21 JULY 2025
We previously gave a buy call for ASTM, which successfully achieved all targets, hitting a high of Rs. 19.80. The stock had earlier been moving in a downtrend within a bearish channel marked in light pink. Recently, it formed a bullish structure that provides strong support and marks the end of the pullback phase. The setup now signals readiness for a second upward leg toward multiple qualified displacement targets.

FEM – BUY SIGNAL | 21 JULY 2025 FEM – BUY SIGNAL | 21 JULY 2025
FEM was previously in a downtrend before entering an accumulation phase marked by a light blue channel. It then broke out, rising to a high of Rs. 6.30, and later pulled back. That pullback now seems to be over, with the stock showing strong potential to resume its upward trajectory toward multiple quantified displacement targets.

MDTL – BUY SIGNAL | 21 JULY 2025 MDTL MDTL – BUY SIGNAL | 21 JULY 2025
MDTL was previously in a downtrend within a light pink channel before reversing in a spike-like rally, reaching a high of Rs. 3.50. Since then, the stock entered a controlled pullback phase. That pullback now appears complete, and MDTL is showing signs of initiating another upward leg toward multiple quantified displacement targets.
save this format

Short Squeeze Data For OPEN| Metric Value
Short Interest : \~135.8 M shares (\~19–21% of float) |
Days to Cover: | \~1.5–1.8 days
Avg Volume: | \~56 M shares/day
Today’s Volume: | \~426 M shares (7.5× average)
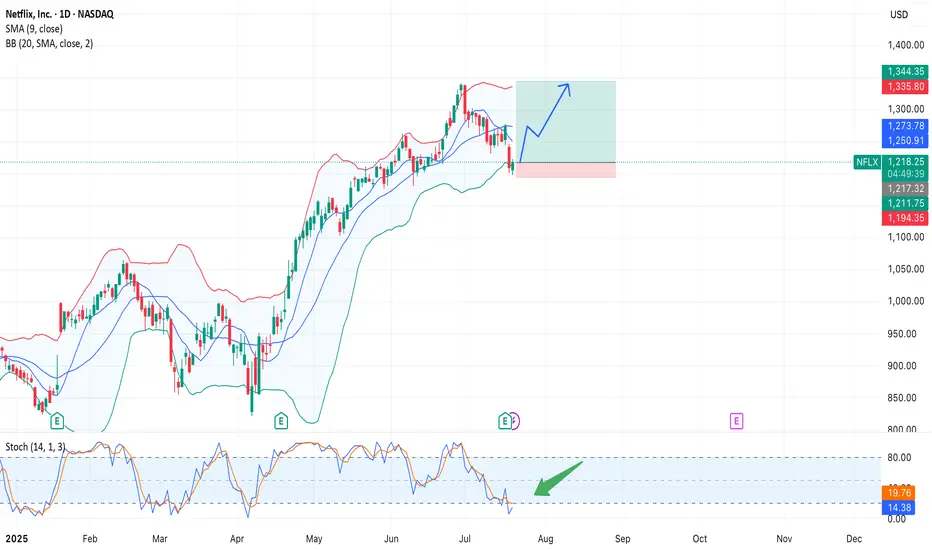
Netflix (NFLX) Long Setup – Bounce from Lower Bollinger Band $NASDAQ:NFLX. After pulling back from the $1350 area, Netflix stock is testing the lower Bollinger Band (BB 20/2σ), a level that previously acted as support.
At the same time, the Stochastic Oscillator (14,1,3) is in oversold territory and starting to curl upward, suggesting a potential bullish reversal.
Trade Setup:
• Entry: $1216 (current price)
• Target: $1283–$1300
• Stop Loss: $1194 (below BB lower band)
• Risk/Reward Ratio: 1:3+
Supporting Factors:
• Technical bounce from the lower Bollinger Band
• Price approaching SMA 9 (~$1250), potential breakout level
• Fundamental catalyst: Analysts at Baird and CICC raised their price targets to $1500 and $1350 respectively. Ad revenue is projected to quadruple by the end of 2025 due to stronger content engagement.
Risks:
• Q2 report met expectations, but weak forward guidance hurt sentiment
• A break below $1190 could lead to further downside pressure
DWTM – BUY SIGNAL | 21 JULY 2025DWTM – BUY SIGNAL | 21 JULY 2025
DWTM has been gradually trending downward within a bearish channel, which structurally resembles a bull flag—a continuation pattern in an uptrend. The stock is now showing signs of breaking out from this formation, indicating a potential upward rally toward multiple quantified displacement targets.

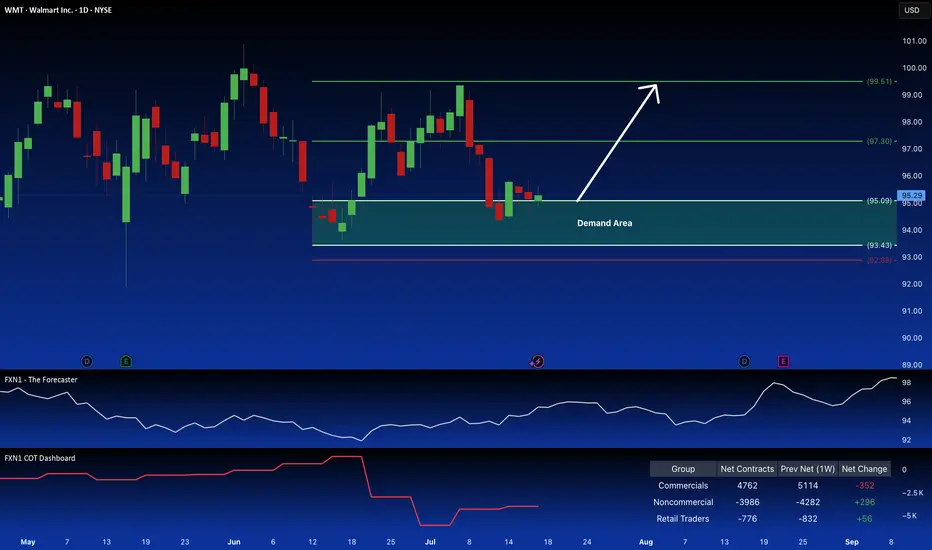
Walmart: Long Position Attractive on Demand ZoneWalmart Inc. presents a compelling long opportunity. The price action is reclaiming a key demand zone, suggesting a continuation of the current uptrend, a pattern reinforced by seasonal factors. Further bolstering the bullish case is the observed increase in large speculator positions.
✅ Please share your thoughts about WMT in the comments section below and HIT LIKE if you appreciate my analysis. Don't forget to FOLLOW ME; you will help us a lot with this small contribution.
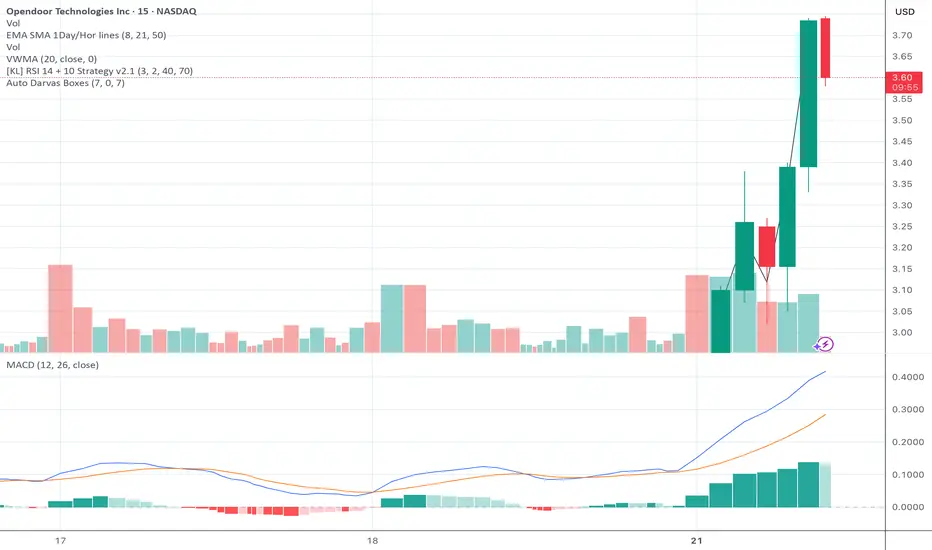
OPEN: textbook breakout from consolidationSpotted this on the scanner today. After ranging between 3.20 and 3.35, NASDAQ:OPEN broke out with solid volume and momentum, pushing up to a high of 3.70 for a clean intraday move of about 12 percent.
The setup included a clear Darvas box formation, a MACD crossover confirming momentum shift, and price action pushing above VWMA and key EMAs. Volume increased right as the breakout occurred, confirming buyer interest.
Support now sits around 3.47 at VWMA, and 3.35 as the top of the previous range. If price holds above 3.60, continuation into the 3.80 to 3.90 zone is on watch.
Strong breakout structure with clean technicals and follow-through. Worth keeping on the radar.
PPP – BUY SIGNAL (SECOND STRIKE) | 21 JULY 2025 PPP – BUY SIGNAL (SECOND STRIKE) | 21 JULY 2025
After a prolonged accumulation within a light blue channel, PPP gave a breakout and surged to a high of Rs. 190. It then entered a structured pullback phase and eventually broke out of it, achieving all targets from our previous call.

RBLX WEEKLY TRADE IDEA – JULY 21, 2025
🎮 NYSE:RBLX WEEKLY TRADE IDEA – JULY 21, 2025 🎮
📈 RSI MAXED. Volume Pumped. Call Flow on 🔥
This is a full-send momentum setup.
⸻
📊 Trade Setup
🔸 Direction: Long Call
🎯 Strike: $135.00
📆 Expiry: July 25, 2025 (4DTE)
💰 Entry Price: $0.63
🎯 Profit Target: $1.25 (💯%)
🛑 Stop Loss: $0.30 (~50% risk)
📈 Confidence: 🔵 85%
🕰️ Entry Timing: Market Open Monday
📦 Size: 1 Contract (2–3% of account)
⸻
🧠 Why This Trade?
✅ Daily RSI: 84.9 / Weekly RSI: 89.5 → 🔥 Overdrive
✅ Volume = 1.5x last week → Institutional buildup
💥 Call/Put Ratio = 3.42 → Unusual bullish options flow
📉 VIX at 16.7 → Smooth gamma conditions for calls
🧩 5/5 Momentum Signals Confirmed across models
⸻
⚠️ Key Risks to Watch
• RSI = 🚨 Overbought → Monitor for fakeouts
• Exit by Thursday to dodge Friday decay trap
• Watch news headlines – unexpected events can swing this
• Be ready to scale profits early if $137–138 tested quickly
⸻
🛠️ Execution Strategy
🔹 No spreads. Naked call only for max gamma upside
🔹 Trail profit >30% if price spikes early
🔹 Keep stop hard at $0.30 to guard against fade
⸻
🏁 Final Word:
This is a textbook breakout + flow setup.
Let the call ride early-week momentum, but exit smart before theta kicks in.
NYSE:RBLX 135C — Risk $0.30 to Target $1.25 🚀
Don’t chase. Enter clean. Manage tight.
⸻
#RBLX #OptionsTrading #CallOption #WeeklyMomentum #BreakoutTrade #UnusualOptionsActivity #TradingViewIdeas #BullishFlow #InstitutionalOrderFlow #Roblox

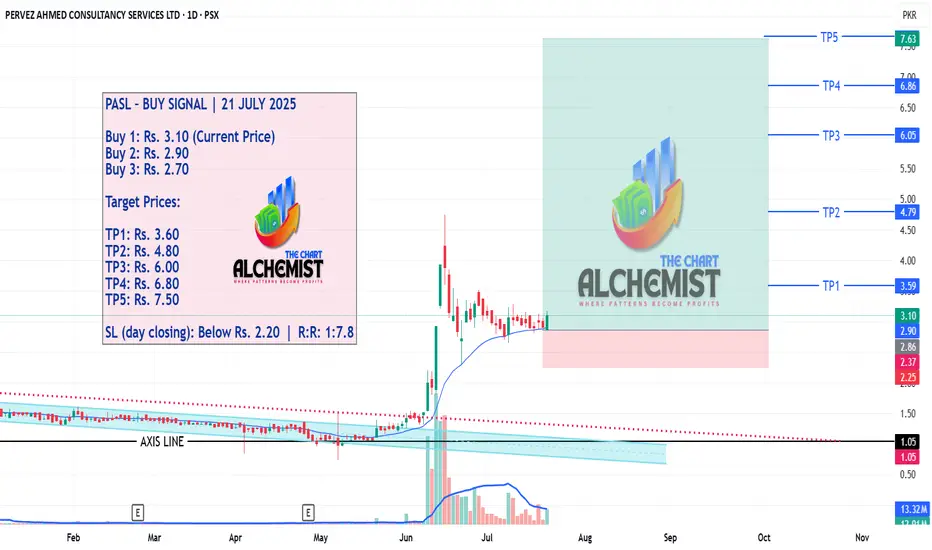
PASL – BUY SIGNAL | 21 JULY 2025 PASL – BUY SIGNAL | 21 JULY 2025
After conducting a spike phase that peaked at Rs. 4.76, PASL entered a gradual pullback phase. That pullback now appears to be complete, with price stabilizing and ready to launch toward multiple quantified displacement targets.
A BNPL Bubble Is Actually Why I'm Bullish, For NowBNPL is growing and inflating at an increasing rate. From concert tickets to burritos, everyone is using buy now pay later. The global market is projected to hit 560 billion dollars in 2025, up from around 492 billion in 2024, and climb to 912 billion by 2030 at a compounding growth rate of 10.2%. Just in the U.S. alone, demand is expected to reach 122 billion next year and scale to 184 billion by the end of the decade. The trajectory is steep, with the structural weaknesses already showing.
Block is positioned at the center of BNPL. In Q1 2025 they reported:
2.29 billion in gross profit, up 9 percent YoY
466 million in adjusted operating income, up 28%
10.3 billion in GMV through Afterpay, with 298 million in BNPL gross profit, up 23% YoY
The stock took a hit. It dropped 9 percent in February and another 21 percent after missing Q1 earnings, but this is seen as typical early bubble behavior. There is short term fear but continuing growth and acceleration. Klarna’s credit losses, IPO delays, and regulatory friction are not problems, they are actually signals that the sector is growing faster than the market, or quite frankly, anyone can control.
BNPL is becoming the default credit system for younger consumers. It is overused and expanding too fast. That is the formula for both upside and implosion. However with that, timing will be everything here, and knowing when to close will be crucial if BNPL can't stabilize.
Baseline expectation: SQ trades in the 80 to 90 range in the short term
Midterm upside: 120 by 2027
Long-term target: 180 to 220 if BNPL stabilizes and Block captures its runway
