Sharda motorsSharda Motor 🚘 | Strong Positional Setup
Price showing strength with supportive volumes.

Thread for followersPlease let me know if you want me to continue posting ideas and you are benefiting from this or not. feedback matters. Also, let me know if you want another social media channel to share so much easier for you.
By the way CLPT is a good one.
Thanks,

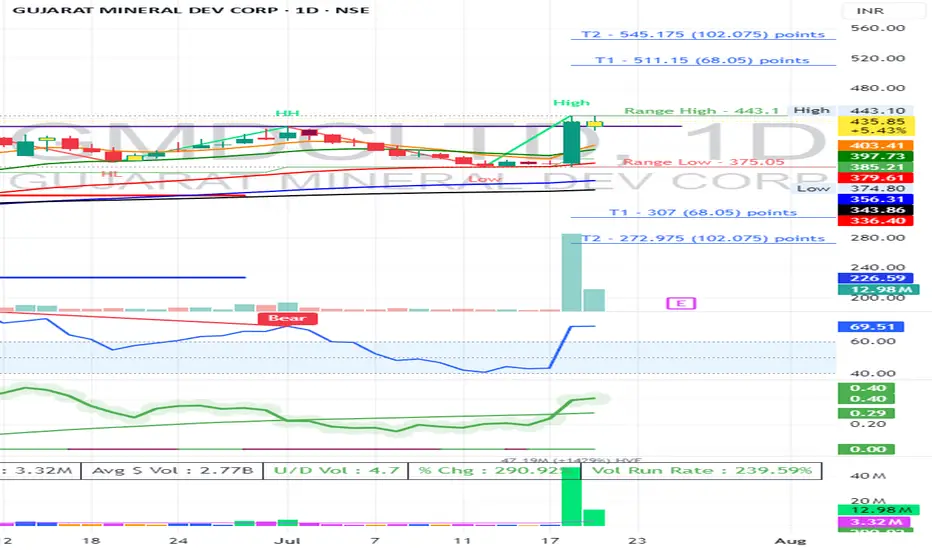
GMDC Inside Bar Strategy Entry 443
SL 422
RSI above 60 Daily / Weekly / Monthly
W Pattern formed
Volume Growth
PioneersA company specialized in the manufacturing of zero-gravity objects.
The price is approaching the purple support zone, where a partial entry could be considered while awaiting a bullish breakout of the blue resistance level.
If successful, the position can be increased.
For greater safety, one could wait for the breakout of the first light blue resistance level, where it may be possible to increase further.
Stop loss in case of a downward break of the purple support

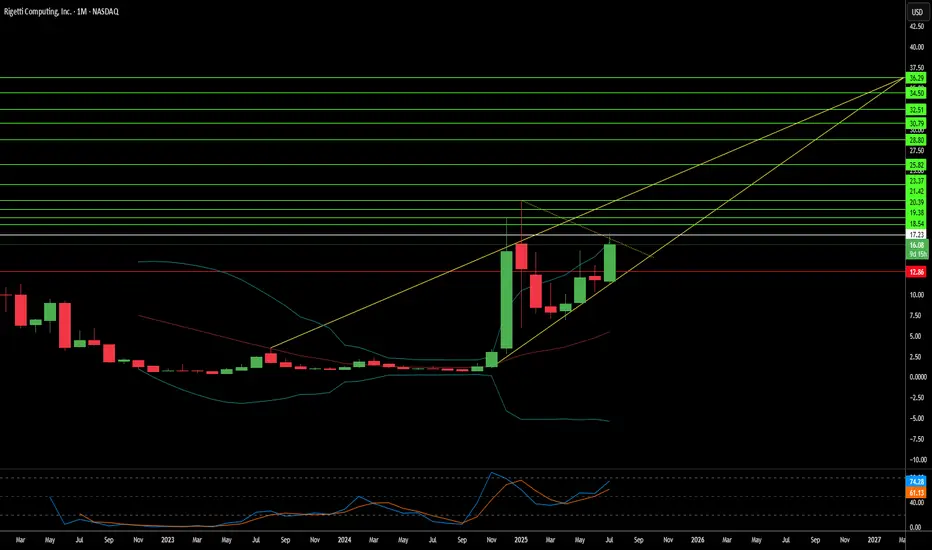
Rigetti: Quantum Mirage or Computing's Next Frontier?Rigetti Computing, a pioneer in quantum computing, recently commanded market attention with a significant 41% surge in its stock. This jump followed a critical technological breakthrough: achieving 99.5% median 2-qubit gate fidelity on its modular 36-qubit system. This represents a twofold reduction in error rates from previous benchmarks, a vital step toward practical quantum applications. Rigetti's superconducting qubits offer gate speeds over 1,000 times faster than competing modalities like ion traps, leveraging semiconductor industry techniques for scalability. The company plans to launch its 36-qubit system by mid-2025 and aims for a 100+ qubit system by year-end, underscoring its rapid technological roadmap.
Beyond technical achievements, strategic partnerships and government contracts bolster Rigetti's position. A substantial $100 million manufacturing deal and a $35 million equity investment from server giant Quanta validate Rigetti's modular architecture. Government backing also provides a stable revenue stream, including a $1 million DARPA award for developing "utility-scale quantum computing" and a $5.48 million Air Force consortium award for advanced chip fabrication. The company further secured three UK Innovate awards for quantum error correction. These collaborations signal confidence from both private industry and national defense initiatives, crucial for a sector still in its nascent stages of commercialization.
Despite these positives, Rigetti's financial metrics reflect the high-risk, high-reward nature of quantum investment. While its market capitalization stands at a robust $5.5 billion, Q1 2025 revenue declined over 50% year-over-year to $1.5 million. Operating expenses remain substantial, with the company operating at a loss. Rigetti's valuation hinges on future potential rather than current profitability, trading at a high price-to-sales ratio. This places immense pressure on the company to meet ambitious technological milestones and rapidly scale revenue in the coming years, transforming speculative bets into tangible commercial success.
The broader quantum computing landscape is marked by intense competition and geopolitical implications. Giants like IBM and Google, also leveraging superconducting qubits, race alongside Rigetti. The sector's projected market size varies wildly, reflecting ongoing uncertainty about widespread commercial adoption. From a geostrategic perspective, quantum computing poses both a national security threat to current encryption and an opportunity for military advancement, driving a global race in post-quantum cryptography. Rigetti's extensive patent portfolio, comprising 37 quantum computing patents, underscores its intellectual property differentiation. However, macroeconomic factors, including rising interest rates, could tighten venture capital funding for speculative high-tech ventures, adding another layer of complexity to Rigetti's path forward.
Watching: NFLXKeep an eye on NFLX. It is setting up for a potential bounce if we can get a close above the 5-SMA. Cheers!

Engro Bullish Swing Trade SetupRSI Divergence spotted – a sign of possible trend reversal.
Trend Reversal forming on the chart – momentum shifting towards upside.
Company Insider Buying – Engro executive bought shares worth Rs. 20 crore, showing strong confidence.
🔹 3 Bullish Signals

MAYUR UNIQcompany is giving good results qtr by qtr . It looks from chart that 750-800 is the resistance zone if we presume it to be C wave . If crosses 805-10 then cn target higher range of 900 plus level as 3rd wave would be confirmed.

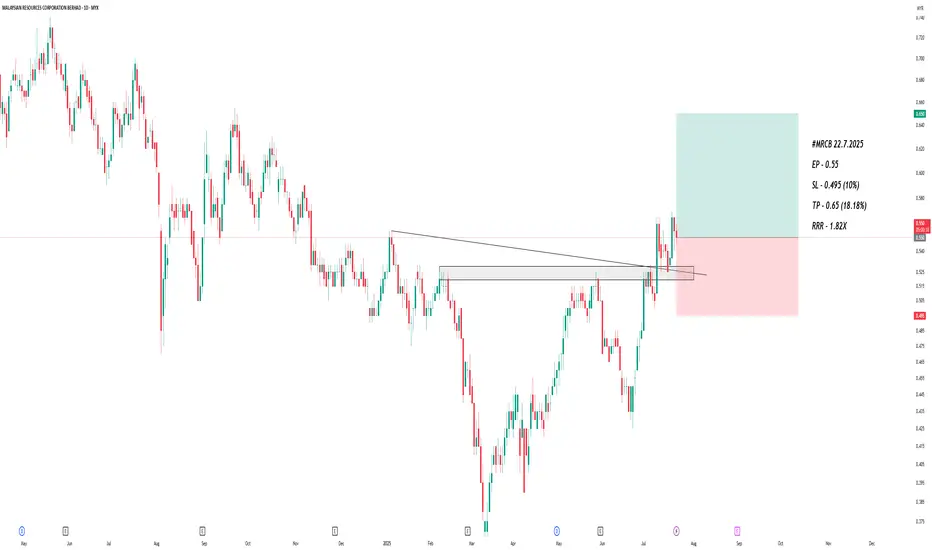
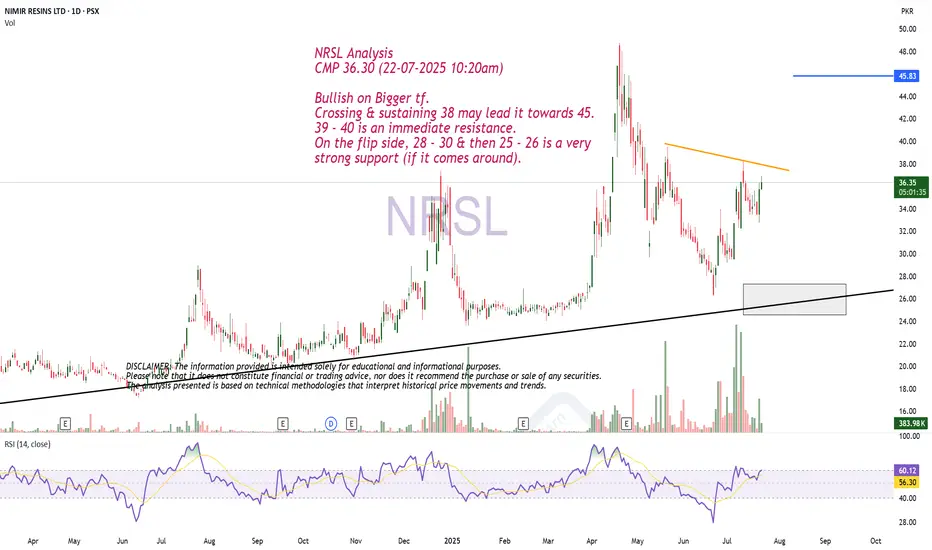
Bullish on Bigger tf.NRSL Analysis
CMP 36.30 (22-07-2025 10:20am)
Bullish on Bigger tf.
Crossing & sustaining 38 may lead it towards 45.
39 - 40 is an immediate resistance.
On the flip side, 28 - 30 & then 25 - 26 is a very
strong support (if it comes around).
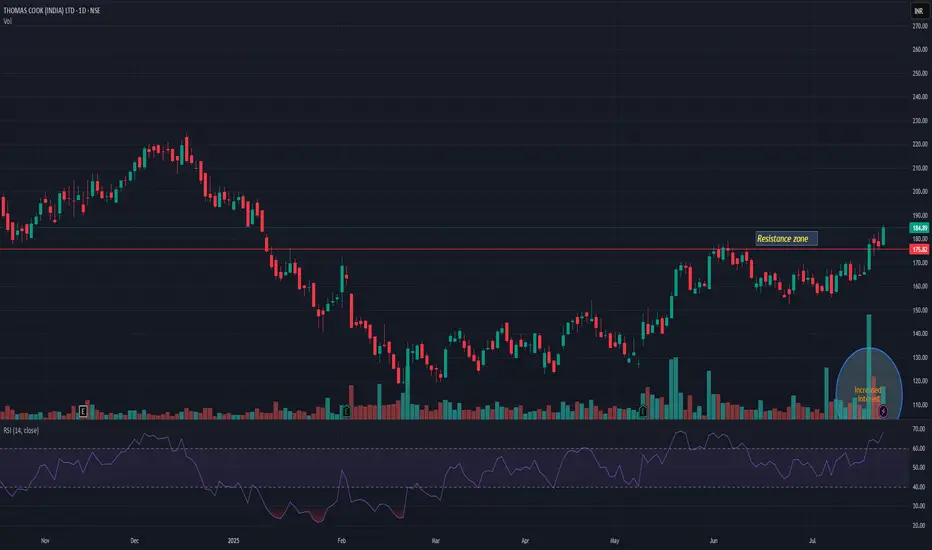
THOMASCOOKTHOMASCOOK has broken previous resistance level. Market participation is also increased with breakout. It may resist nr 210-12 level. Closing below 175 may change my view. Keep it on radar.
New Setup: METAMeta is now setting up for a potential bounce now. If the Markets can be positive tomorrow, we should see Meta also participate.

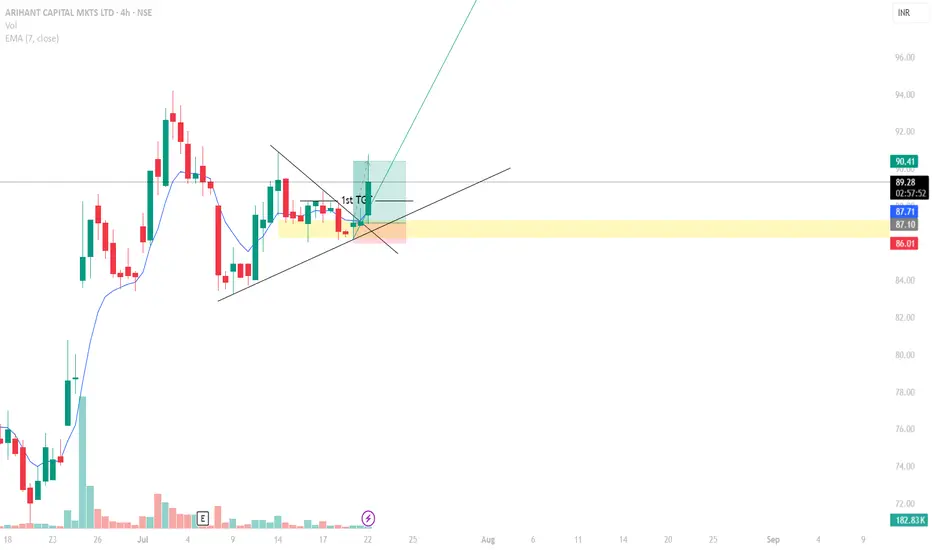
ARIHANT CAPITALSame Strategy!!!
Identified the golden zone and entered the trade.
Risk to Reward ratio of 3:1, booked a profit of Rs. 3 per share.
Although, the profit might seem small, but assume you have 1000 shares of the same stock and you are making Rs. 3000 in just 2 days,
Now you get it,
Its more about the setup and patience and hitting your TP than making profit.
Titan conflicting ideas Based of my pivot idea it looks like price should head down to 2795 approx, we have been rejected from R1 & Breakout levels
on second thought it honestly looks like we are in accumulation manipulation & distribution pattern, will be watching the green support zone for a reaction, if bullish reaction triggered will be longing the market for NEW ATH

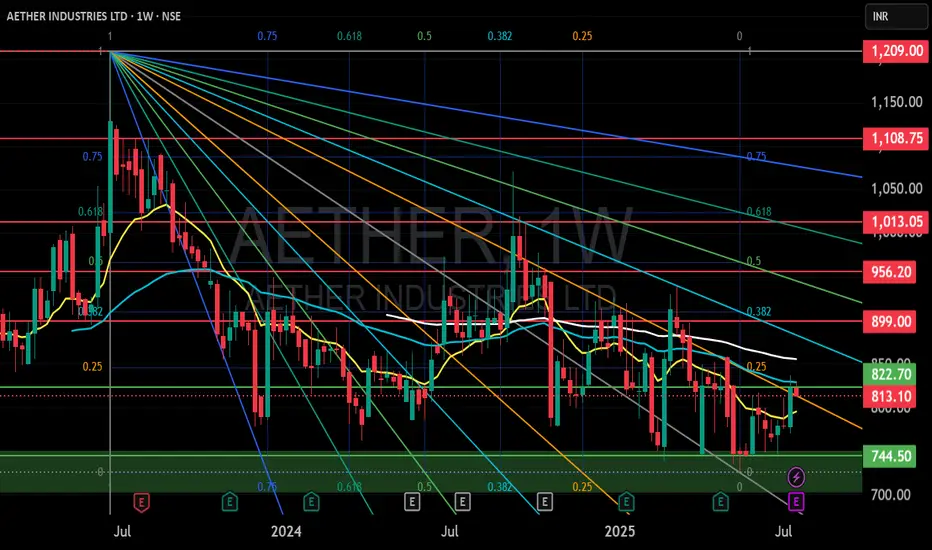
AETHER INDUSTRIES LTD S/R Support and Resistance Levels:
Support Levels: These are price points (green line/shade) where a downward trend may be halted due to a concentration of buying interest. Imagine them as a safety net where buyers step in, preventing further decline.
Resistance Levels: Conversely, resistance levels (red line/shade) are where upward trends might stall due to increased selling interest. They act like a ceiling where sellers come in to push prices down.
Breakouts:
Bullish Breakout: When the price moves above resistance, it often indicates strong buying interest and the potential for a continued uptrend. Traders may view this as a signal to buy or hold.
Bearish Breakout: When the price falls below support, it can signal strong selling interest and the potential for a continued downtrend. Traders might see this as a cue to sell or avoid buying.
MA Ribbon (EMA 20, EMA 50, EMA 100, EMA 200) :
Above EMA: If the stock price is above the EMA, it suggests a potential uptrend or bullish momentum.
Below EMA: If the stock price is below the EMA, it indicates a potential downtrend or bearish momentum.
Trendline: A trendline is a straight line drawn on a chart to represent the general direction of a data point set.
Uptrend Line: Drawn by connecting the lows in an upward trend. Indicates that the price is moving higher over time. Acts as a support level, where prices tend to bounce upward.
Downtrend Line: Drawn by connecting the highs in a downward trend. Indicates that the price is moving lower over time. It acts as a resistance level, where prices tend to drop.
Disclaimer:
I am not a SEBI registered. The information provided here is for learning purposes only and should not be interpreted as financial advice. Consider the broader market context and consult with a qualified financial advisor before making investment decisions.
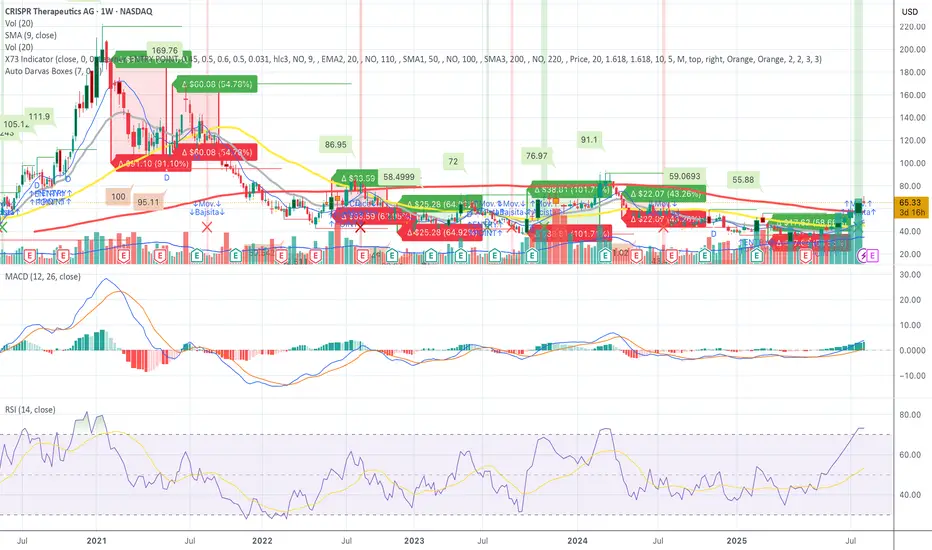
CRSP – Confirmed Breakout - Squeeze Pressure Mounting - Let's GoCRSP – Full Breakdown of the Short Squeeze Setup, Technicals, and Fundamentals
CRISPR Therapeutics (NASDAQ: NASDAQ:CRSP ) is currently setting up one of the most compelling short squeeze and momentum continuation trades in the biotech sector. After hours on July 22, 2025, the stock is trading at 67.00, pushing through a critical resistance zone with increasing volume and strong technical confirmation.
Short interest is estimated at approximately 25.5 million shares, representing between 28 and 31 percent of the float. Days to cover is between 5.8 and 9.7, which is considered high. This creates a risk zone for short sellers, especially as the stock moves higher. With the price moving above 65, many in-the-money call options are being triggered, increasing the likelihood of a gamma squeeze. This occurs when market makers must hedge their exposure by buying more shares, driving the price up further.
Open interest on call options has been building over the past month, particularly at the 65, 70, and 75 strike prices for the August 1 and August 16 expirations. October calls also show heavy volume. The August 16 70 call recently had over 1700 open contracts with more than 4400 contracts traded in a single session, indicating aggressive positioning.
On the weekly chart, price has now broken above 66.50, a major resistance zone. RSI is above 73, signaling strong momentum. The MACD has crossed bullish with rising histogram bars. The 50-week simple moving average sits around 72 to 73, marking the next area of resistance. Price is now trading above the 10, 20, and 50-week moving averages and has broken out from the previous Darvas Box range centered around 60.88.
CRSP is expected to report earnings around August 7 to August 12, 2025. In the previous quarter, the company reported a loss of 1.58 per share, missing expectations. Current estimates for Q2 range from negative 1.78 to negative 0.93, with a consensus near negative 1.40. Investors will be watching closely for updates on CRISPR’s gene therapy pipeline, especially the CTX001 program and oncology candidates. A positive earnings surprise or encouraging pipeline update could further drive upward price movement.
CRISPR Therapeutics focuses on developing gene-editing therapies based on CRISPR-Cas9. Key programs include CTX001 for sickle cell disease and beta thalassemia, CAR-T therapies for cancer, and regenerative medicine applications. The company has a strong cash position and continues to invest heavily in research and development.
Key support levels include 60.88 and 58.50. Immediate resistance is now 67.00, with the next target range between 72.50 and 76.00. If the short squeeze intensifies, a stretch target of 86.00 to 91.00 is possible. The all-time high for the stock is 169.76, reached in early 2021.
This setup includes a confirmed technical breakout, high short interest, heavy call option flow, and an upcoming earnings catalyst. The stock is now in play, and if it holds above 67.00, further upside pressure could continue into the August earnings release. This is a live squeeze and continuation setup with both technical and fundamental tailwinds.
TLKMDISCLAMER !!!!
Telkom is already in the support area and will start to rise to a target of 3,430-3,600
SL 2.700

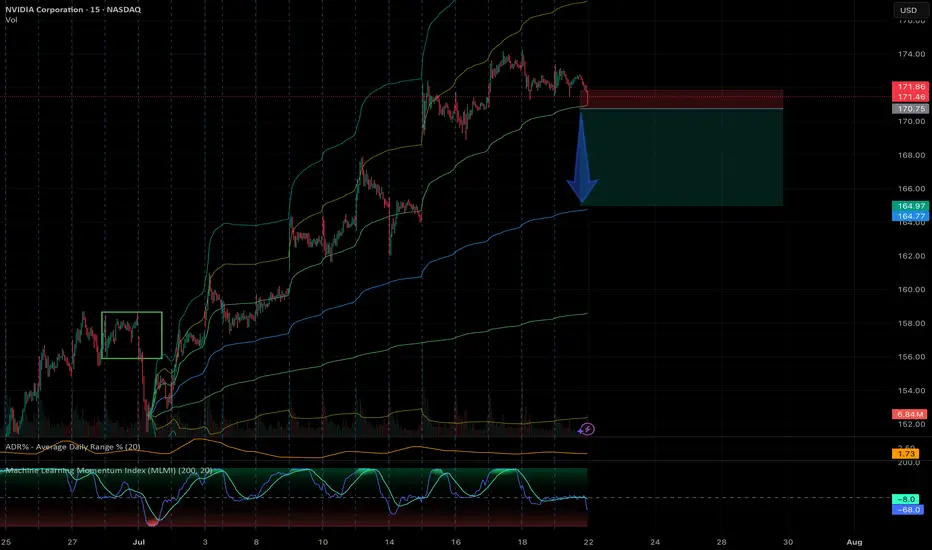
NVDA - AVWAP Breakdown15 Min MLMI appears to be breaking down, meaning that it will continue to fall further.
Stock likely to pull back to the monthly AVWAP level around $165.
JPFADISCLAMER !!!!
buy 1.710 and sl 1.400-1.420
tp1 2.140
If there is a breakout, you can hold until the next target price is 2,930.

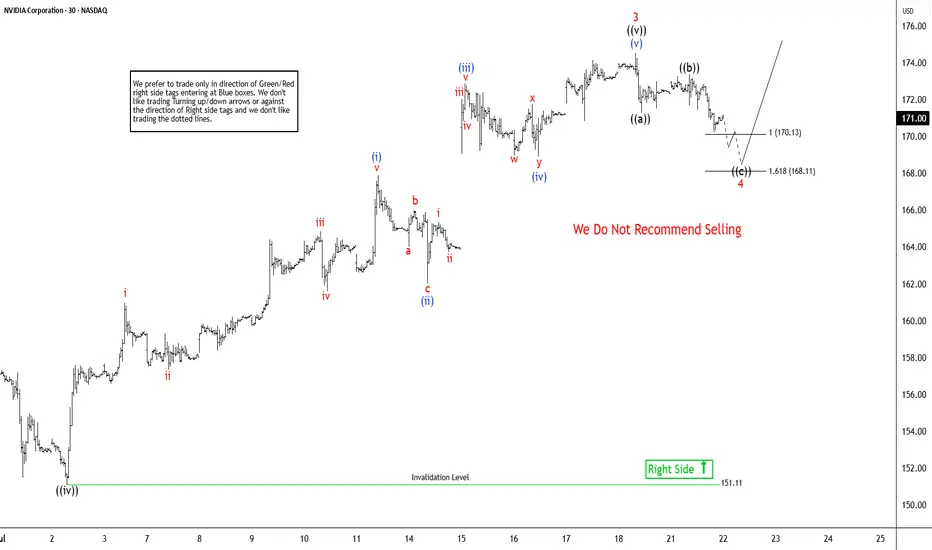
Elliott Wave Sequence In NVDA Suggests Rally From SupportNvidia (NVDA) continues rally to new all-time highs from April-2025 low and reinforcing a robust bullish outlook. In daily, it ended 7 swings pullback at 86.62 low in 4.07.2025 low started from 1.07.2025 high. Above April-2025 low, it confirmed higher high bullish sequence & pullback in 3, 7 or 11 swings should remain supported. Since April-2025 low, it favors rally in (3) of ((1)), while placed (1) at 115.44 high & (2) at 95.04 low in 4.21.2025. Above there, it placed 1 of (3) at 143.84 high, 2 as shallow connector at 132.93 low & 3 at 174.53 high. Wave (3) already extend beyond 2.0 Fibonacci extension of (1) & yet can see more upside. Within 1 of (3), it ended at ((i)) at 111.92 high, ((ii)) at 104.08 low, ((iii)) at 137.40 high, ((iv)) at 127.80 low & ((v)) at 143.84 high. Above 2 low, it placed ((i)) of 3 at 144 high, ((ii)) at 137.88 low, ((iii)) at 159.42 high, ((iv)) at 151.10 low & ((v)) at 174.53 high as 3 of (3).
It already reached the minimum area of 170.04 as inverse extension of connector. But it can see more upside as daily move showing highest momentum from April-2025 low. In 1-hour, above ((iv)) low, it placed (i) of ((v)) at 167.89 high in 5 swings, (ii) at 162.02 low, (iii) at 172.87 high, (iv) at 168.90 low & (v) of ((v)) at 174.53 high ended as 3. Currently, it favors pullback in 4 targeting into 170.13 - 168.11 area before rally in 5 or at least 3 swing bounce. Within 4, it ended ((a)) at 171.26 low, ((b)) at 173.38 high & favors lower in ((c)) of 4. It should find support in extreme area soon to turn higher for two more highs to finish ((1)). The next move in 5 of (3) can extend towards 175.9 or higher, while pullback stays above 168.11 low. The next two highs expect to come with momentum divergence to finish cycle from April-2025 low. Later it should see bigger pullback against April-2025 low in 3, 7 or 11 swings. But if it extends higher & erase momentum divergence, then it can see more upside.